Then came the actual printing, which was also time-consuming, followed by the distribution of the maps.
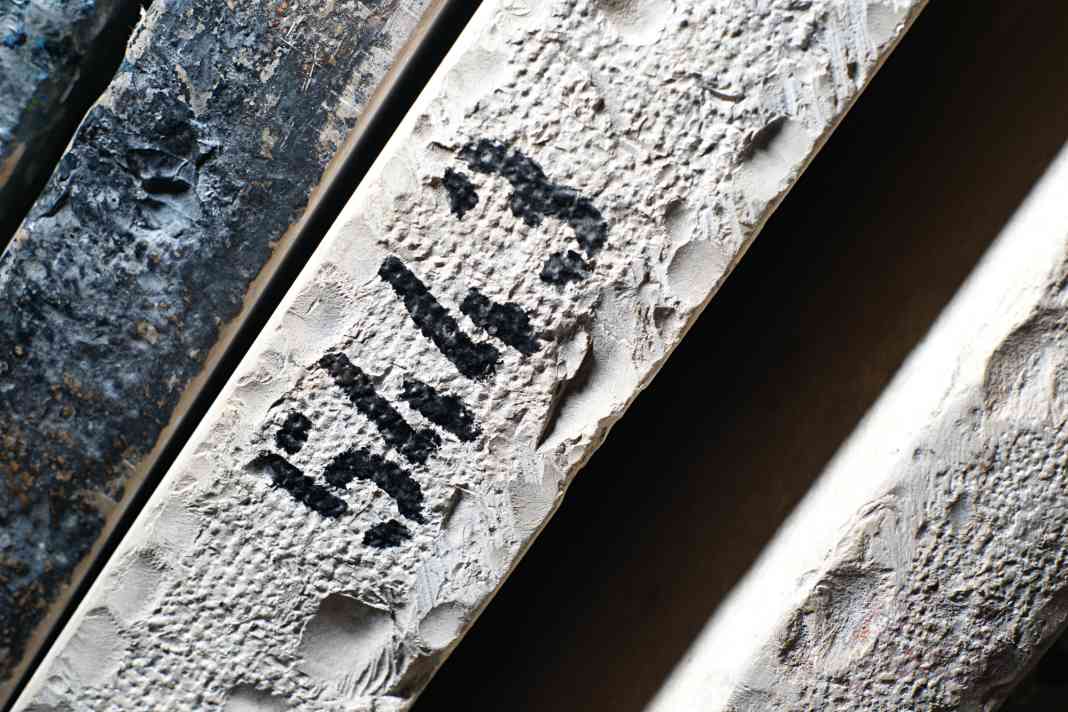
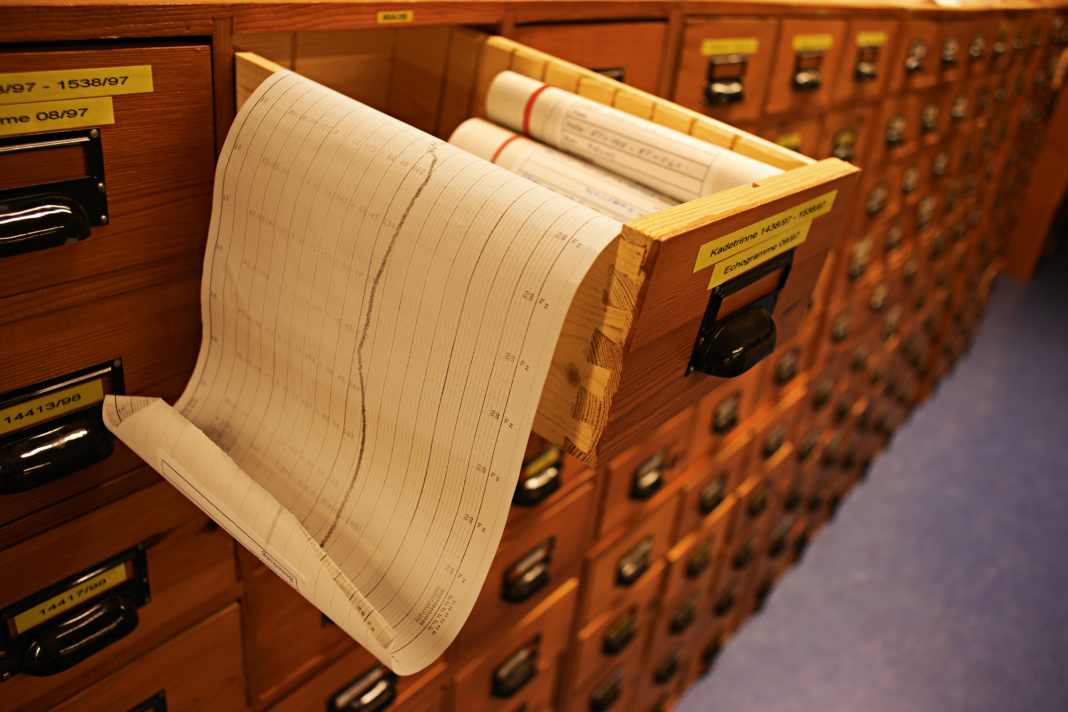
Every change in the map is documented on the continuation sheet.
Photo: Nils Theurer
In short, if the entire coastal area of a country was to appear on nautical charts, this was a matter of national importance.
This was also recognised in 1861, or rather only in Prussia.
They were a little late in realising this.
Spain, the USA, Russia, Portugal and Belgium had already had printed charts since 1800.
Prussia's "Sea Atlas" from 1841 already existed at the time and was even considered to be quite accurate.
However, the surveyors had only rowed one and a half to three kilometres out to sea with small open boats and mirror sextants and had determined the depths there with sounding rods and plumb bobs.
They had not ventured any further off the coast.
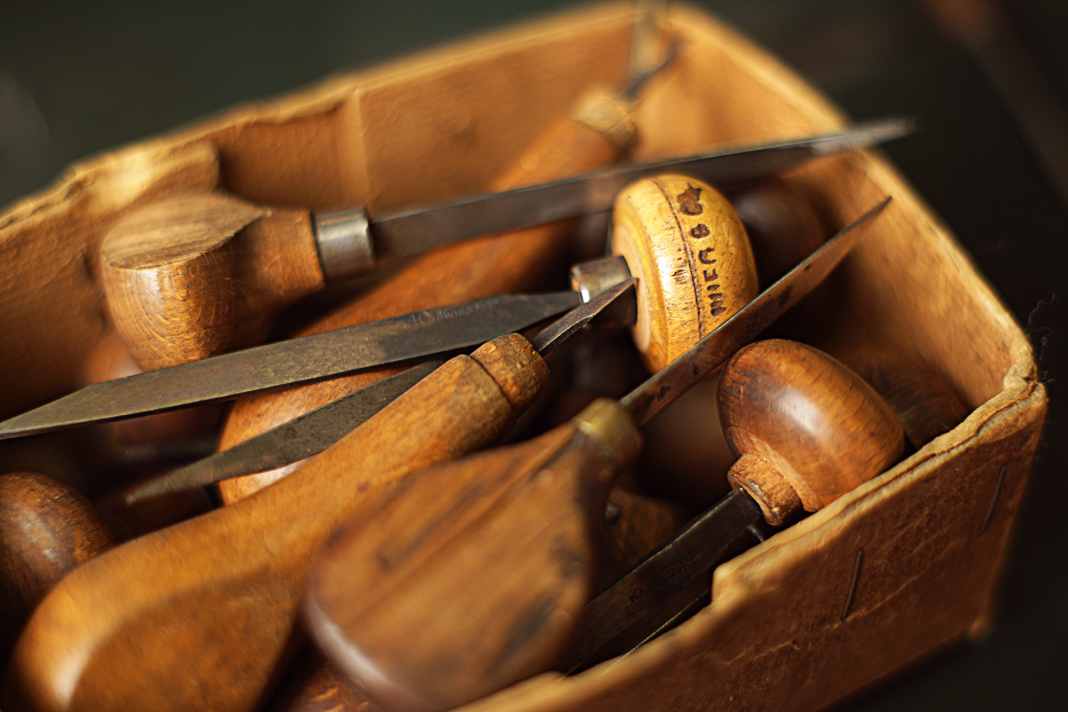
For
engraving, cartographers have various special tools at their disposal
to carve information and markings into the film coating
Photo: Nils Theurer
The state surveying offices The BSH, today's successor to the Hydrographic Bureau, currently has around 800 employees.
It started 151 years ago with a single chief cartographer and two draughtsmen.
It took six years for the first map to be published.
In the meantime, the coasts of the incorporated states of Schleswig-Holstein and Hanover fell to Prussia, which increased the tasks.
Nevertheless, by 1882, 21 years after the bureau was founded, 44 maps of the Baltic Sea, Belts, Sound and North Sea had been published.
In 1893, the cartographic staff was increased to nine men, and in 1896 to eleven.
At this time, surveys were also carried out off West Africa.
This resulted in nine maps.
The Bismarck Archipelago was also mapped, as was Kaiser Wilhelm Land, resulting in eight charts.
Finally, the sea off German East Africa was documented in 14 charts.
By 1899, 220 nautical charts had been produced - a remarkable achievement.
The tweezers are used to add tonnes and other information, which are applied to transparent films, to the card.
Photo: Nils Theurer
Admiral von Tirpitz, State Secretary in the Reich Navy Office, introduced a bill in the Reichstag the following year in which he called for the further expansion of the German nautical chart system to include non-domestic waters.
The German colonies were still considered the home coast.
Two years later, the Reichstag approved two million marks for this task; a trained bricklayer earned 40 marks a week at the time.
Spatial expansion was a major issue, and few were afraid of war.
Magnifying glass, knife, pen, ink: tools for map tracking
Photo: Nils Theurer
In 1903, Erskine Childers wrote "The Riddle of the Sandbank", the first ever spy novel.
It was a cry for help from the author out of desperate political conviction: The book was intended to prevent a raid from the German mudflats.
It later turned out that it was actually planned.
Not as a direct consequence of this, but with the same mindset, around 2,400 maps of the entire world were to be produced within 50 years from 1908 - a task to which all seafaring nations dedicated themselves simultaneously.
And it was by no means a division of labour.
In times of impending crisis, nobody wanted to be dependent on the enemy's maps, which were quickly withdrawn in the event of war.
The engravers - several engraving workshops were now employed - had full order books.
By the First World War, 664 charts had been published; by the end of the Second World War, they totalled 1050.
60 Karto copper engravers were now working exclusively on German nautical charts in various companies.
Coastal
details: Sounding marks as a navigational aid for the navigators, to be
seen on a nautical chart for the Rostock area, published by the
Reichsmarineamt in 1904
From relief to gravure to flat printing However, the increasing print runs and the incredibly fast engraving times presented the printers with a dilemma: the copper plates became flatter with each print, and the indentations were soon flattened by the printing presses.
Only around 50 to 100 sharp prints are usually possible from a copper plate.
Not enough.
As early as 1870, attempts were made to draw the maps directly on the more stable Solnhofen limestone slate, a particularly fine stone from a former limestone sediment that was only available in a Bavarian quarry.
Thus, nautical chart printing conquered new territory.
Flat printing was suddenly the order of the day rather than relief or intaglio printing.
But this process also had its disadvantages: Not only did the nautical chart-sized plates weigh 350 kilograms each, the result was also too flat compared to the prints that people were used to from copperplate engravings.
In addition, correcting the stone plates was only possible with great effort.
And copying onto galvanoplastics did not produce the desired sharpness at the edges either.
The brilliant British nautical charts were always regarded as the measure of all things.
Swedish map, made by Gustav von Klint in 1815, with degree grid and ray lines
Photo: Nils Theurer
Consequently, the plates were engraved in copper again.
If corrections were necessary, the plates were initially knocked flat again from behind.
This was not easy, as the correct position first had to be transferred from the front.
Later, new copper was therefore applied to the front for corrections using galvanic processes.
This was followed by surface grinding and re-piercing.
Despite making the work easier, it was still a mammoth task.
Map of the Curonian Spit, published in "Preussens See-Atlas" in 1841, with first depth information
Photo: Nils Theurer
And there were other problems to overcome: The intaglio printing process with copperplate engraving works best with paper that is highly absorbent.
Nautical charts, on the other hand, should be printed on paper that is as waterproof as possible.
And they should be able to withstand many erasures of the places and courses entered in pencil.
So we were forced to look for compromises.
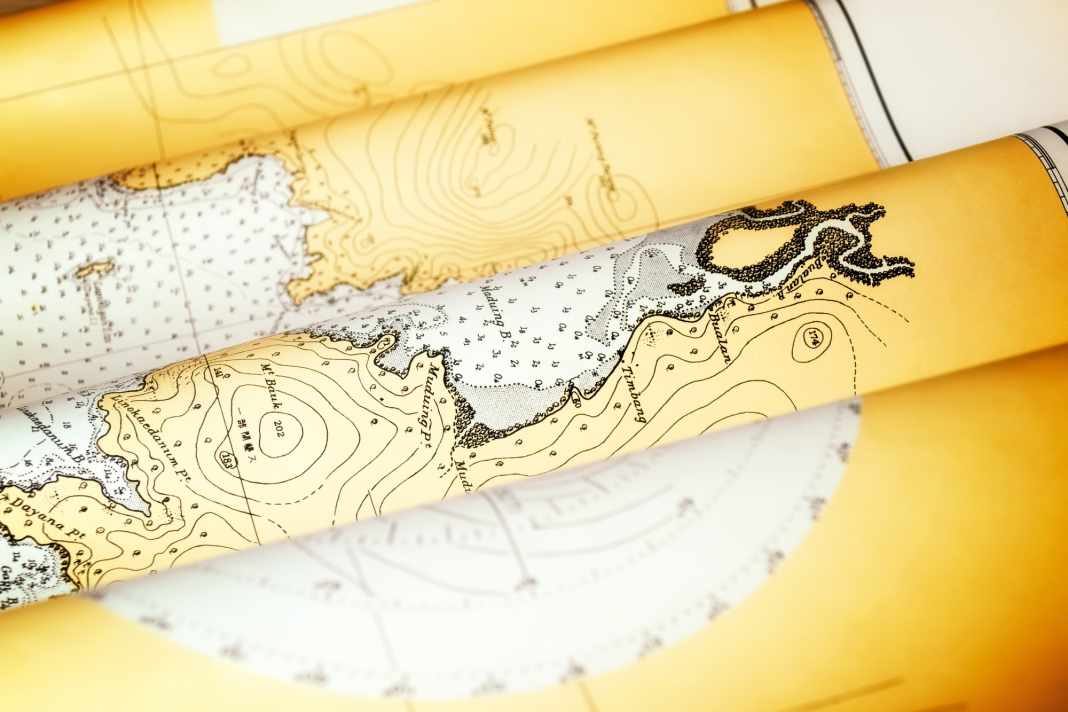
Map of the German Hydrographic Institute from 1915 with numerous depths far off the lagoon coast
Photo: Nils Theurer
After the Second World War, layer engraving became practicable, both at the then German Hydrographic Institute (DHI) and at the GDR's Maritime Hydrographic Service (SHD).
The new process saved a great deal of time and replaced the Karto copper engravers.
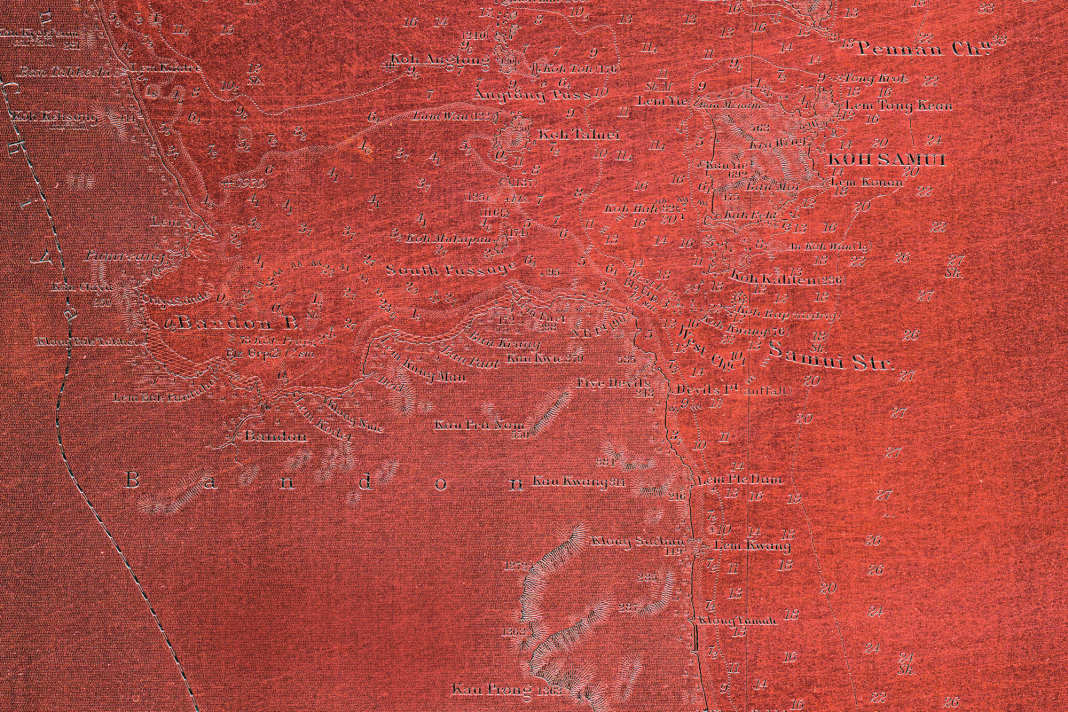
Nautical chart from 1972 in current edition of 2012 with reduced representation of depths and coastline
Photo: Nils Theurer
ENC LT660710 Seaport of Klaipeda (scale 1/80000 ed28 update : 20241115)
From negative to positive Janet Gudusch from BSH takes another look at her "elephants" and "engraving rings" - delicate gravers for sparkling clean lines.
They continue to populate her workplace.
Not just out of nostalgia, they still work perfectly today.
The narrowest ones have a sapphire tip that is sharpened to a hundredth of a millimetre.
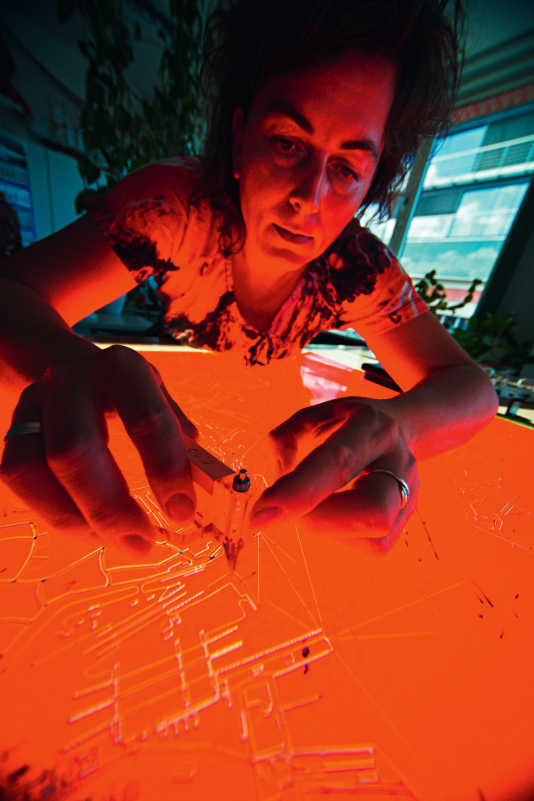
The coating process is reminiscent of scraping finger paint off a window pane, only much smoother.
The technical cartographer uses the engraving tools to carve coasts, roads and bridges into a transparent red coating of dimensionally stable film, creating a negative image.
At the end of a working day, she has removed a thimbleful of coating in the form of extremely fine lines.
A special copying process produces a positive copy of this negative, on which everything that was previously removed appears in rich black.
Tones, depths and lettering are then added to this copy.
This means sticking tiny, self-adhesive films in the right place using a cutter and tweezers.
A separate foil was produced for each of the up to ten colours.
This made printing tedious, as each sheet of card had to run through the same offset printing press ten times and the card had to be set up anew each time.
But ten colours was something you could only dream of in the days of copperplate engraving.
What's more, it was now relatively easy to make corrections with pen and ink on the transparencies.
In addition, technical cartographers were finally able to work in the correct orientation.
The portolan map from 1550 by Batista Agnese shows the western Mediterranean region.
The radial networks and the many place names along the coasts are typical.
Photo: FVM
While even an experienced printer still needed around ten minutes per print from a copper plate, much higher throughputs were now possible.
The printing presses usually ran for a whole day for each special nautical chart colour and were then washed.
Then a day on the next colour, and so on.
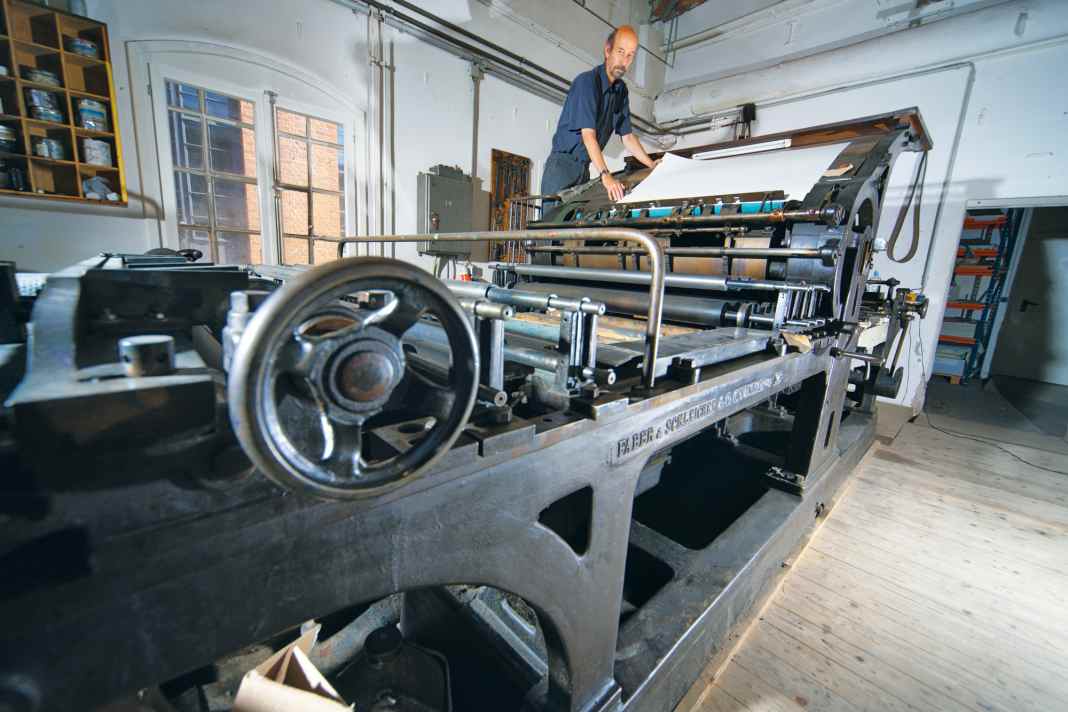
For the last two years, however, production has only been using four-colour offset printing.
The sheets run through the four process colour units cyan, magenta, yellow and black in one go.
The aluminium printing plate, formerly the annual work of a copperplate engraver, is spit out and developed by the digital printer within a few minutes.
It costs 15 euros per colour.
Less is more Sea charts with numerous depths once boasted that the area was well surveyed.
White spots were regarded as uninvestigated.
Today's editorial work, on the other hand, means almost radical omission.
While the individual soundings on sounding routes were still easy to trace on the first maps, with the advent of echographs there was suddenly an oversupply of data that the surveyors delivered to the map editors.
In the case of charts, highly generalised and possibly particularly colourful charts are regarded as beginner's gadgets.
Nautical charts from the current perspective are far more striking and do not aim to depict the bottom in as much detail as a land surveyor's chart; today they offer a far more reduced chart image.
Also in contrast to the national topography, where the contour lines are averaged, the highest elevation must now be found for the depths; the rest is irrelevant and is removed.
The cartographers are increasingly assisted in this by printouts of the enormously extensive series of plumb lines, in which the same depth figures appear in the same colours.
They also receive information from water and shipping authorities, which now collect data at decimetre intervals using multibeam echo sounders.
Out of 100 such data, only the highest elevation at the bottom makes it into the editorial selection, and only a very small proportion of this makes it onto the map.
As a result, the sheets will be clearer and, compared to previous editions, significantly emptier.
The focus should only be on the danger spots.
White spots now mean that the area is deeper than the surrounding depths.
The land behind the coasts is also increasingly reduced to points actually visible from the sea.
Contour lines and shading, which used to be standard, are also no longer to be found.
In 1986, they were still considered a sensation.
In a commemorative publication on the occasion of 125 years of official German hydrography, it can be read: "The high quality and clarity of this shading design were an achievement standard of the German engravers that was only achieved in the German nautical chart series and made the German nautical charts the best of all." The European maritime survey offices now exchange their data so that survey ships no longer work off foreign coasts.
Due to international chart standards, nautical charts of areas outside their own coasts are also becoming less and less useful.
BSH has been reducing its card programme more and more for years.
However, they did not become cheaper.
From 1903 to 1920, 1.2 million cards were sold, 872,553 of them to the Imperial Navy.
By the end of this period, however, 664 cards had also been issued.
This means that less than 100 cards were issued per year - not exactly bestsellers.
But small print runs meant high prices.
However, the original intention was exactly the opposite: "The prices for the nautical charts are kept extremely low in order to enable their use for all German shipping and deep-sea fishing," was written in the "Contributions to German cartography" in 1921.
A map of the North Sea coast from 1767, made by Jan Diedrik Trock, focussing on Heligoland and the Wadden Islands
Photo: FVM
Nothing more than a nice memory Some people may mourn the old, artistic and detailed chart images.
In practice, even the meticulously restored chart table of a hundred-year-old pilot cutter should have an up-to-date sheet.
The labour involved in its creation is hardly noticeable today.
Even in the surveying offices, nostalgia is barely perceptible: apart from historical copies and archived log rolls, there is hardly anything to be found there about the not-so-old copperplate engraving.
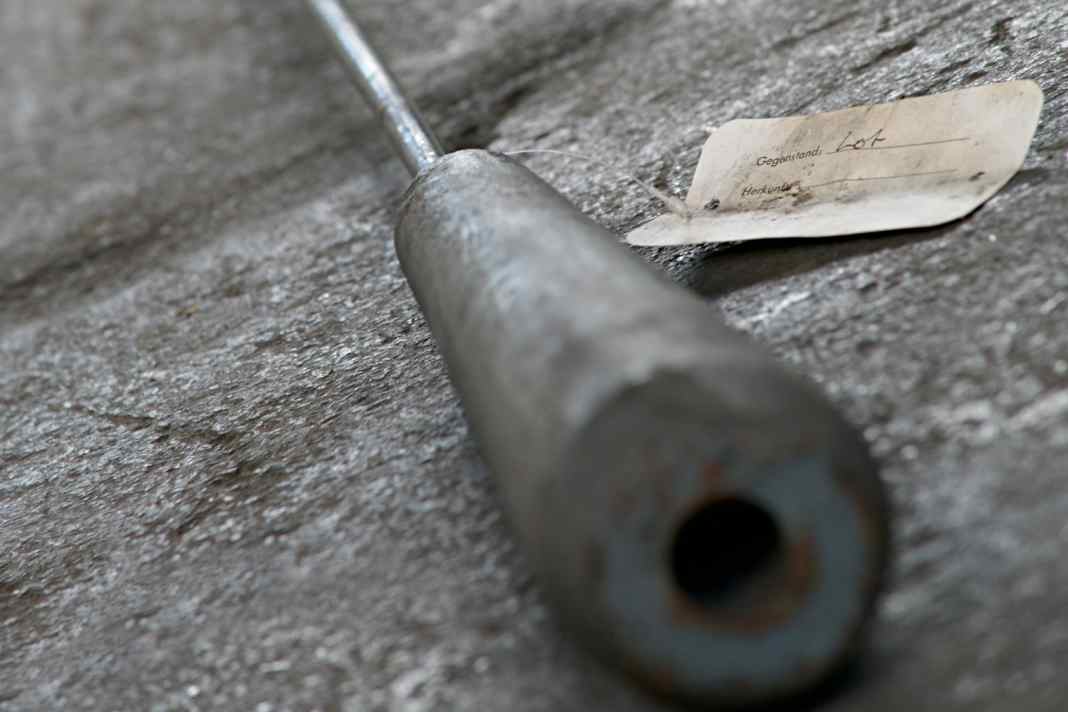
A surveyor from the Hamburg harbour authority says frankly: "Sure, we still have a hand plumb bob on board.
But we've used it maybe once or twice in the last year."
The fine art of cartography: from the beginnings to the present daySea manuals or sailing instructions are older than nautical charts, although they were not distributed on a weekly basis in 400 BC as they are today.
From the end of the 13th century, the development of the compass led to the first nautical charts, called portolans.
They did not yet have a grid of degrees.
Instead, they are characterised by their distinctive ray pattern, which rather theoretically indicates the courses between the harbours.
In the Mediterranean, for example, they impressed with their surprisingly accurate depictions of the coastline.
From around the 16th century, maps with a grid of degrees were created, but it was only the Mercator projection of 1569 that was really suitable for navigation.
At that time, courses from A to B actually appeared correctly on the map as a straight line (see also "500 years of Mercator", YACHT 17/12).
Around the 19th century, land surveying was increasingly regarded as a government task and at the same time became more and more accurate thanks to improved equipment: the 15 kilometre long Gott - hard railway tunnel was pierced in 1880 with a lateral offset of just 33 centimetres and a height difference of five centimetres using triangulation over the Gotthard Pass.
The coastlines and the sea area in front of them were also reflected more and more accurately in the nautical charts.
Beyond the visual range of land, however, it was only astronomical navigation using the sextant, and later the Decca and Loran, that made ever greater accuracy possible - right up to today's differential GPS.


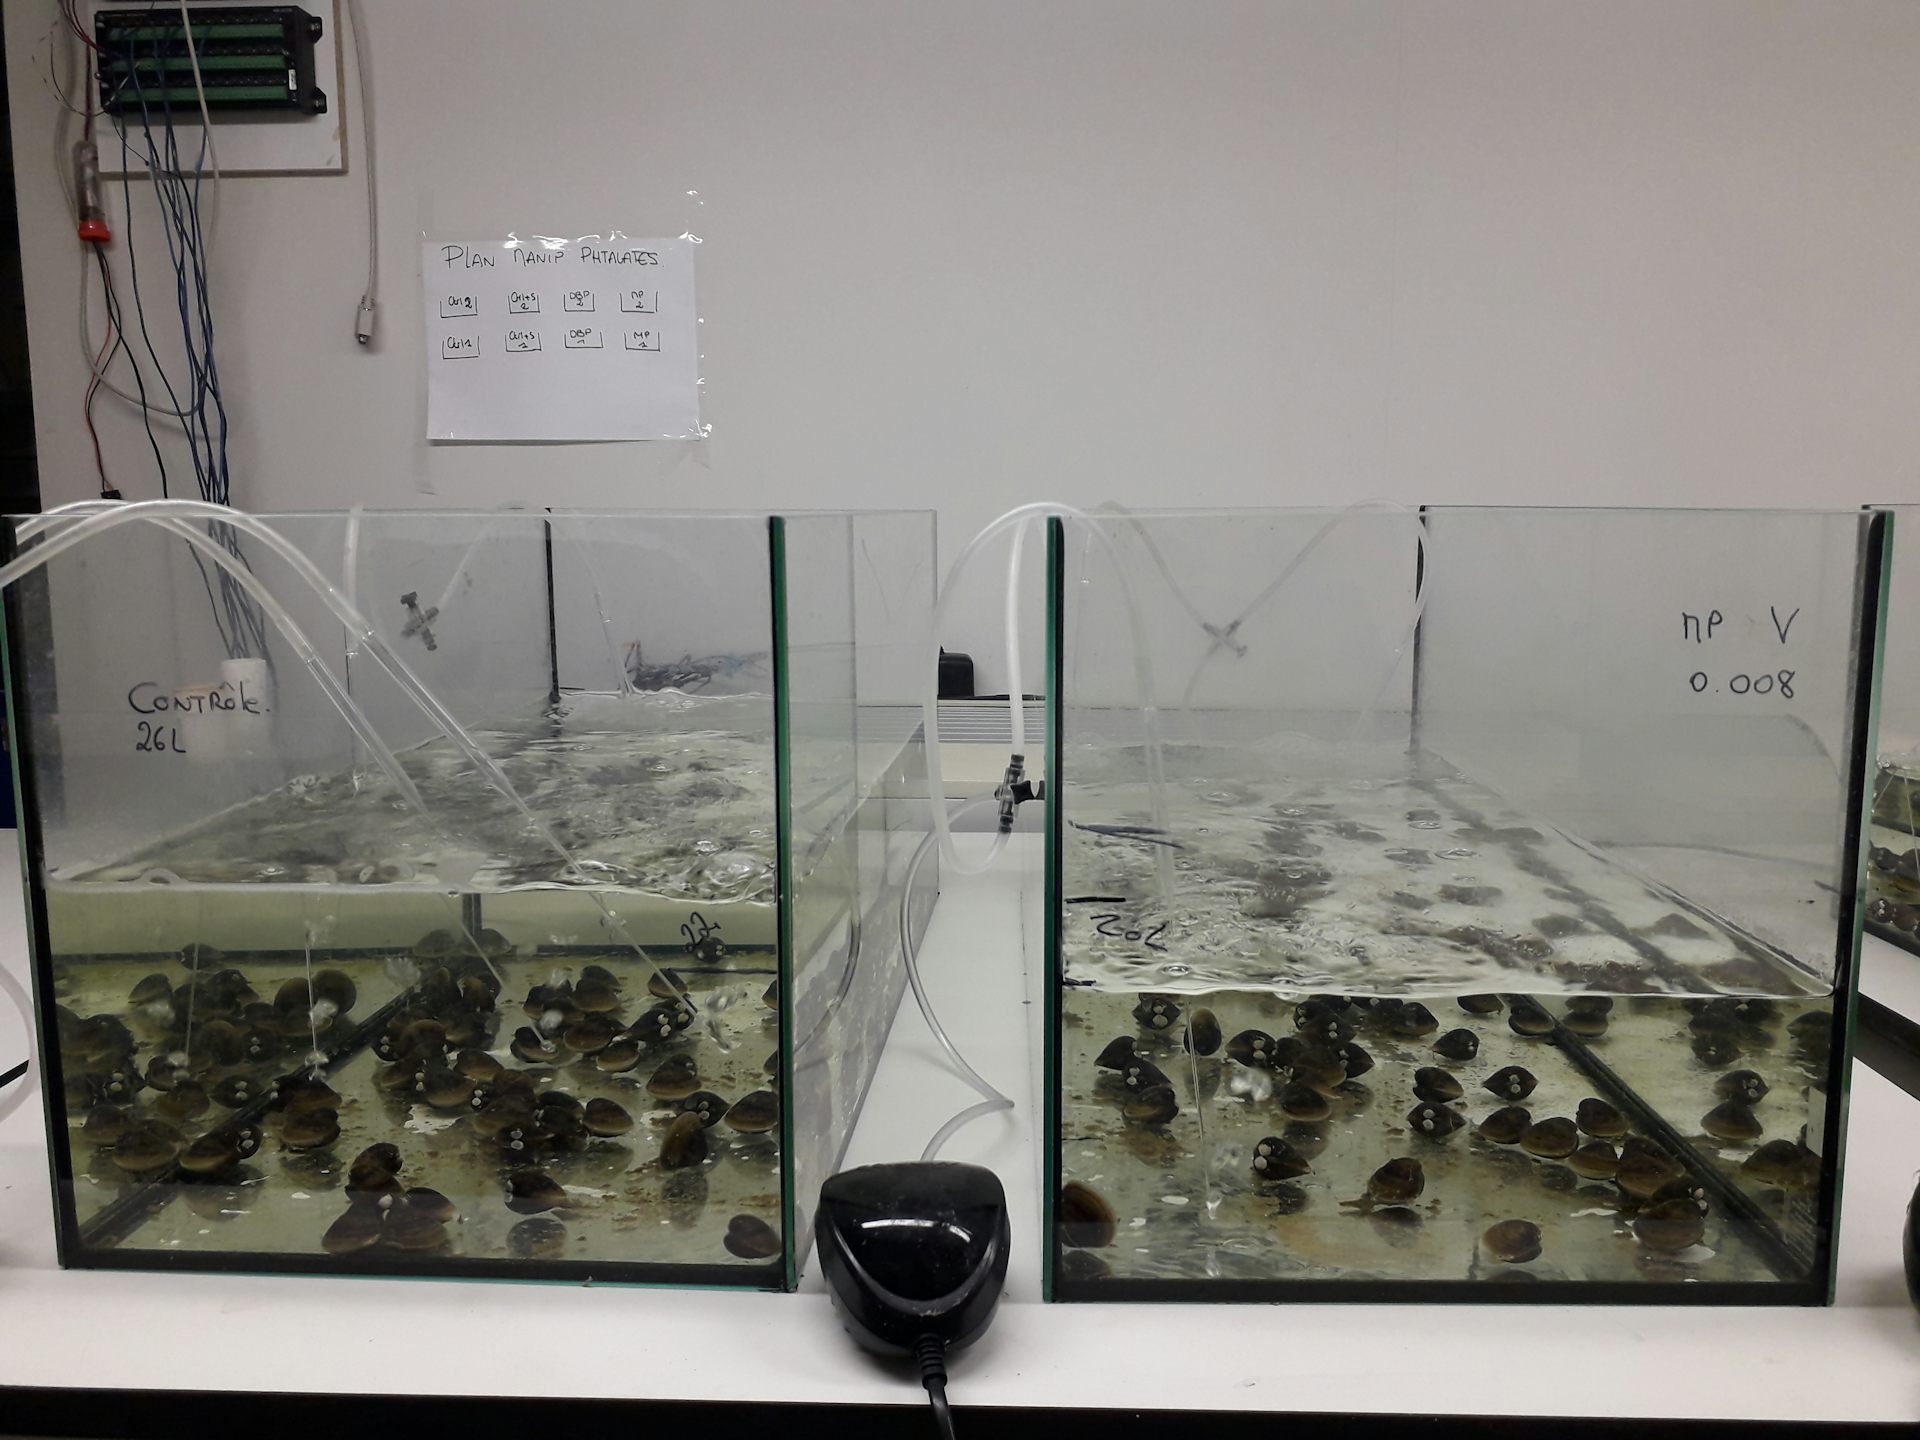
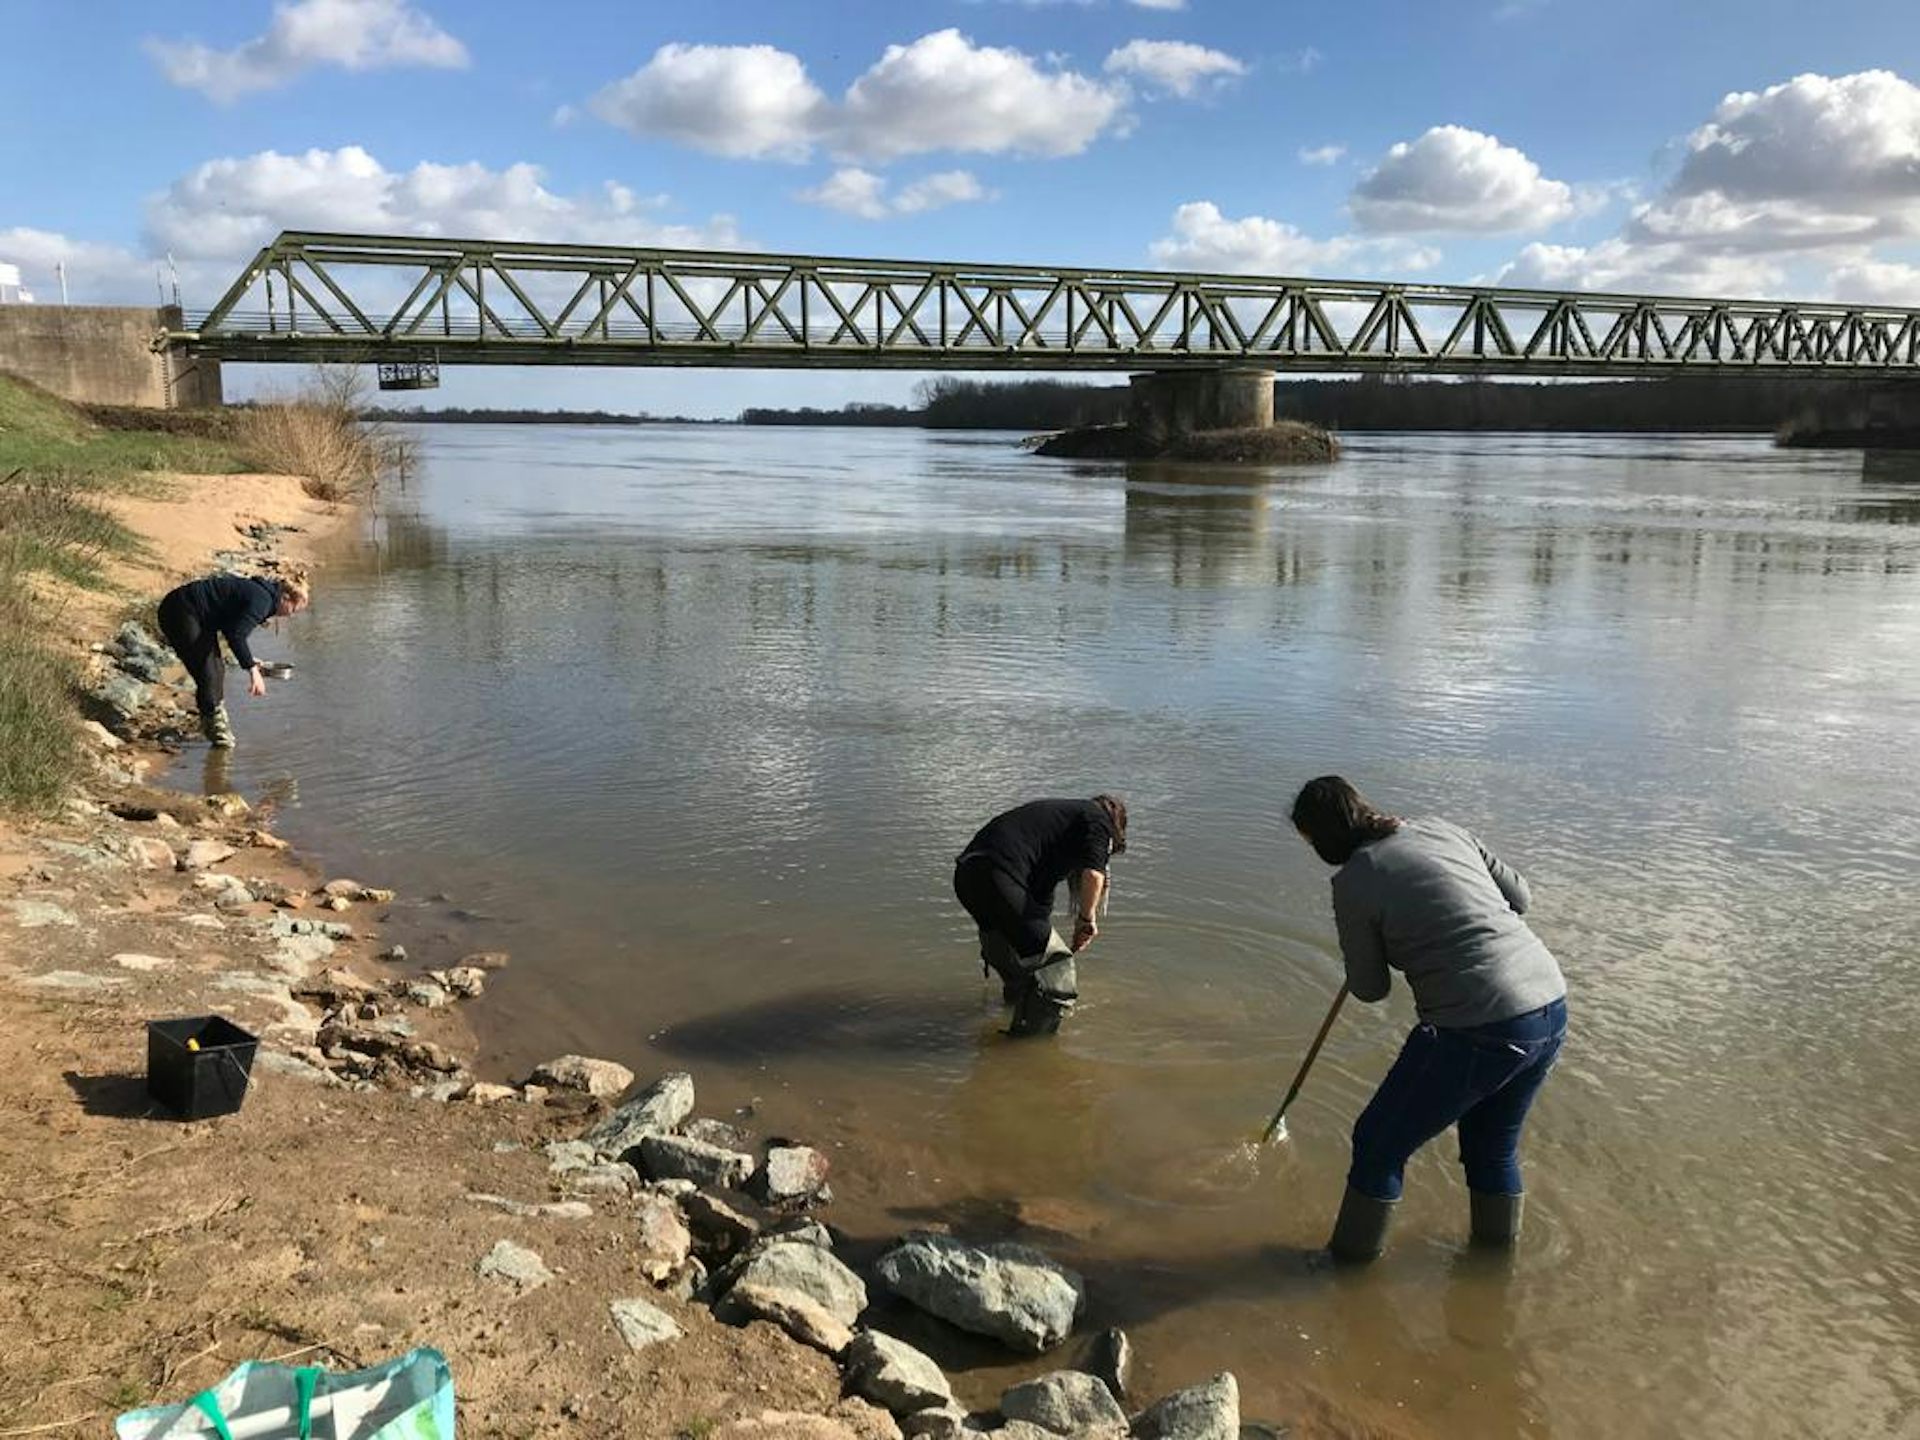 A sampling of the freshwater invertebrates C. fluminea in the Loire river.
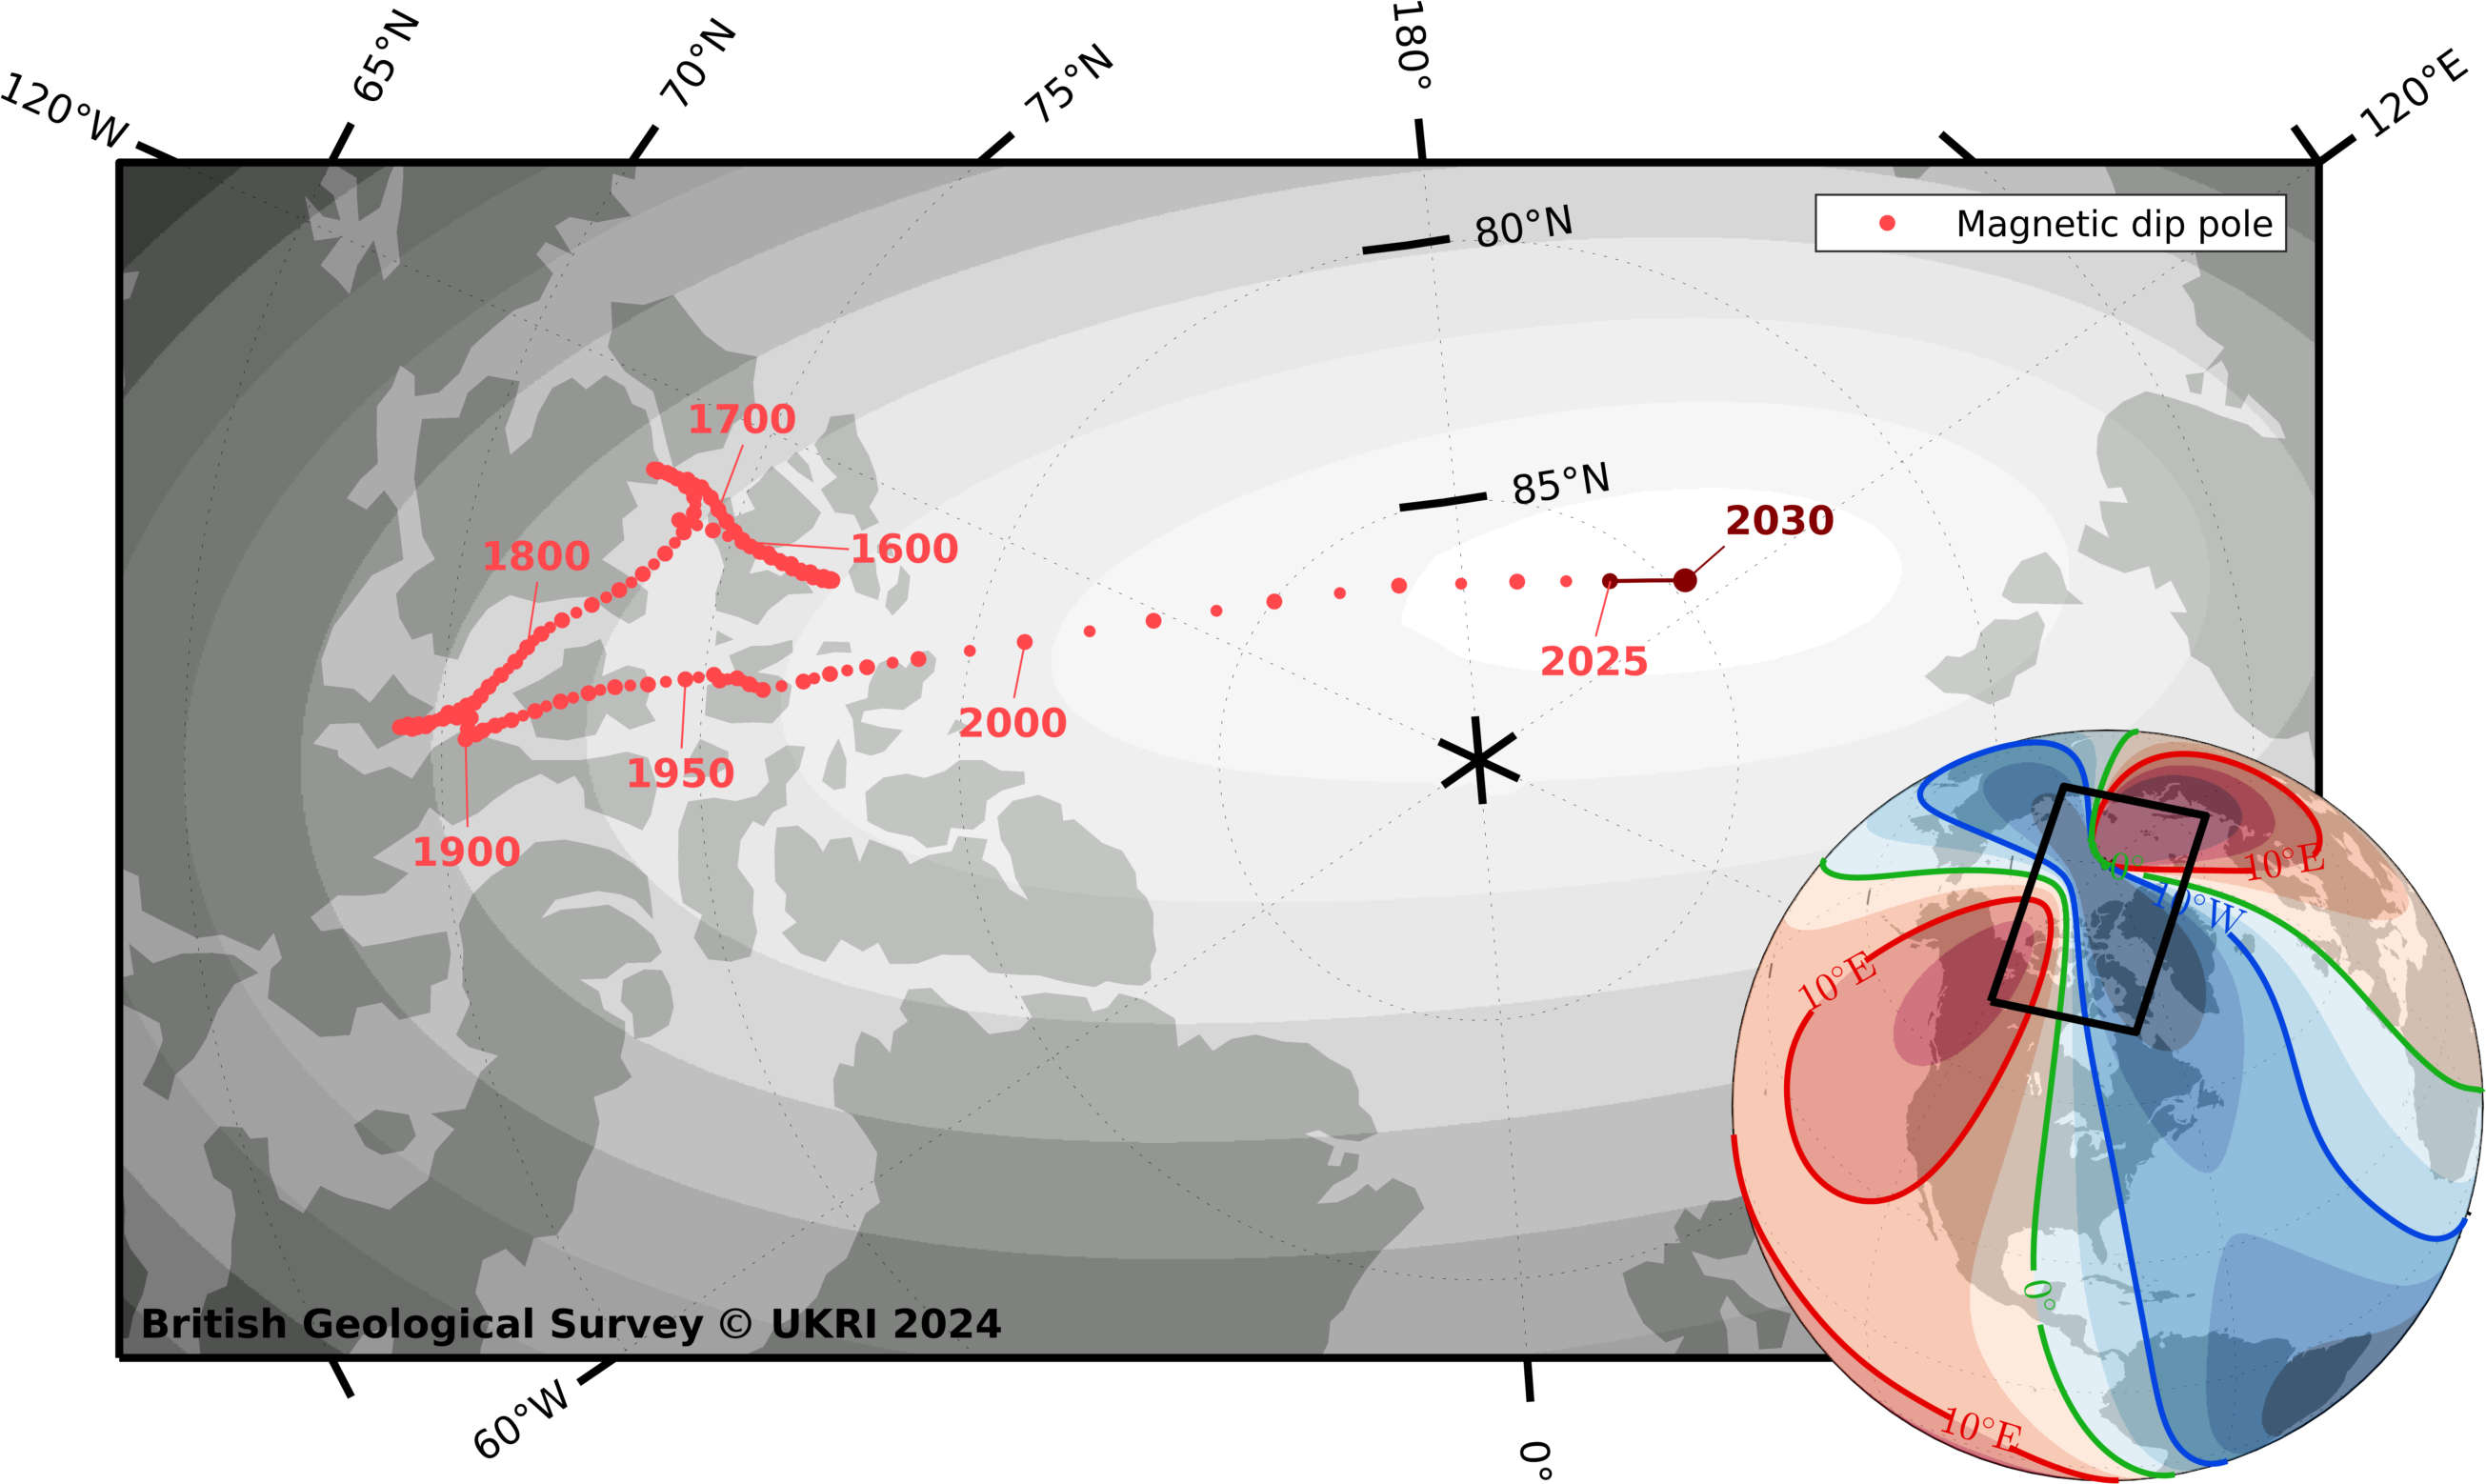
 Magnetic declination (the angle between magnetic and geographic north) in 2025 according to