The map shows Kenya's claim to the Indian Ocean.
Previous rulings have in most cases used a maritime boundary delimitation principle which, in this case, favours Somalia
From DailyNation by Chris Orwa
With the Kenya-Somalia maritime dispute set for hearing at the International Court of Justice (ICJ) at The Hague from September 9 to 13, many citizens of either nation are apprehensive and hopeful that the ruling will go their way.
“What is the most likely outcome of the case?” must be a leading question in many people’s minds.
The two countries are locked up in a diplomatic feud over a triangular piece of the Indian Ocean covering 100, 000 square kilometres.
Such face-offs and their resolutions date back centuries.
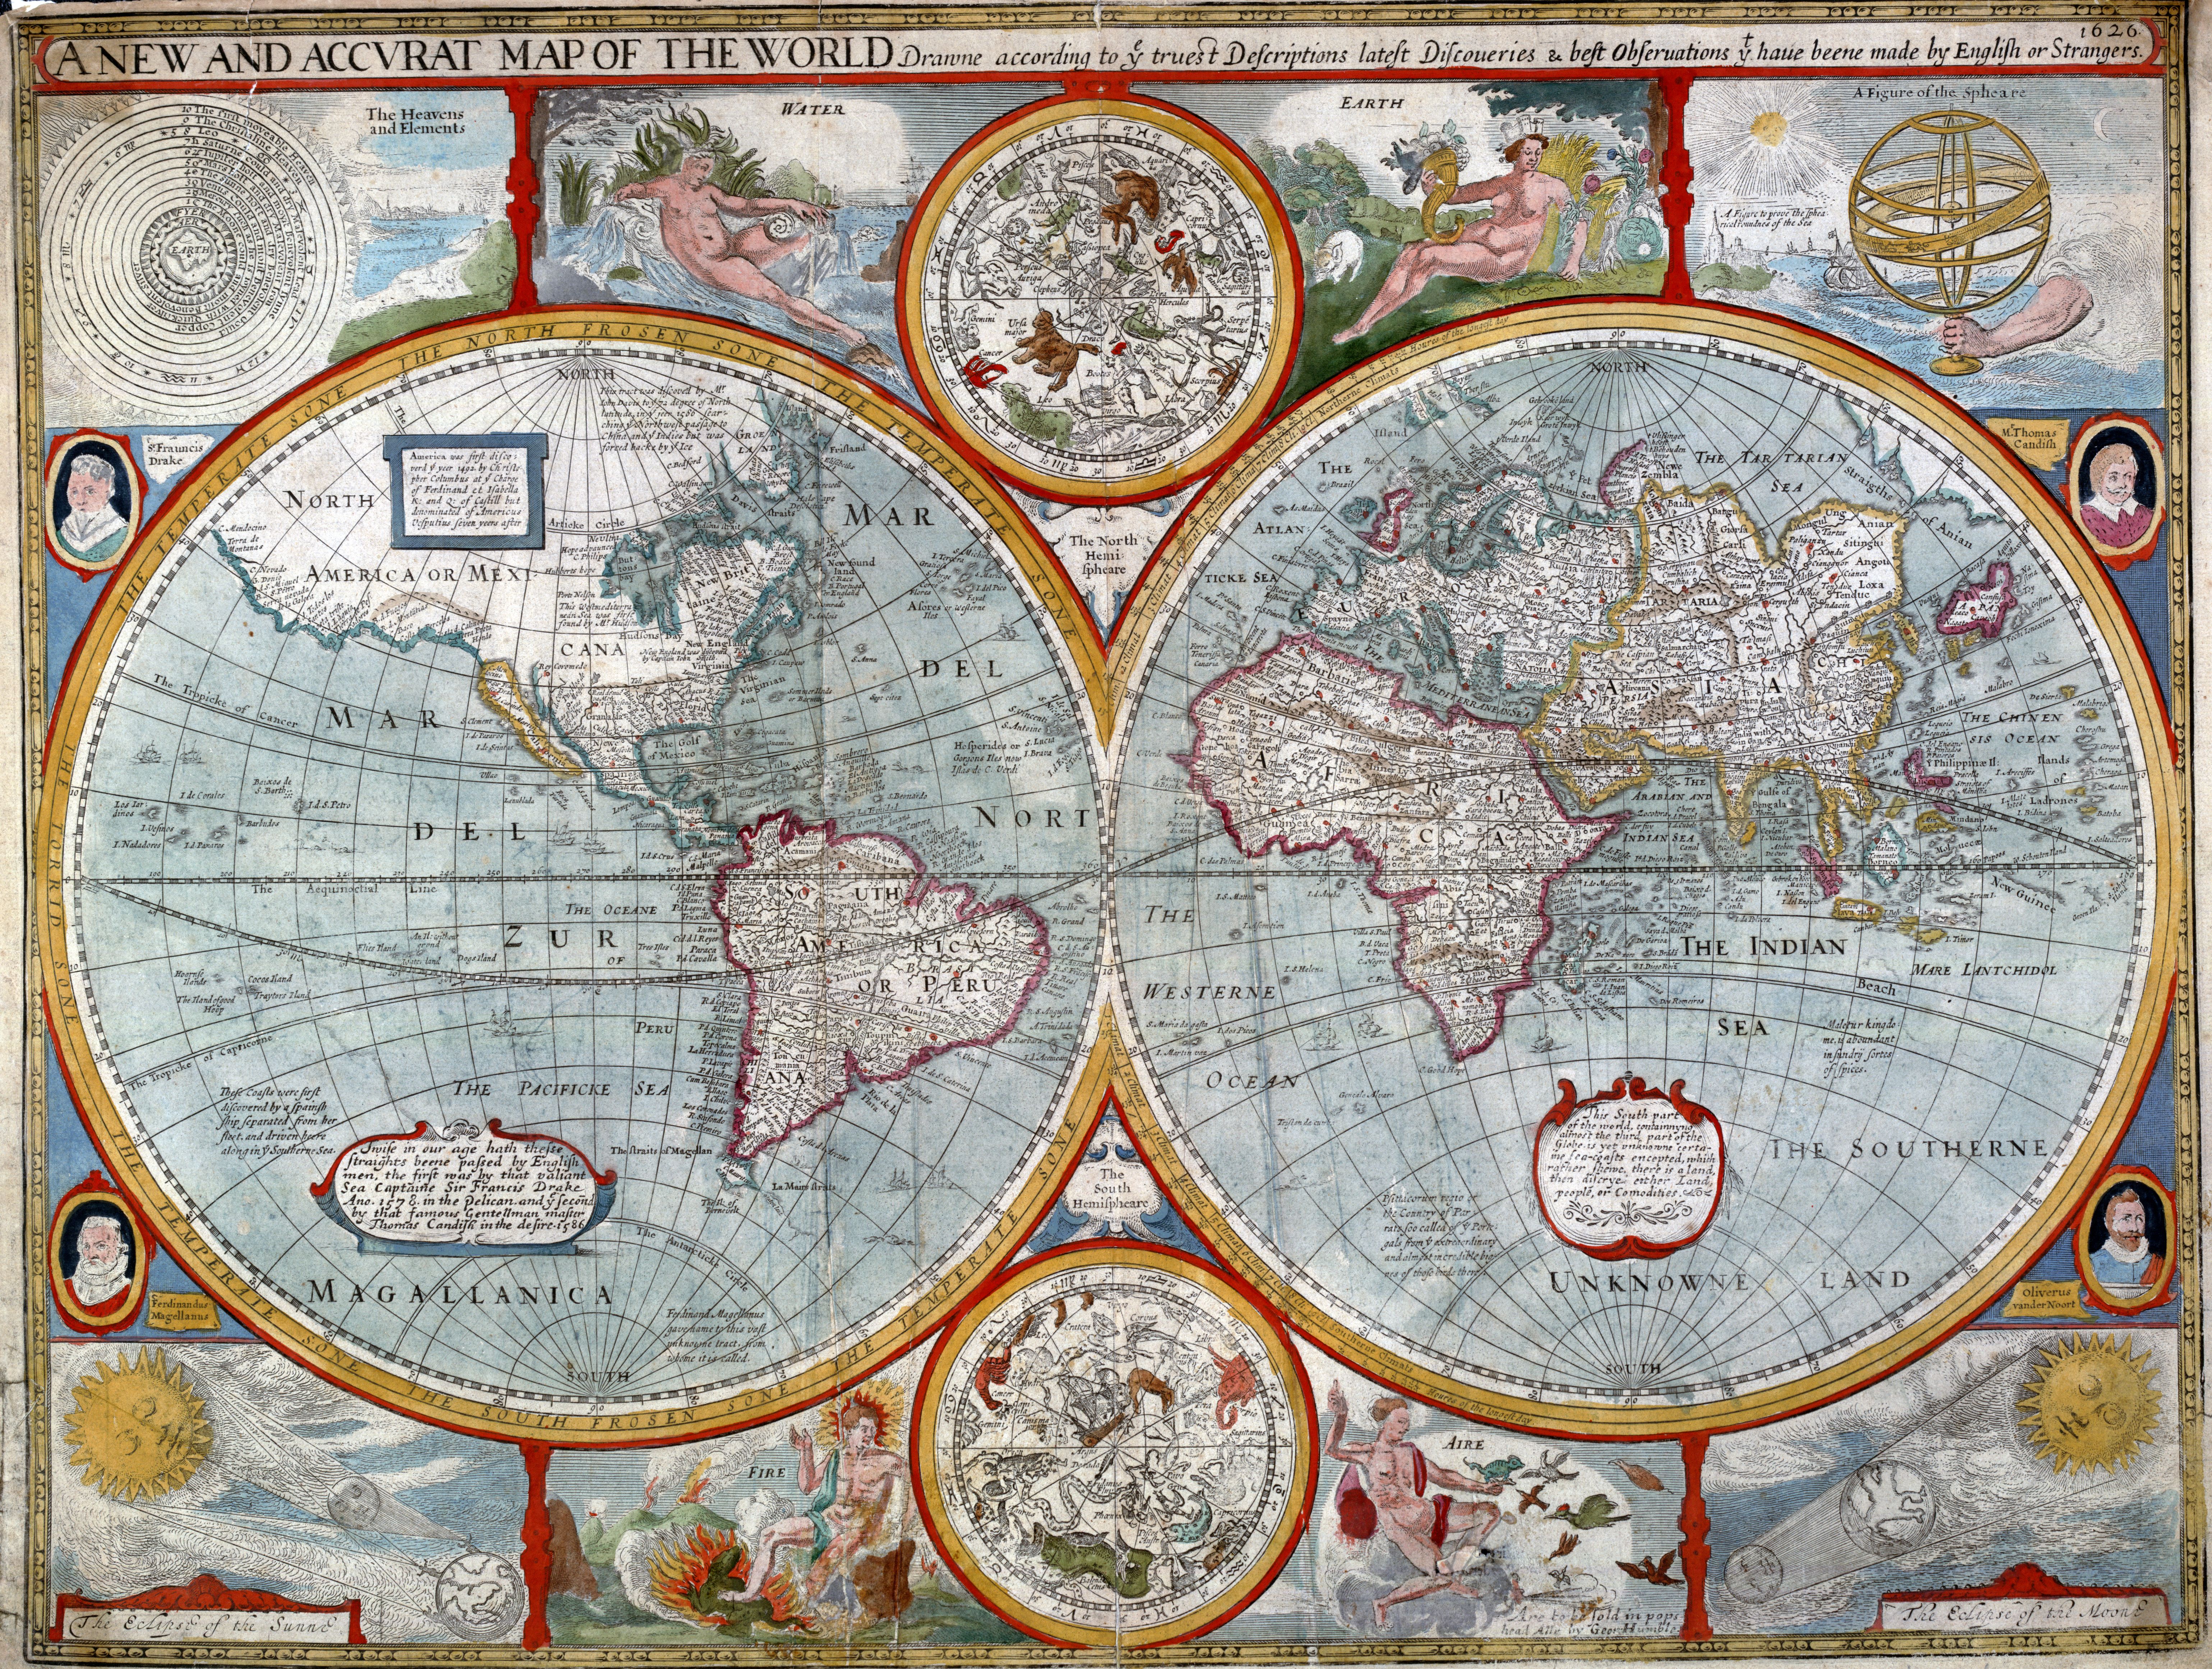
On July 7, 1494, Spain and Portugal signed the Treaty of Tordesillas to end the conflict over newly discovered lands.
The treaty defined a straight line of demarcation from pole to pole measured at 515 kilometres from Cape Verde island going through Brasil and separating the two hemispheres of the world.
Areas to the East would belong to Portugal and to the West to Spain.
As the two forefront maritime powers of the 15th century, they created one of the first ocean boundaries for purposes of resource exploitation.
In the 21st century, newly formed coastal countries seek to exploit the riches of the sea, and this desire has resulted in 180 resolved disputes and 400 potential disputes, according to Chatham House, an independent think tank on international affairs.
EEZ disputed area (triangle) between Kenya and Somalia with the GeoGarage platform
A line of contention
In the case before ICJ, Somalia argues that the maritime boundary should be an extension of the land border running south-east into the ocean while Kenya favours the parallel line to the latitude from its territorial border with Somalia.
The two interpretations of the maritime boundary created a triangular area of approximately 100,000 square kilometres, which is currently in dispute.
In the days of yore, galleons and battleships settled maritime boundary feuds but today the UN Convention on the Law of the Sea defines the rights and responsibilities of nations concerning the use of world's oceans.
Somalia has therefore registered their predicament at the ICJ for arbitration on the boundary matter.
Somalia, submitted to the United Nations its claim to marine areas.
In 1972.
Although Somalia ratified the UN's Laws of the Sea, the documentation did not explicitly define the boundaries hence leaving it to both equidistance and equitable interpretation.
Subsequent legislation and proclamations omitted the delimitation points of the maritime border.
Then on June 30, 2014, a Presidential decree from the Federal Republic of Somalia defined the coordinates of its Exclusive Economic Zone (EEZ), which crossed into Kenya's claimed zone.
Kenya, on the other hand, submitted to the United Nations its maritime border in February 28, 1979.
The Presidential proclamation reads, “In respect of the boundary of its northern territorial waters with the Somali Republic be on Eastern latitude South of Diua Damasciaca Island being latitude 1° 38' South."
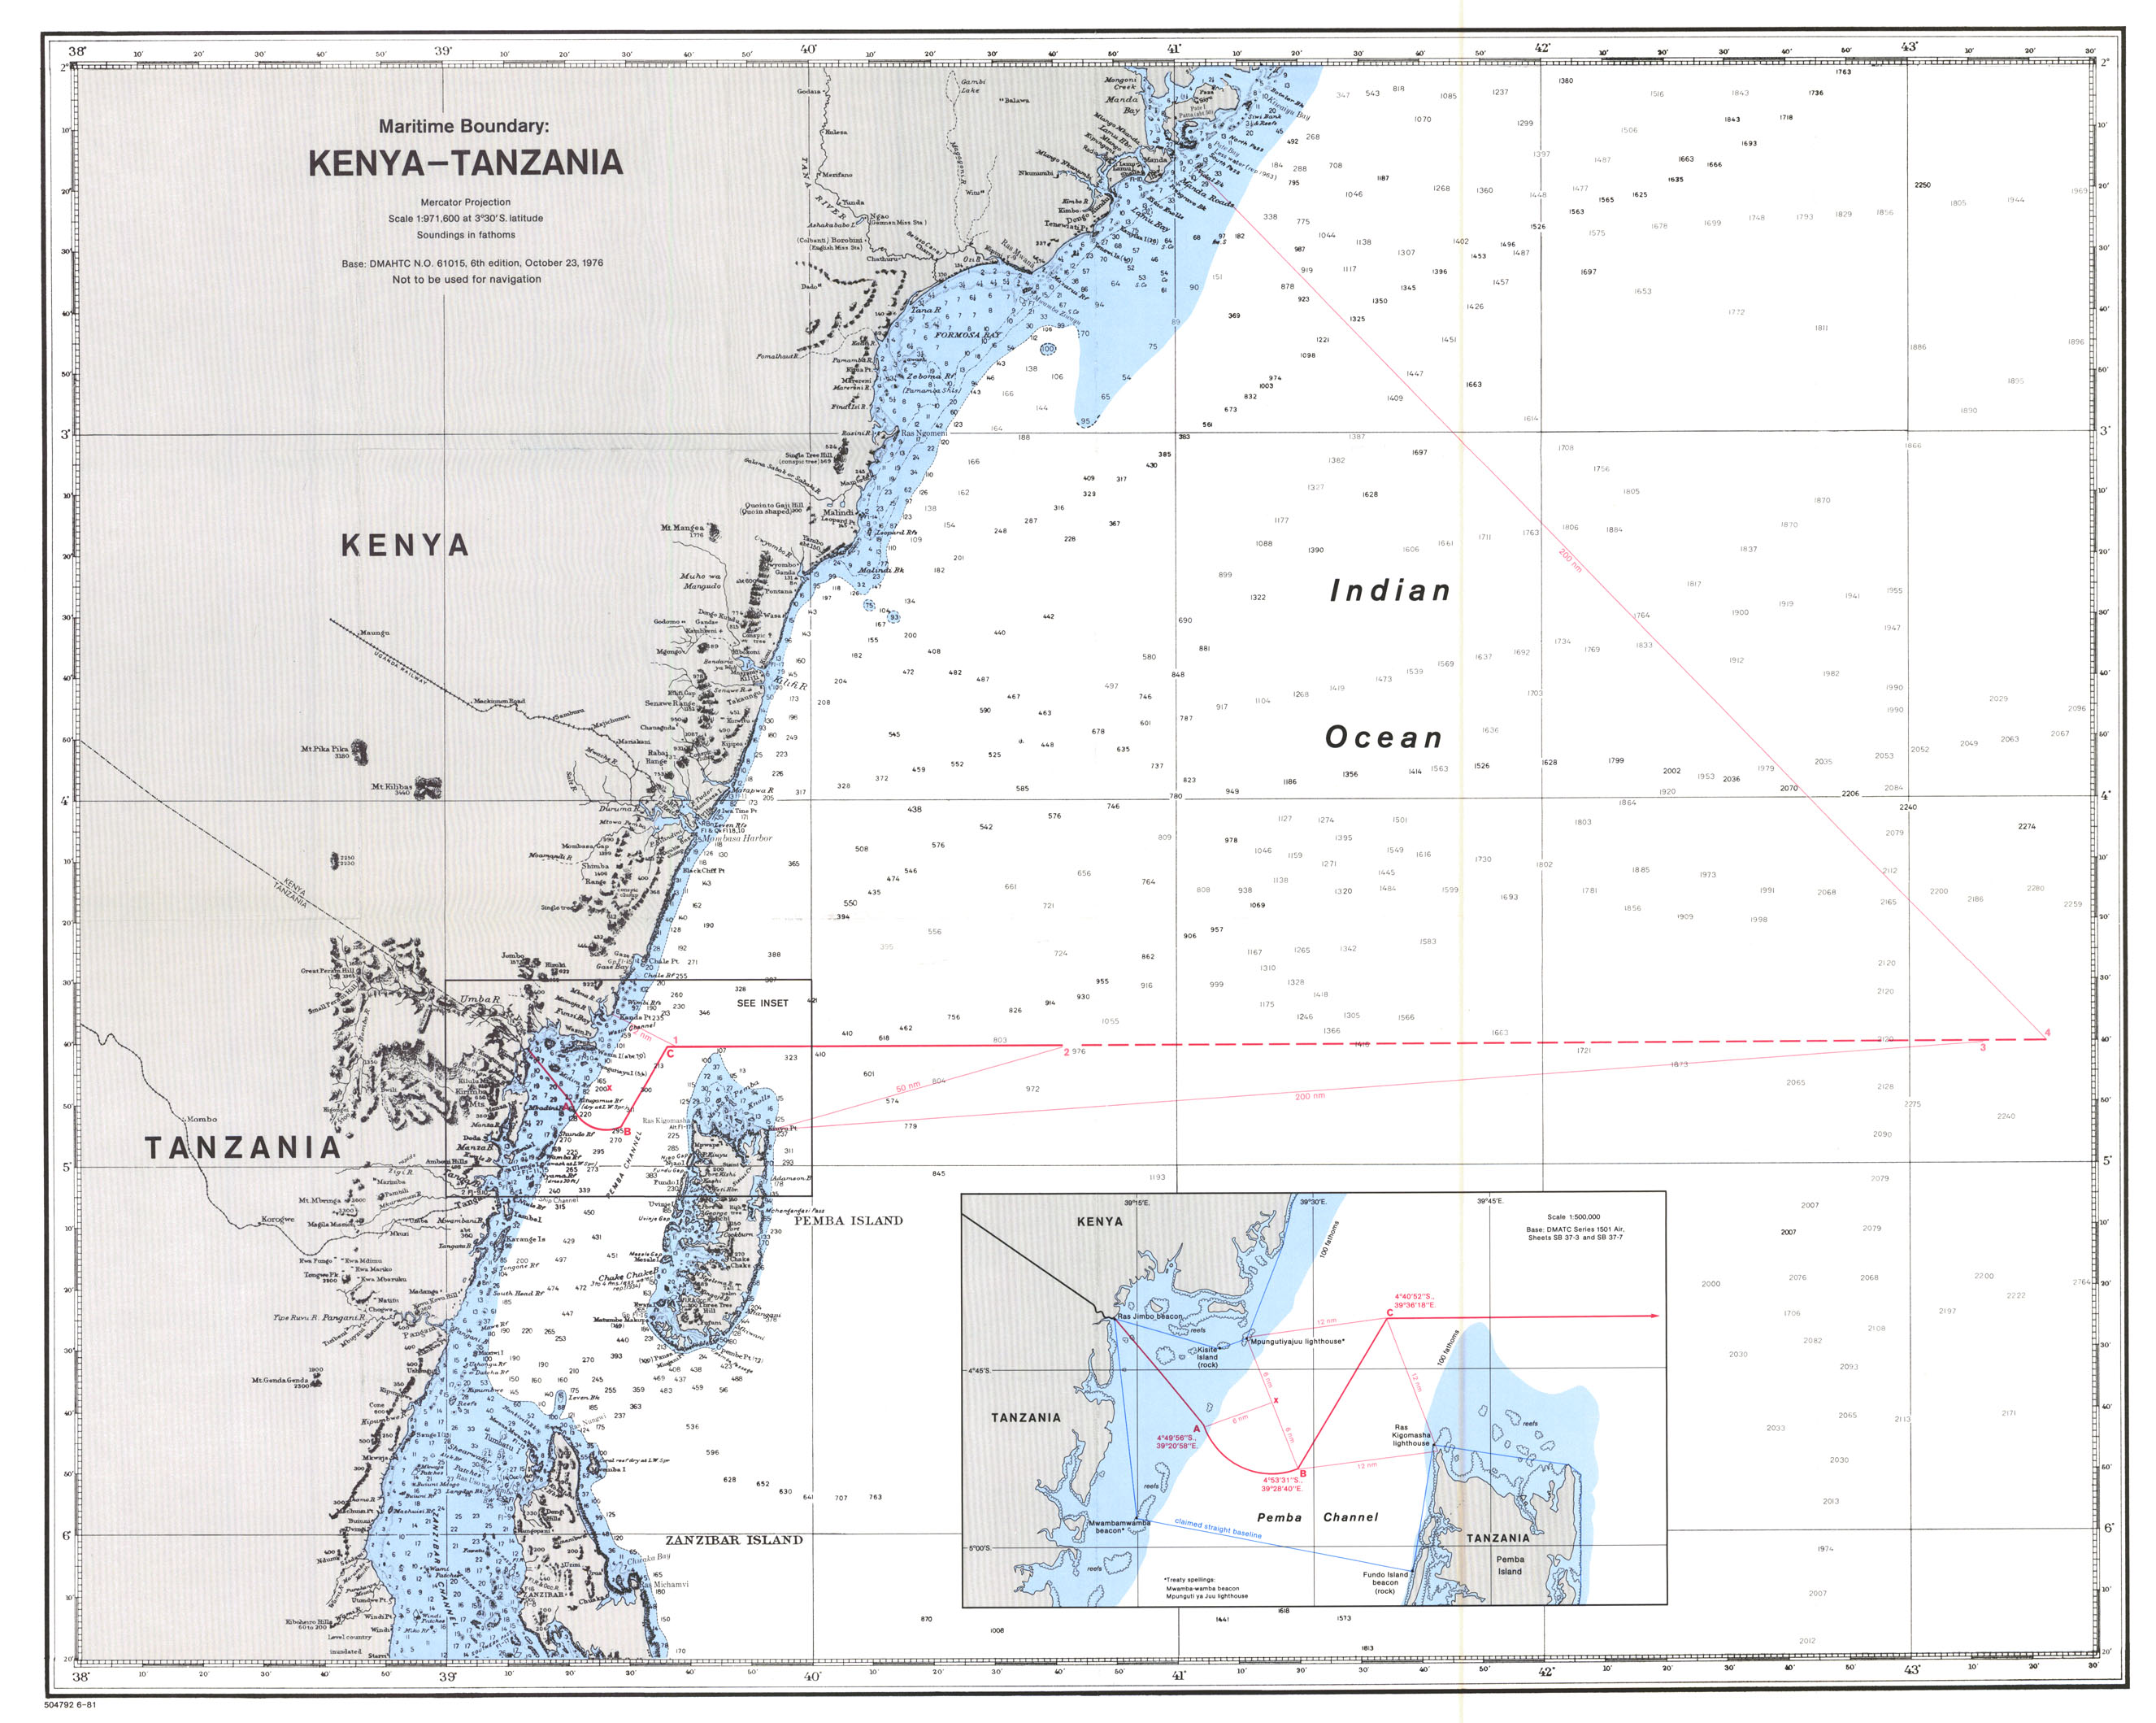
The Southern border with Tanzania follows a similar parallel line to the latitude.
The proclamation reads, “In respect of the boundary of its southern territorial waters with the United Republic of Tanzania be an Eastern latitude north of Pemba island to start at a point obtained by the northern intersection of two arcs, one from the Kenya Lighthouse at Mpunguti ya Juu, and the other from Pemba island Lighthouse at Ras Kigomasha."
Of the 3,300 kilometres Somalia coastline, it is the Juba-Lamu Basin which extends southwards into Kenya that has the thickest source rocks making it the area with the highest potential for oil, hence the high interest by both countries.
Oil map
Who is right?
To ascertain which country has the rightful claim to the disputed area, we look into the laws upon which their claim rests.
In the determination of maritime boundaries, states rely on two international law enactments - the equidistance and equitable principles.
The equidistance principle defines boundaries as the midpoint between two states.
In 1973 during the United Nations Convention on the Law of the Sea, Kenya and seven other countries rejected the equidistance approach in favour of the equitable principle, which seeks to achieve fairness in situations where the strict rule of law would be too severe or unkind.
With a relatively smaller coastline, it is obvious why Kenya prefers the fairness principle.
Somalia on the other hand has the second longest coastline in Africa of 3,300 kilometers, after Madagascar’s 4,828 kilometers.
Which country is likely to win the case? We turn to data.
A collection of disputes
There have been 587 maritime boundary cases in which 272 were resolved, 213 not determined and 102 are pending, according to data from Issues Correlates of War (ICOW) between 1900 and 2001, a research project that collects data on contentious issues in world politics.
The dataset contains maritime cases and their resolutions from the Western Hemisphere and Europe in the 100 years, covering 87 distinct maritime zones.
The chart below shows resolution of cases per decade for the last century.
Chart showing maritime dispute cases per decade for the last century.
Bilateral discussion constitutes the most prominent method of resolving maritime boundary matters.
However, Kenya's bilateral talks with Somalia did not yield any agreements, hence the case proceeded to the second-most utilised means of marine boundary resolution - third party, through a court of arbitration, as was done on the Cameroun-Nigeria maritime and land dispute.
In the decade between 2000 and 2010, all maritime disputes were resolved through bilateral talks.
On average it takes six years to resolve a maritime dispute, Kenya’s disagreement with Somalia officially started in 2014, making it five years old now.
The balance of reason
Previous rulings have all given priority and prominence to the use of equidistance means of delimiting maritime boundaries.
Example, on March 29, 1994, Cameroon took its dispute with Nigeria concerning the question of sovereignty over the Bakassi Peninsula, and requesting the Court to determine the course of the maritime frontier between the two States.
In its judgment of October 10, 2002, the Court determined that sovereignty over the Bakassi Peninsula lay with Cameroon by using the equidistance principle.
The ruling involved first drawing a median line, then considering whether factors are calling for the adjustment or shifting of that line to achieve an "equitable result".
However, concerning equity, the Court noted that on disputes relating to maritime delimitation, equity is not a method of demarcation, but solely something to have in mind while effecting the delimitation.
Cameroon had tried to also have the Gulf of Guinea by invoking the disparity between the length of its coastline and that of Nigeria in the Gulf of Guinea as a relevant circumstance that justifies shifting the delimitation line towards the north-west but the Court noted coastline disparity as applicable but ruled that it would not be a reason to change the equidistance line in favour of Cameroon.
The land boundary between Kenya and Somalia terminates on a smooth coastline.
Its equidistance line reaches the interaction of the EEZ near 3°30´ south and 44°19´ East.
Because the continental coastline in this sector is aligned southwest-northeast, the equidistance line follows a southeasterly course, more or less an extension of the land borderline, which is consistent with Somalia’s demand.
Kenya will be the loser in this likely scenario.
Considering that Kenya and Tanzania maritime boundary stands north of Pemba Island by a parallel of latitude, an equidistance line between Kenya and Somalia would mean that Kenya’s EEZ would narrow as it proceeds seawards.
This is further disadvantages Kenya.
A Solomonic ruling would provide a joint exploration of the area while placing the sovereignty to Somalia.
In a bygone era, both countries would then proceed to throw a feast to Terminus - the Roman God of boundaries and boundary markers.
For he was praised "you set bounds to peoples, cities, great kingdoms: Without you, every field would be disputed".
Links :

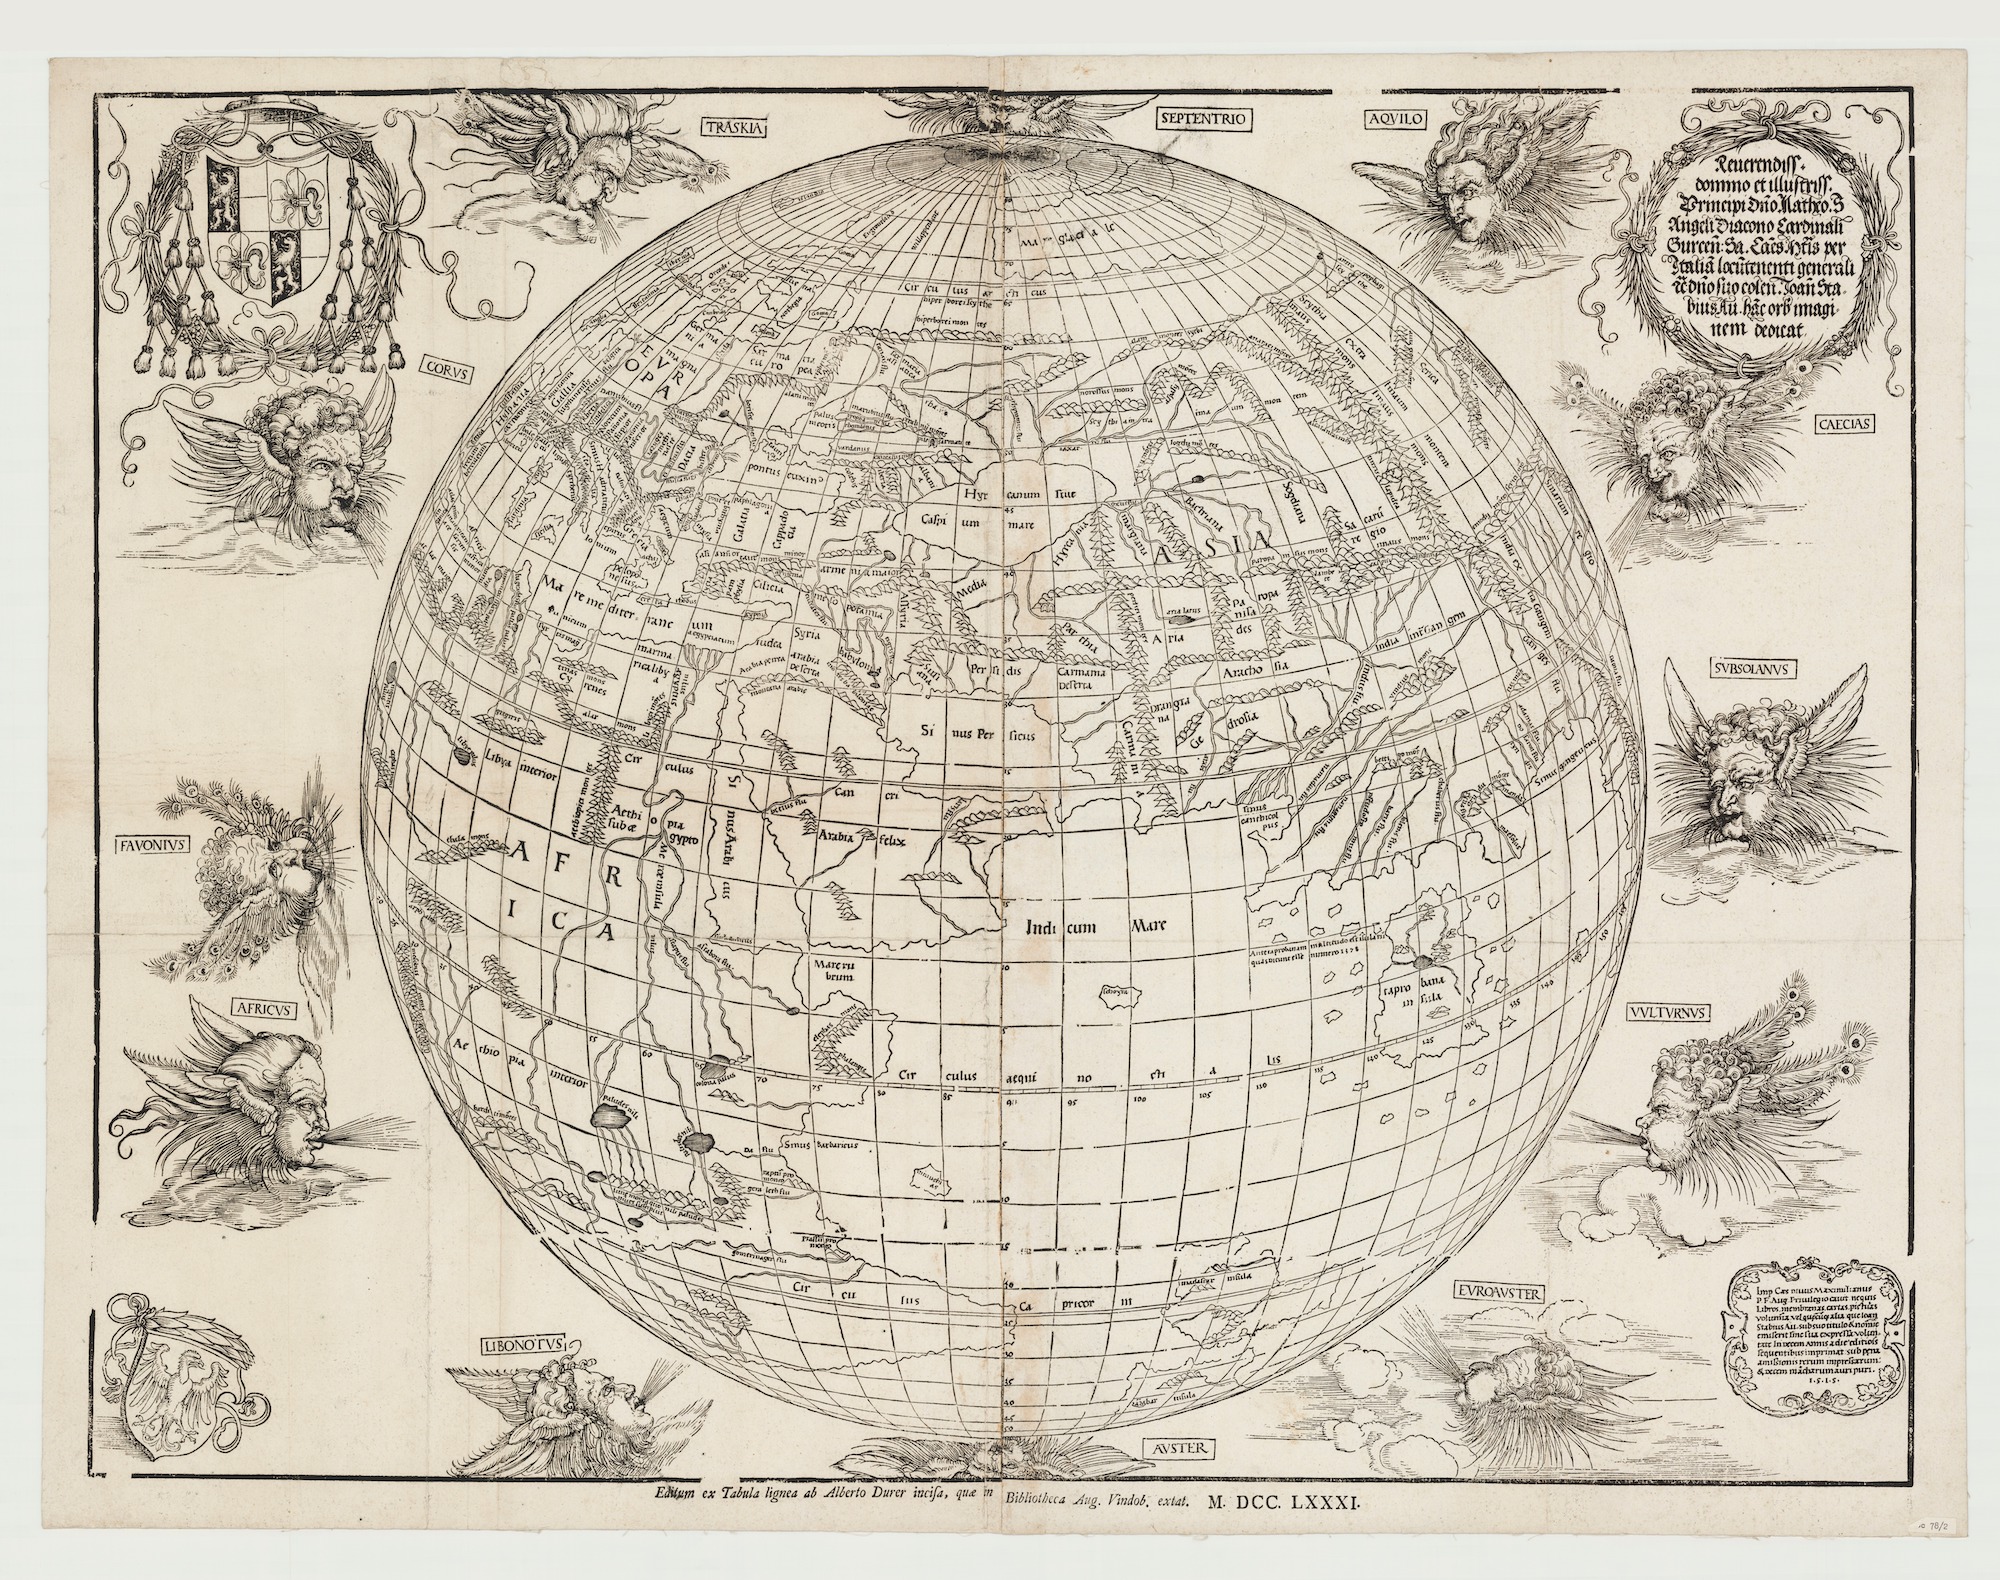 The first printed map to show the world as a sphere from 1515

 Fernando Bertelli’s version of Paolo Forlani’s World Map, after Giacomo Gastaldi: Universale Descrittione Tutta La Terra Conosciuta Fin Qui (Venice, 1565).


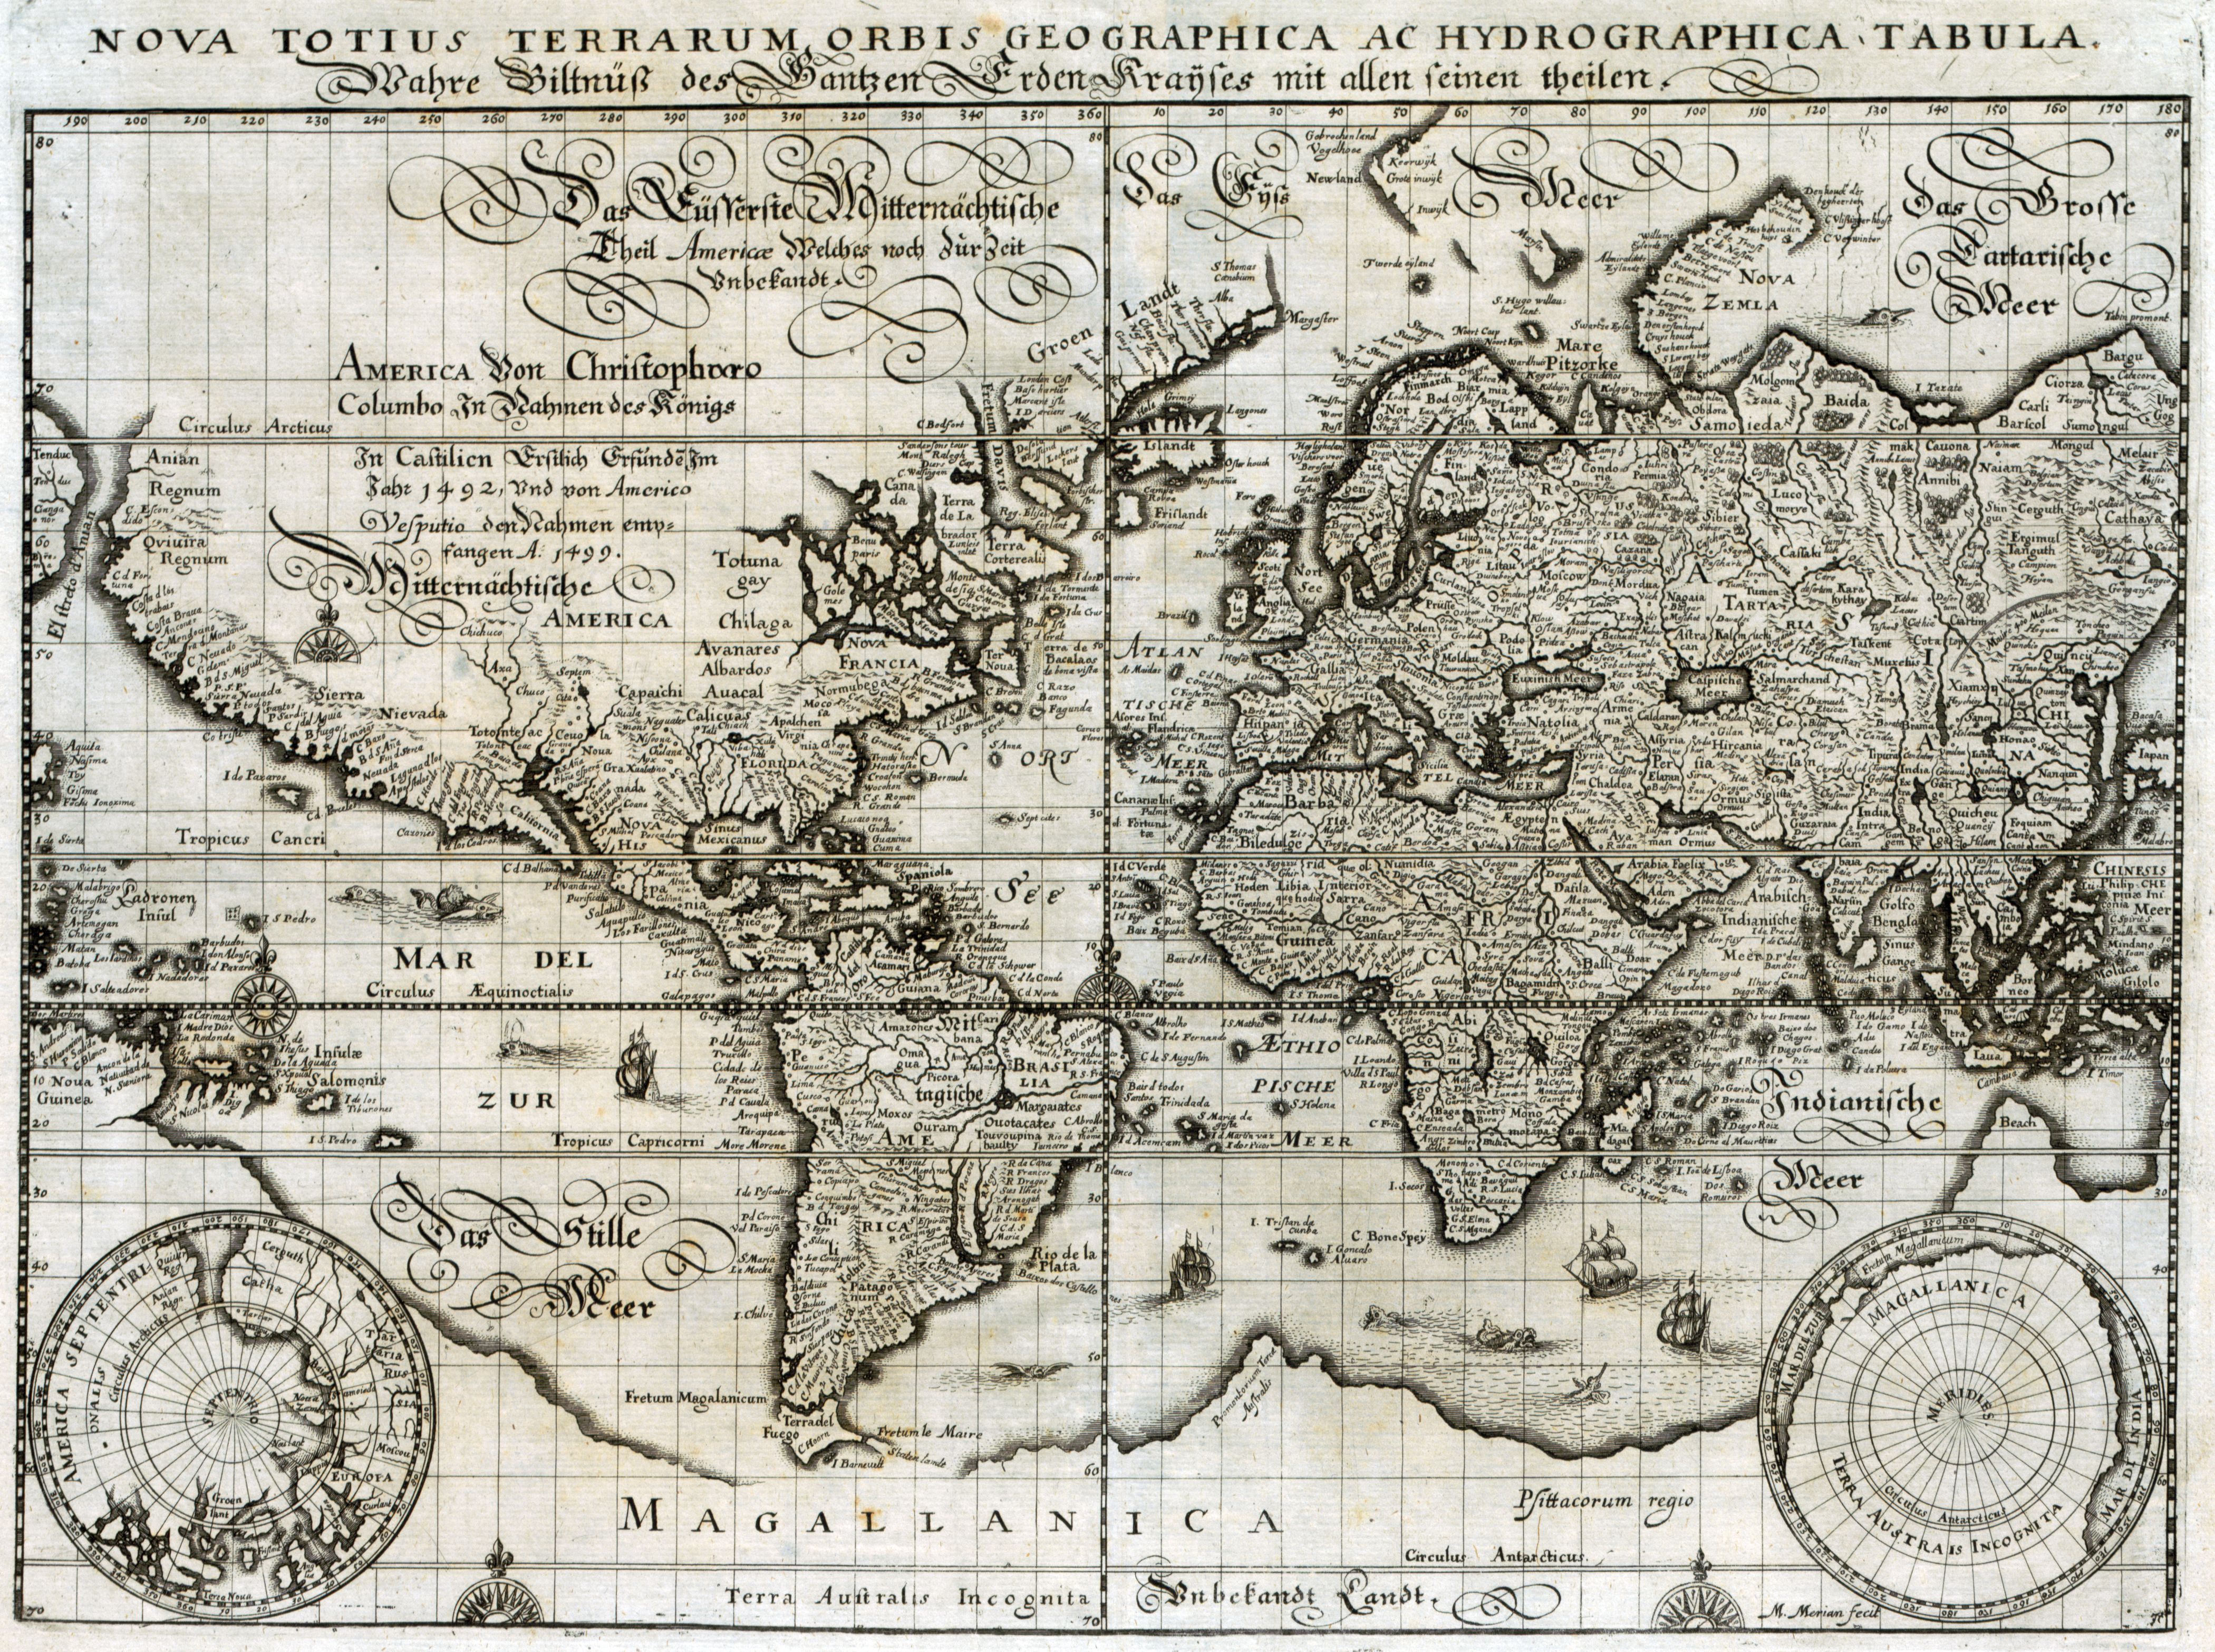


 A view of the world as known in 1681
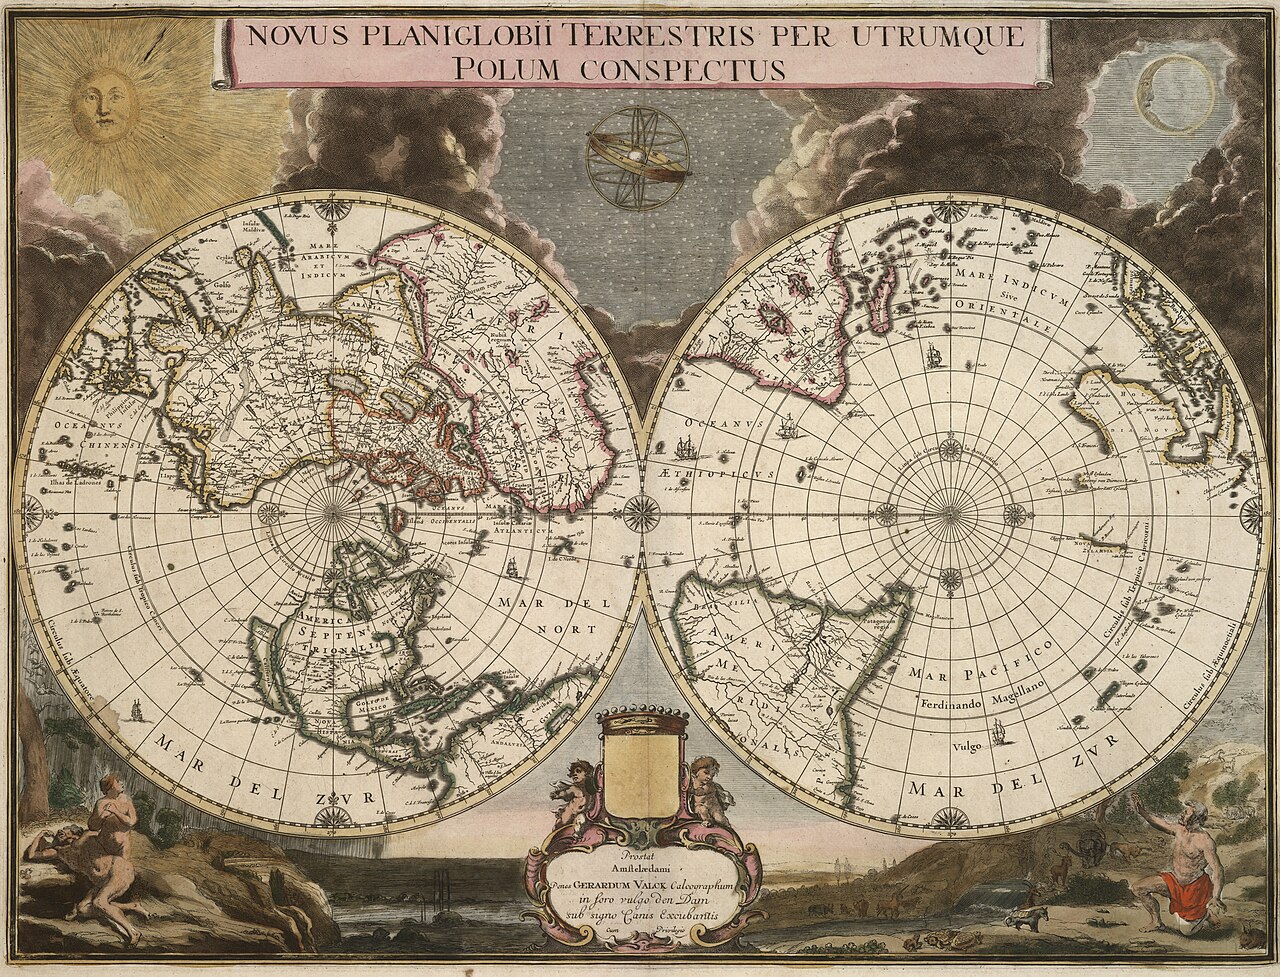
 Andreas van Lugtenburg (1708)


