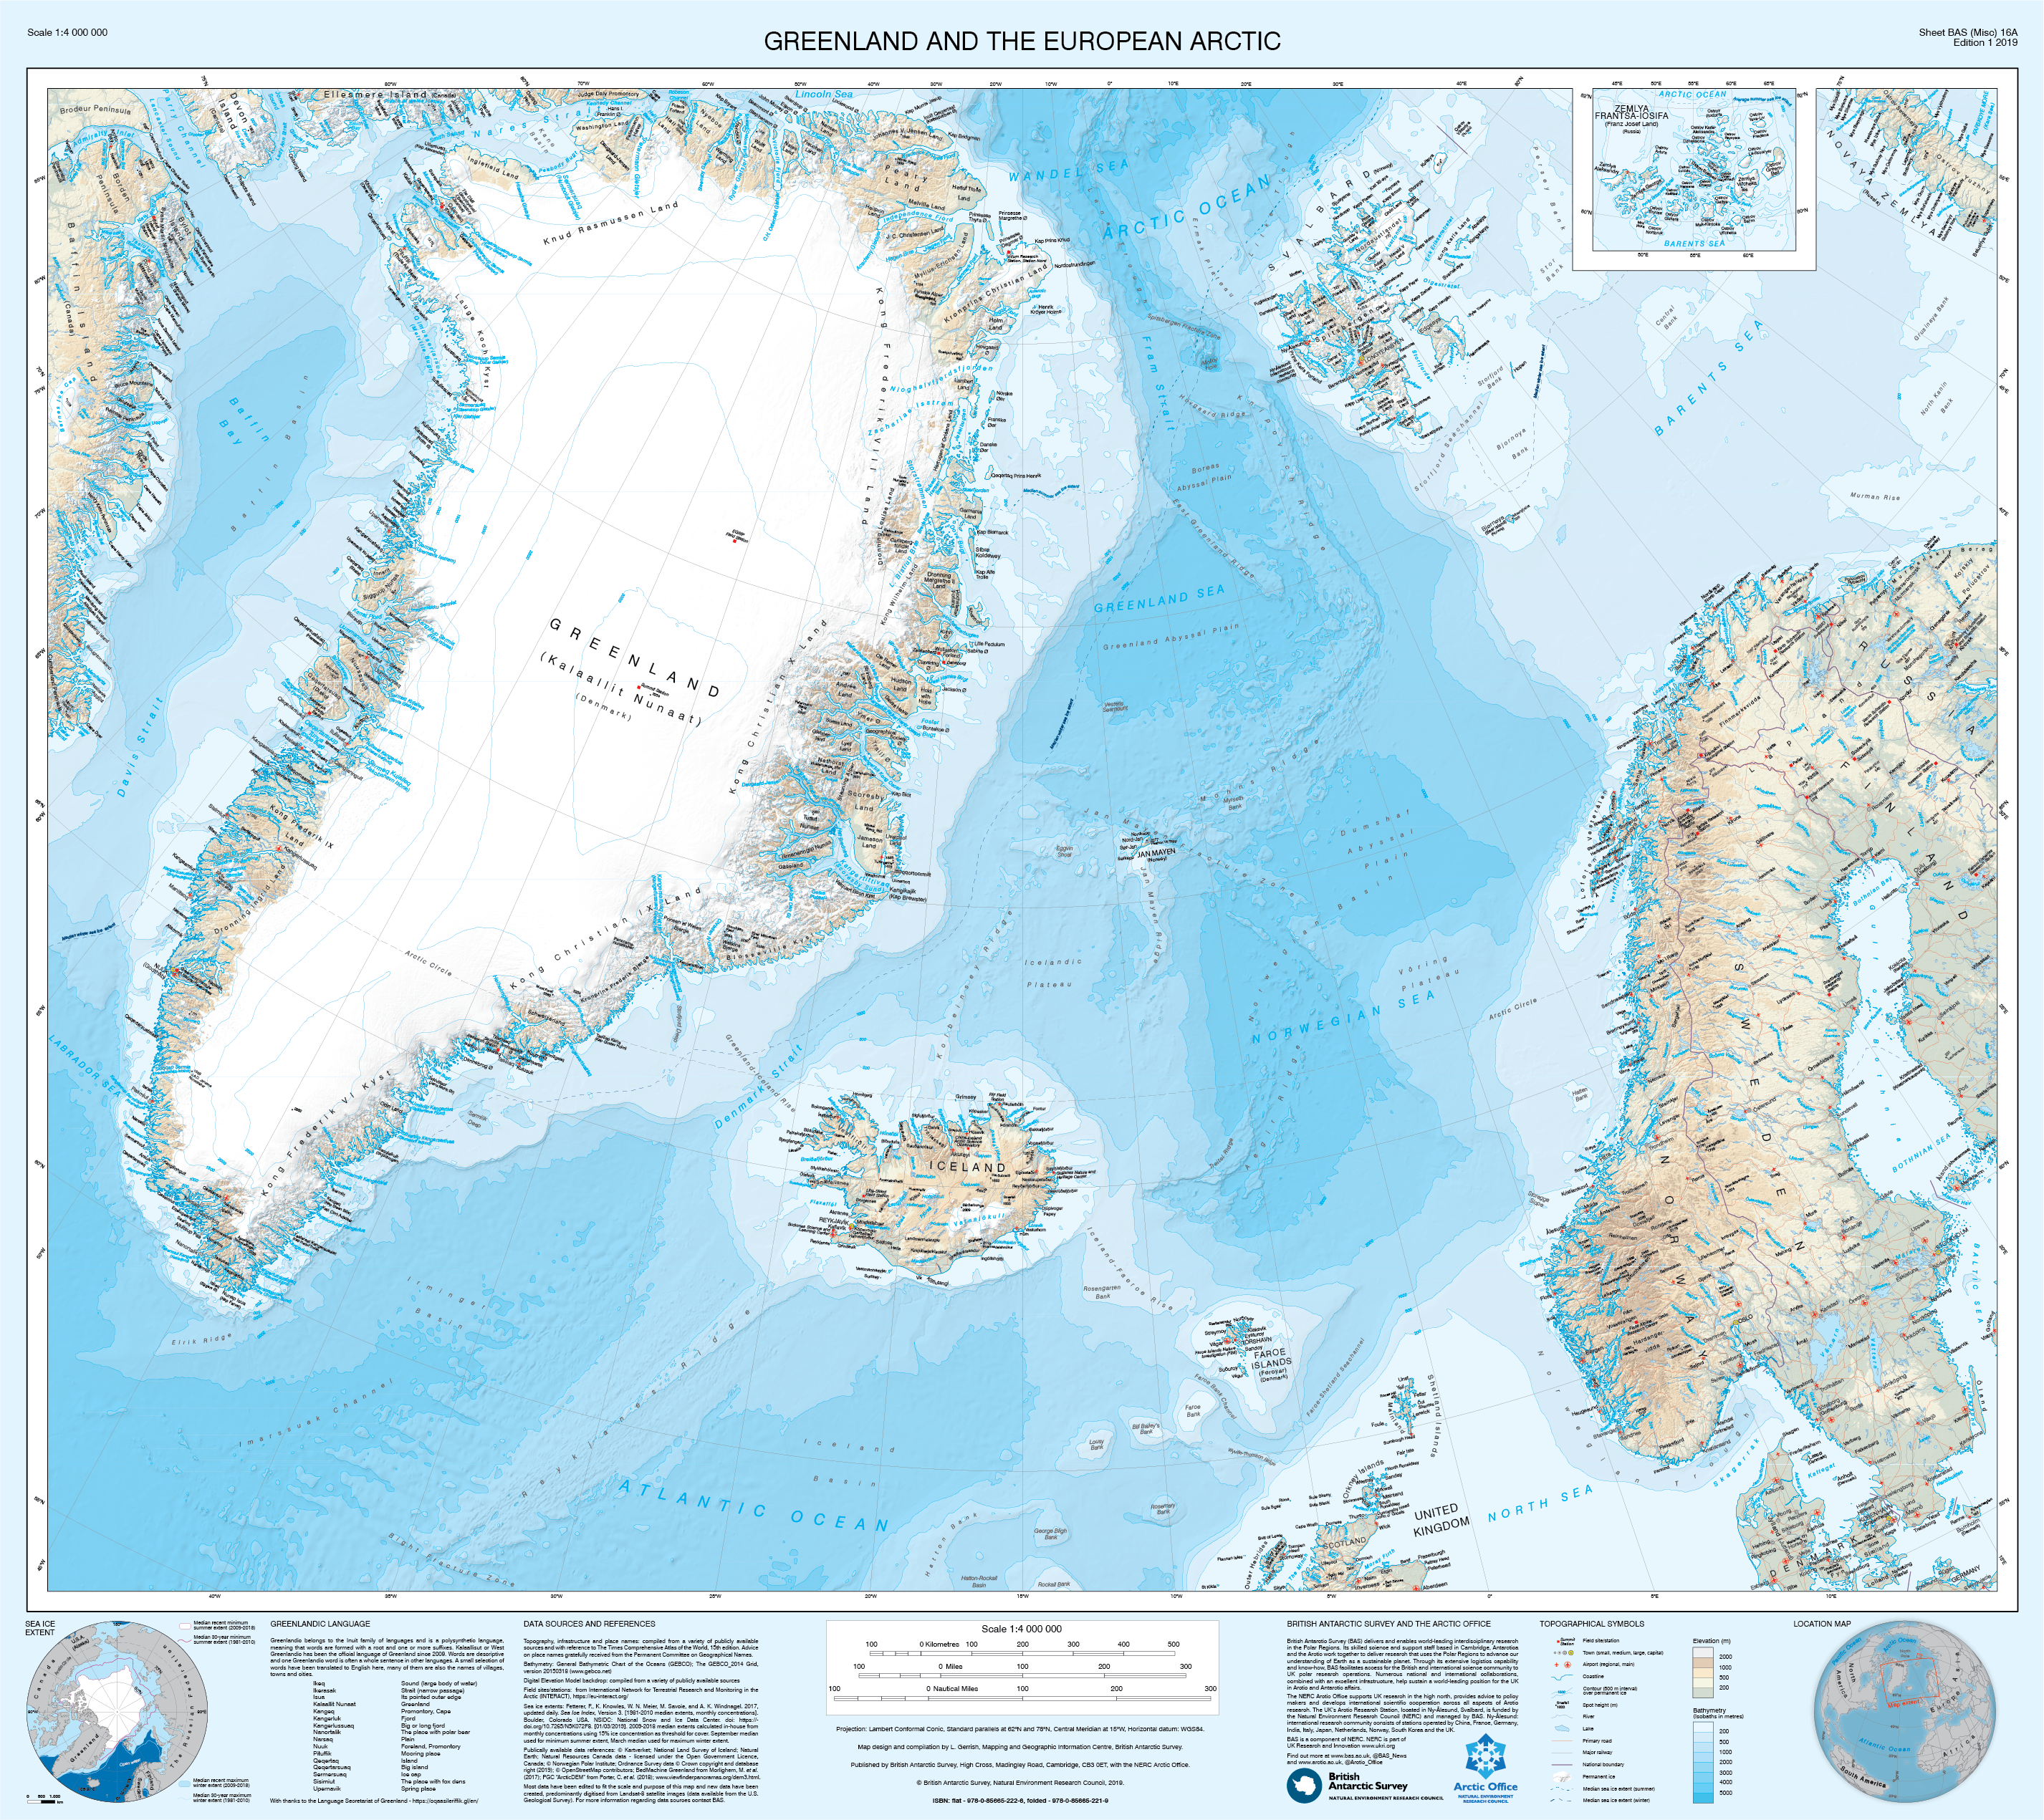
The new map of Greenland and the European Arctic :
the map renders Greenland in relation to northern Europe
This is the first of its kind to cover the entire region on one sheet.
the map renders Greenland in relation to northern Europe
This is the first of its kind to cover the entire region on one sheet.
From BBC by Jonathan Amos
The Arctic is changing rapidly.
It's warming twice as fast as the rest of the planet.
The seasonal sea-ice is in long-term decline and the ice sheet that sits atop Greenland is losing mass at a rate of about 280 billion tonnes a year.
So, if you choose to make a map of the region, you start from the recognition that what you're producing can only be a snapshot that will need to be updated in the relatively near future.
Laura Gerrish, a geographical information systems and mapping specialist at the British Antarctic Survey (BAS), knows this.
Polar science and polar cartography are all about tracing change.

Laura has just finished making a exquisite new printed sheet map (1:4,000,000) of Greenland.
The detail is a delight - from the winding path of all the fjords and inlets, to the precise positioning of current ice margins, and the use of all those tongue-twisting Greenlandic names.
The Arctic is changing rapidly.
It's warming twice as fast as the rest of the planet.
"The map is a little unusual because the area has not been shown on one sheet like this before," explains Laura.
"We have good maps, obviously, of Europe, of Iceland, of Svalbard - but there is nothing that puts them all together on one sheet and shows their relationship like this.
"The map is aimed at scientists, clearly; BAS is a scientific organisation. But we hope tourists on cruise ships and any visitors to Greenland will find it useful, as well as schools or anyone with an interest in the Arctic."
Greenland And The European Arctic, to give the map its full title, has taken nearly two years to put together.
Laura has had to call on more than a dozen data-sets to get the shape of Greenland exactly right.
These have been checked against the latest satellite imagery to ensure physical features are where they're supposed to be.
One or two features, such as islands in the Qimusseriarsuaq (Melville Bay) region, are new because they've only recently been revealed by contracting ice fronts.
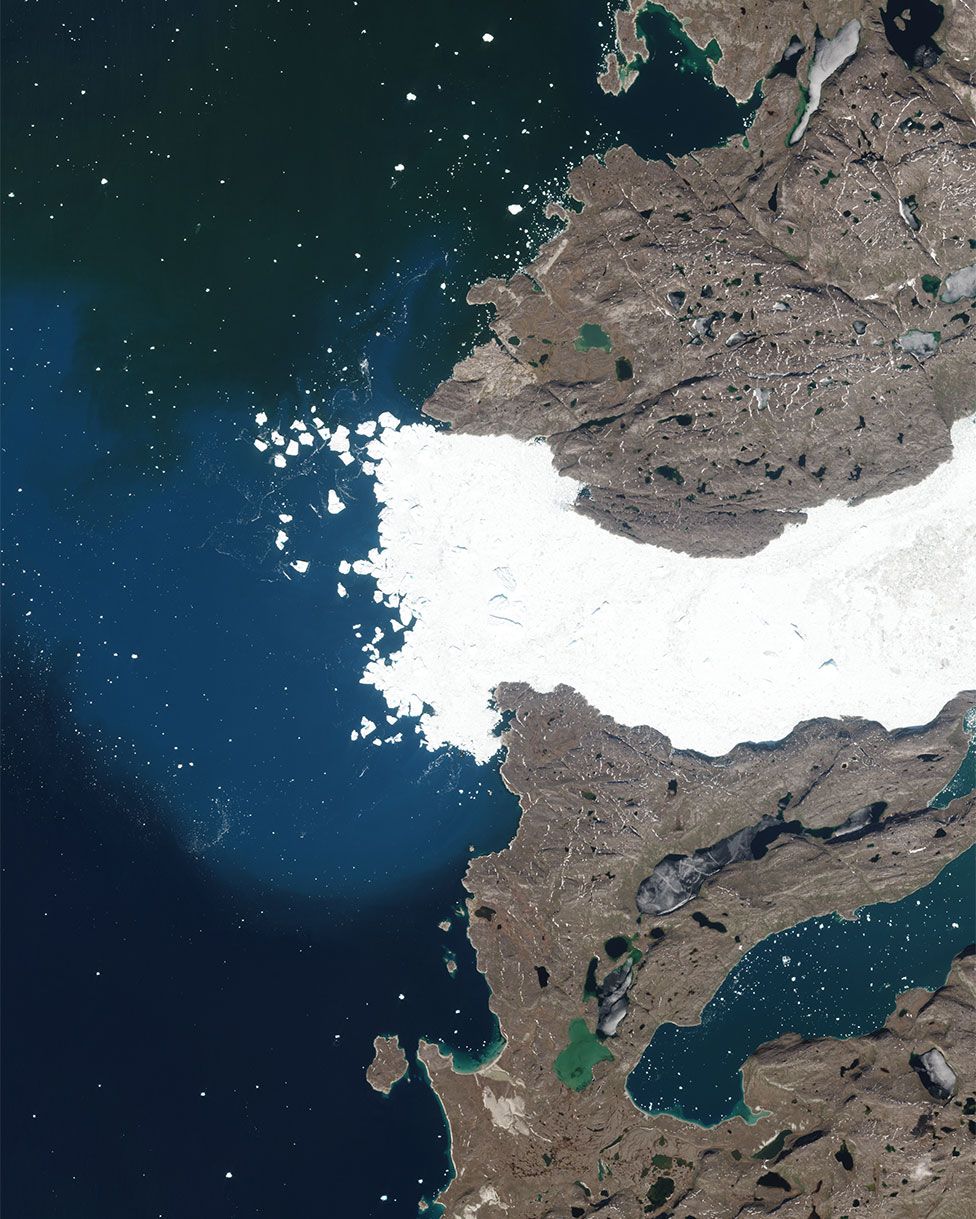
Jakobshavn Glacier spits out icebergs in Disko Bay on the west coast
source : Sentinel Hub
Care has been taken in particular to plot the present extents of all the glaciers, including the big ice streams that sometimes hit the science headlines, such as Jakobshavn, Petermann, Zachariae Isstrom, and Helheim.
These glaciers have demonstrated some remarkable retreat behaviour.
Although just to prove what a thankless task this business can be, they've also shown recently that they can slow and lengthen as well (the net area of 47 regularly surveyed glaciers essentially stood still last year).
You might wonder what the British Antarctic Survey is doing making maps of the polar north.
Henry Burgess, the head of the NERC Arctic Office which is hosted at the survey's HQ in Cambridge, has a simple answer.
"BAS is the national capability and logistics provider for the polar regions," he told me.
"It provides the ships and the planes and the expertise, and the BAS mapping department therefore has a responsibility in both the north and the south."
Henry is especially pleased with the flip side of the sheet map.
This has a series of panels that attempt to put the cartography in a wider context.

The reverse of the sheet map puts changes in the Arctic in context
source : BAS
Different organisations from the UK Met Office to WWF have provided small summaries on various issues that range from the effects that a warming arctic are having on frozen ground and on weather at mid latitudes, to the challenges climate change presents to indigenous peoples and endemic wildlife.
Hopefully, the new fold-out sheet map of Greenland And The European Arctic should be good for at least a few years, but says Henry: "We're seeing dramatic changes in Svalbard for example where we have our Arctic station; the glaciers are pulling back by 10s of metres per year. So, yes, mapping is a constant process."
The Greenland and the European Arctic map is available for sale as either a flat wall map or a folded map at several outlets, including the Scott Polar Research Institute and Stanfords map store in London.
Links :
- BBC : How Greenland would look without its ice / Mighty Greenland glacier slams on brakes / New map traces Shackleton's footsteps
- BAS : New Arctic map
- GeoGarage blog : 5 maps that help explain the Arctic / Map provides high-resolution look at nearly entire Arctic region / New Greenland maps show more glaciers at risk / Seafloor map shows why Greenland's glaciers melt / The beauty of Greenland / Arctic Ocean: history and now
No comments:
Post a Comment