
From ESA
A report, released last Friday, states that ice loss from Greenland and Antarctica has increased fivefold since the 1990s, and now accounts for a quarter of sea-level rise.
It is without doubt that climate change is causing our polar ice sheets to melt, thereby driving up sea levels and putting coastal regions around the world at risk.
Since 1992, when satellite records of ice-sheet melt began, the polar ice sheets have lost ice every single year.
The highest rates of melt have occurred in the past decade.
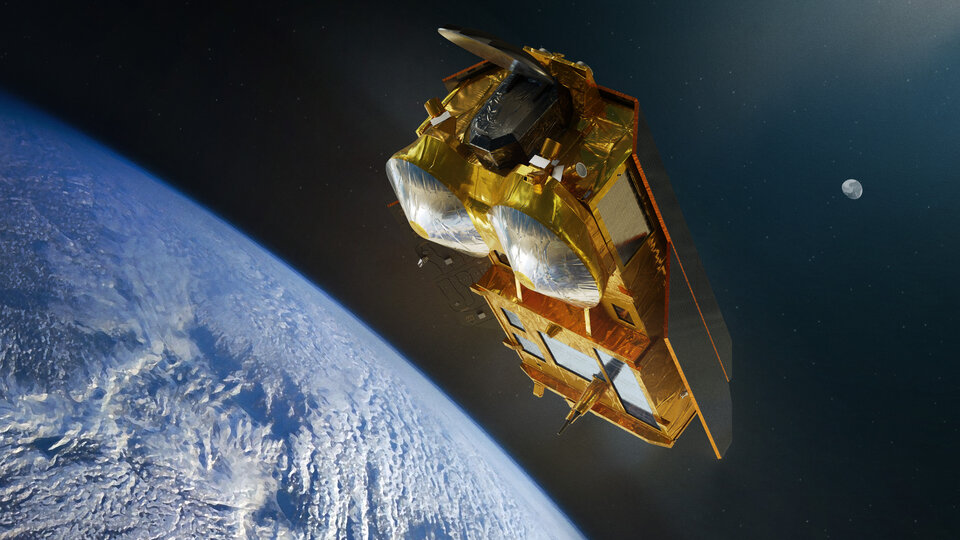
Scientists use data from satellites such as ESA’s CryoSat and the European Union’s Copernicus Sentinel-1 to measure changes in ice volume and flow, as well as satellites that provide information on gravity, to work out how much ice is being lost.
A team of scientists compile these records in the Ice Sheet Mass Balance Intercomparison Exercise (IMBIE), which is funded by ESA and NASA.
This is used widely, including by the International Panel on Climate Change (IPCC), to understand and respond to the climate crisis.
The latest IMBIE assessment, which was published today, states that between 1992 and 2020, the polar ice sheets lost 7560 billion tonnes of ice – equivalent to an ice cube measuring 20 km each side.
The latest IMBIE assessment, which was published today, states that between 1992 and 2020, the polar ice sheets lost 7560 billion tonnes of ice – equivalent to an ice cube measuring 20 km each side.
Ice loss from Greenland and Antarctica
The latest Ice Sheet Mass Balance Intercomparison Exercise (IMBIE) reports that ice loss from Greenland and Antarctica has increased fivefold since the 1990s, and now accounts for a quarter of sea-level rise.
The assessment states that between 1992 and 2020, the polar ice sheets lost 7560 billion tonnes of ice – equivalent to an ice cube measuring 20 km each side.
Melting of the polar ice sheets has caused a 21 mm rise in global sea level since 1992.
Ice loss from Greenland is responsible for almost two-thirds (13.5 mm) of this rise, and ice loss from Antarctica is responsible for the other third (7.4 mm).
The polar ice sheets have together lost ice in every year of the satellite record, and the seven highest melting years have occurred in the last decade.
The polar ice sheets have together lost ice in every year of the satellite record, and the seven highest melting years have occurred in the last decade.
Melting peaked in 2019, when the Greenland and Antarctic ice sheets lost a staggering 612 billion tonnes of ice.
This was driven by summer heatwave in the Arctic, which led to a record 444 billion tonnes of ice being lost from Greenland that year.
Antarctica lost 168 billion tonnes of ice – the sixth highest year on record – owing to the continued speedup of glaciers in West Antarctica and record melting from the Antarctic Peninsula.
East Antarctic Ice Sheet remained close to a state of balance, as it has throughout the satellite era.
Melting of the polar ice sheets has caused a 21 mm rise in global sea level since 1992.
Ice loss from Greenland is responsible for almost two-thirds (13.5 mm) of this rise, and ice loss from Antarctica is responsible for the other third (7.4 mm).
In the early 1990s, ice sheet melting accounted for only a small fraction (5.6 %) of sea-level rise. However, there has been a fivefold increase in melting since then, and they are now responsible for more than a quarter (25.6 %) of all sea-level rise.
If the ice sheets continue to lose mass at this pace, the IPCC predicts that they will contribute between 148 and 272 mm to global mean sea level by the end of the century.
Inès Otosaka, from the University of Leeds in the UK and who led the IMBIE study, said, “Ice losses from Greenland and Antarctica have rapidly increased over the satellite record and are now a major contributor to sea-level rise. Continuously monitoring the ice sheets is critical to predict their future behaviour in a warming world and adapt to the associated risks that coastal communities around the world will face.”
This is now the third assessment of ice loss produced by the IMBIE team and is made possible thanks to continued cooperation between the space agencies and the scientific community.
Over the past few years, ESA and NASA have made a dedicated effort to launch new satellite missions capable of monitoring the polar regions.
The IMBIE project has taken advantage of these to produce more regular updates, and, for the first time, it is now possible to chart polar ice sheet losses every year.
Andrew Shepherd, from Northumbria University and founder of IMBIE, said, “After a decade of work, we are finally at the stage where we can continuously update our assessments of ice sheet mass balance thanks to satellites measuring and monitoring them.”
This third assessment from the IMBIE team involved a team of 68 polar scientists from 41 international organisations using measurements from 17 satellite missions, including, for the first time, from GRACE Follow-On gravity mission.
The assessment will now be updated annually to make sure that the scientific community has the very latest estimates of polar ice losses.
ESA’s Diego Fernandez noted, “This is another milestone in the IMBIE initiative and represents an example of how scientists can coordinate efforts to assess the evolution of ice sheets from space offering unique and timely information on the magnitude and onset of changes.
“The new annual assessments represent a step forward in the way IMBIE will help to monitor these critical regions, where we’ve reached a point where abrupt changes can no longer be excluded.”
ESA’s Mark Drinkwater added, “For over 13 years our CryoSat mission has played a starring role in measuring changes in polar ice.
“To secure the long-term continuation of radar altimetry ice-elevation and topographic-change records, we are currently developing the CRISTAL mission, a Copernicus Sentinel Expansion Mission, to enhance and extend the record from CryoSat and earlier heritage missions.”
IMBIE is supported by NASA and ESA’s Earth Observation Science for Society programme and Climate Change Initiative, which has contributed long-term satellite observation records to the study. Data on both ice sheets from multiple missions provides a consistent record of change from the 1990s to present day.
Links :
BBC : Accelerating melt of ice sheets now 'unmistakable'
ReplyDeleteWMO annual report highlights continuous advance of climate change
ReplyDelete