Saturday, December 12, 2020

Old nautical map of Chausey island

Map of main island of Chausey (France) by the British Admiralty, which seems to date from 1828, mentioning the names of the French cutters and English ships anchored in the Sound
(note in passing their way of anchoring, one anchor on each side at almost 180° with sometimes a third one behind).
 
Note also the sort of bastion around the beacon that was set up at the top of the hill of the future semaphore.
courtesy of Hervé Hillard

Chausey (SHOM nautical chart) with the GeoGarage platform
 
Links :

Friday, December 11, 2020

France & misc. (SHOM) layer update in the GeoGarage platform


174 nautical raster charts updated & 2 charts replaced

Norway (NHS) update in the GeoGarage platform

126 nautical raster charts updated 

The Nature Conservancy publishes first-ever detailed maps of all Caribbean coral reefs


An aerial drone is used to gather habitat imagery in Soufriere-Scott's Head Marine Reserve in Dominica.
© Steve Schill for TNC

From Nature by Rachel Winters and Jessica Wiseman

High-resolution maps of the underwater habitats of the entire Caribbean have the potential to transform marine conservation and significantly enhance our knowledge of the ocean.

Today, The Nature Conservancy (TNC), one of the world’s leading conservation organizations, along with partners, published detailed maps of important shallow underwater habitats throughout the entire Caribbean — including all shallow water coral reefs.
For the first time ever, countries and territories now have a clear picture of the habitats found beneath the waves of the Caribbean.
These revolutionary maps will help guide the sustainable use and protection of marine resources for island nations in which 60% of living coral has been lost in the past few decades alone.


These maps were created by stitching together tens of thousands of high-resolution satellite images, and in some places using aerial fly-over technology, drones, and divers to dig deeper and validate the data.
By utilizing data captured from outer space to undersea, scientists were able to map and more accurately interpret the coastal ecosystems throughout the Caribbean.
Having accurate and complete underwater habitat data for this region means that there is now cutting-edge guidance available to inform the sustainable use of marine resources on which 44 million Caribbean residents depend.

“You cannot protect what you don’t know is there.
Having access to these maps is a game-changing achievement for the Caribbean.
Thirty countries and territories finally have access to better, more detailed information about their underwater habitats to help them better protect marine areas, support sustainable livelihoods and prioritize their adaptation to potential climate change impacts,” said Dr.
Robert Brumbaugh, Executive Director of The Nature Conservancy’s Caribbean Division.
“Understanding and protecting natural resources is critical to the economic success of these countries.”

TNC's Dr. Steve Schill conducts field surveys in the waters of Grand Cayman to support interpretation of data collected via aerial drone.
© George Raber.jpg
 
Roughly half of all livelihoods in Caribbean communities depend on healthy nearshore and coastal habitats, including fishing and tourism.
According to a study published by TNC in 2019, every year coral reefs and reef-associated activities generate an estimated $7.9 billion in economic value to the tourism industry and draw nearly 11 million visitors to Caribbean islands.
These maps are intended to inform a diverse array of conservation and policy decisions to protect and restore these essential coastal areas that people depend on.
Decision-makers across the region can now use these new maps to identify areas optimal for coral restoration activities, guide climate change adaptation, and identify the best locations for establishing marine protected areas that successfully balance protection and diverse uses.

“The scope of these maps is unprecedented in the region, and the opportunities they unlock to provide a better future for Caribbean ecosystems, and the millions of people who depend upon them, are astonishing” commented Dr.
Joseph Pollock, Senior Coral Reef Resilience Scientist for TNC.
“Using traditional approaches, it would have taken approximately 250 million diver hours to map such a large area. New technologies have helped deliver these desperately needed maps at a tiny fraction of the effort and cost.”

An aerial drone is launched to gather habitat imagery off the coast of St. Croix, USVI. 
© Steve Schill for TNC.jpg
 
TNC scientists, in partnership with the Arizona State University Center for Global Discovery and Conservation Science (ASU GDCS), worked with Planet Labs Inc.
to stitch together more than 38,000 high-resolution satellite images – a process similar to putting together a massive puzzle piece by piece.
The finalized maps are now available at CaribbeanMarineMaps.tnc.org and TNC is working with Vulcan Inc.
to make them available on the Allen Coral Atlas in 2021.
These maps reveal in great detail the location of coral reefs, seagrass beds, and other oases of underwater life, making it possible to more accurately monitor the impacts of climate change, measure the effects of hurricanes and identify areas that need protection and restoration.

“Working with TNC to enhance the value of Allen Coral Atlas offerings and data will be a tremendous asset to the coral conservation community,” said Paulina Gerstner, Program Director of the Allen Coral Atlas.
“This high-resolution view of Caribbean shallow reef ecosystems perfectly augments the global mapping work being undertaken by the Atlas partnership.”

Satellite imagery of marine habitats in Jardines de la Reina in Cuba © Planet.jpg

On some islands, researchers combined high-resolution satellite imagery from Planet Labs Inc.
with imaging spectroscopy data captured from ASU’s Global Airborne Observatory (GAO).
The GAO is an airborne laboratory housing advanced Earth imaging technology, developed by Dr.
Greg Asner, Director of ASU GDCS and the GAO.
The airplane’s four integrated remote sensing technologies collect high-resolution data for environmental monitoring.
The findings were then validated with aerial drone imaging and on-site diver surveys.

“The GAO maps provide details about reefs that cannot be gleaned from satellite data, such as the location of corals on the seafloor.
We used these GAO maps, for example, to specifically delineate the best locations for coral outplanting” said Asner.
 
Arizona State University's Global Airborne Observatory flies over Buck Island Reef National Monument, USVI.
© Marjo Aho for TNC.jpg
 
As part of a pilot test on using these maps in the field, the Dominican Republic became the first country to utilize this new technology.
In 2019, TNC and local partners, including Fundación Grupo Puntacana and Fundación Dominicana de Estudios Marinos, led a coral planting event to help restore endangered staghorn corals.
Scientists used the data acquired by the GAO’s fly-over to identify the best locations to plant corals — including where they would be most likely to survive and have greatest positive impact.
This research guided one of the most comprehensive coral planting efforts in the history of the Dominican Republic.

“These maps are now being distributed and made widely available to a variety of stakeholders across the Caribbean.
Working with partners, we will use these maps to strategically expand marine protected areas, inform smarter coral reef restoration, support nature-based solutions against the threats of climate change, and overall catalyze more effective conservation actions” added Dr. Steve Schill, Lead Scientist for TNC’s Caribbean Division.

This work was generously funded by Daniel C. Chung, Kowalski Family Foundation, The Tiffany & Co. Foundation, Community Foundation of the Virgin Islands, J.A. Woollam Foundation, MacArthur Foundation and Paul G. Allen Family Foundation.
 
Links :

Thursday, December 10, 2020

Great Barrier Reef outlook 'critical' as climate change called number one threat to world heritage

Photograph: James Cook University/AFP via Getty Images

From The Guardian by Lisa Cox

The outlook for Australian sites including the Blue Mountains and the Gondwana rainforests has deteriorated, report saysThe outlook for the Great Barrier Reef has worsened from ‘significant concern’ to ‘critical’, the International Union for Conservation of Nature says.

The outlook for five Australian world heritage sites including the Great Barrier Reef, the Blue Mountains and the Gondwana rainforests, has deteriorated, according to a global report that finds climate change is now the number one threat to the planet’s natural world heritage.

The International Union for Conservation of Nature, the official advisory body on nature to the Unesco world heritage committee, has found in its world heritage outlook that climate change threatens a third of the world’s natural heritage sites.
The outlook has been published every three years since 2014.

 
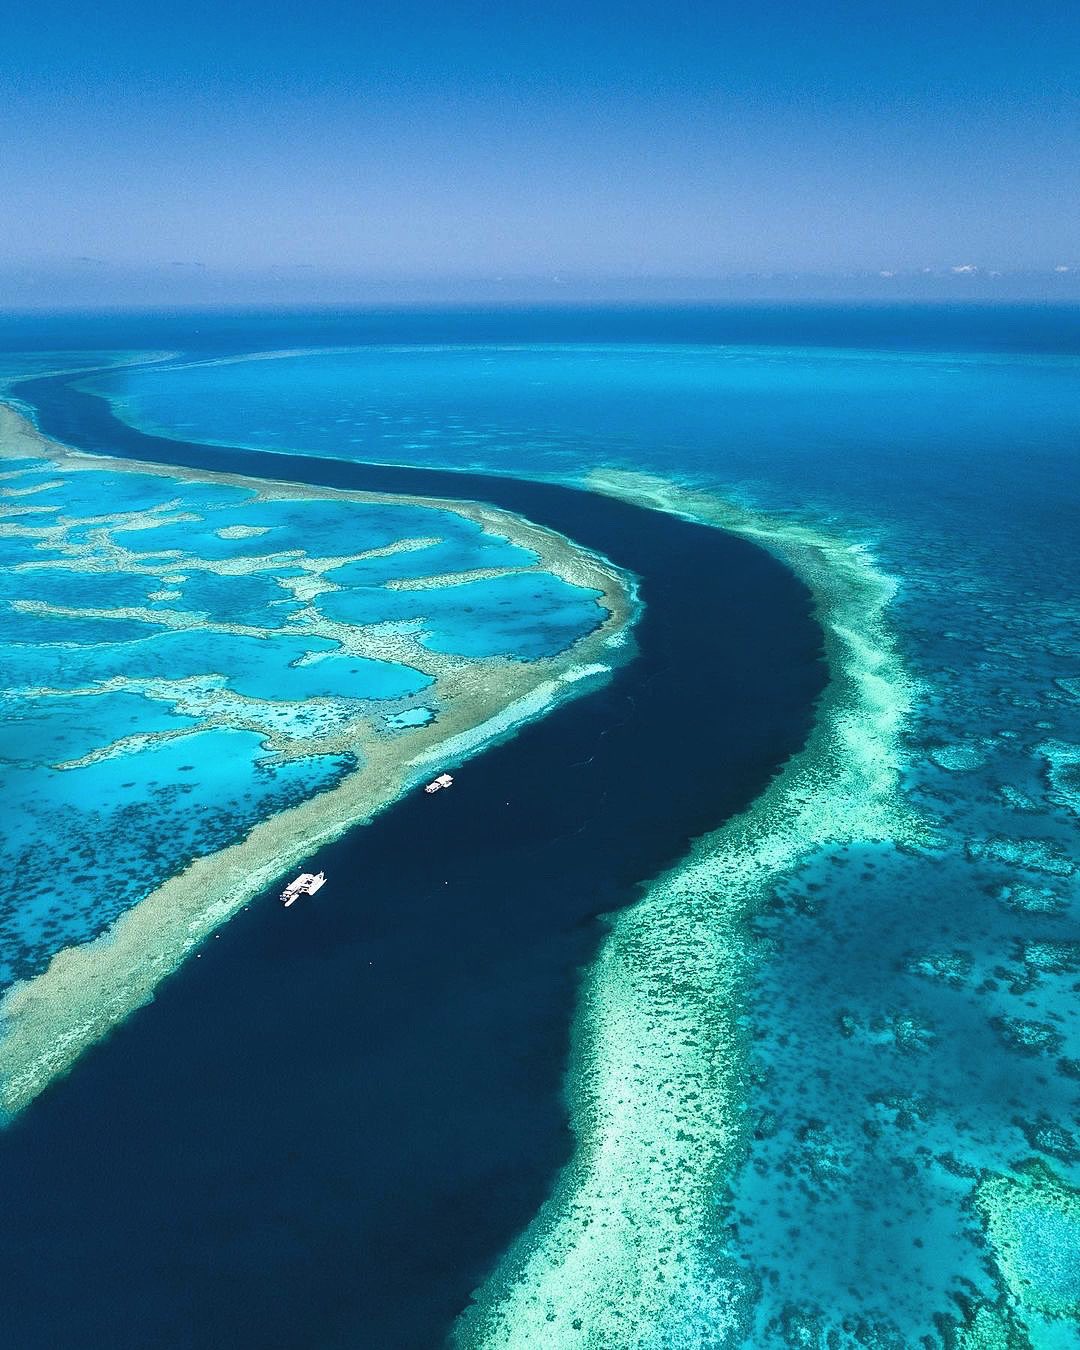
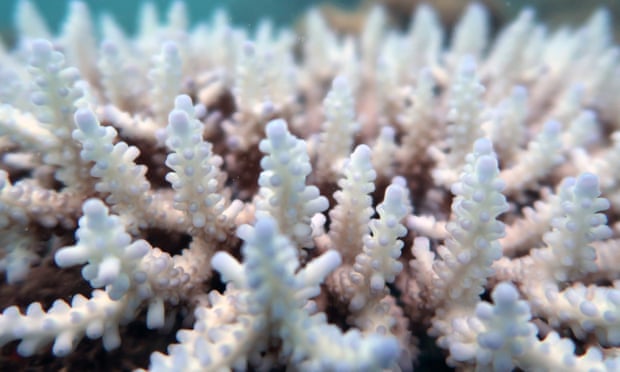
It finds the conservation outlook for the Great Barrier Reef has worsened from “significant concern” to “critical” – the most urgent status under the IUCN system.
The reef suffered its third mass coral bleaching in five years during the 2019-20 summer.

In the aftermath of the 2019-20 bushfire disaster, the Gondwana rainforests – comprising 40 separate reserves between Newcastle and Brisbane – and the Greater Blue Mountains world heritage area have seen their outlook move to “significant concern” in 2020 from “good with some concerns” in 2017.

The fires affected more than 80% of the Blue Mountains world heritage area and more than 50% of the Gondwana rainforests, with the bushfire royal commission finding the disaster was just a glimpse of what climate change would deliver to the country in the future.

Western Australia’s Shark Bay and Ningaloo Coast world heritage sites have deteriorated in the IUCN outlook from “good” to “good with some concerns”.

Other Australian world heritage sites remained in the same categories from previous reports including the Kakadu National Park and Queensland’s wet tropics, which are both listed as “significant concern”.


The renowned coral reef scientist, Terry Hughes, said it was logical the IUCN had moved the Great Barrier Reef into the critical category after three bleaching events in five years.

But he said it didn’t make sense that others, such as the Ningaloo Reef that fringes the Ningaloo Coast, were not also considered critical given the scale of the threat climate change posed to coral reefs worldwide.

“It’s not really credible to say the Barrier Reef is now super vulnerable to climate change but other coral reefs around the world aren’t,” he said.
“Unesco have actually made that case very clearly.”

Australia has 12 natural world heritage sites, four cultural world heritage sites and four mixed world heritage sites.

The report finds climate change is either a very high or high threat to 11 out of the 16 natural and mixed sites and that the “manifold” effects of the climate crisis – including increased frequency and severity of fires, droughts and coral bleaching – were often accompanied by other threats, leading to a poorer outlook overall.

K’gari/Fraser Island, which was ranked “good with some concerns”, is the latest world heritage area to suffer the effects of catastrophic fire, with half of the island burnt in a bushfire that has been alight for six weeks.

On Wednesday, the chair of the next major UN climate summit pointedly thanked Australia’s state and territory governments – but not the Morrison government – for committing to targets of net zero emissions by 2050.

Last month, the IUCN World Conservation Congress passed a motion moved by an alliance of Australian environment groups that called on the Morrison government to show leadership and ensure its planned reforms of Australia’s national environmental laws delivered more for the environment, including world heritage areas.

“Australia’s World Heritage sites are places of outstanding global significance and it is our privilege – and responsibility – to lead in protecting these values, including from the impacts of climate change,” said Rachel Lowry, WWF-Australia’s chief conservation officer.

Lowry said a stronger government plan to address the climate crisis and reduce emissions was “essential for these special places to remain”.

“There is no doubt that if we are to learn from the recent devastating bushfires, as well as the findings in this report, we must commit to regenerating Australia and setting our nation on a pathway where both people and nature benefit,” she said.

The Australian Marine Conservation Society’s Great Barrier Reef campaign manager, Dr Lissa Schindler, said: “The federal government’s refusal to act decisively on climate change is unforgivable when they know that global heating is so dangerous for our reef.

“We call on the federal government to take its role as custodians of our international icon seriously by committing to a pathway compatible with 1.5C of heating in a wide-ranging national climate change policy,” she said.

A spokesman for the federal environment minister, Sussan Ley, said the report reflected the extreme weather events Australia had experience over the past 12 months.
 
Australia's Great Barrier Reef runs the risk of another summer of elevated coral bleaching if cyclones and other rain events don't arrive to "suck out the heat"

He noted the IUCN had reviewed Australia’s protection and management of world heritage sites favourably, which he said was due to the “significant work” of federal, state and territory governments at those sites.

“Australia is committed to playing its role in a global response to climate change, it is investing unprecedented amounts protecting the reef, in bushfire wildlife and habitat recovery and in supporting our world heritage places,” the minister’s spokesman said.

The IUCN’s director general, Bruno Oberle, said countries owed it to future generations to protect the world’s “most precious places”.

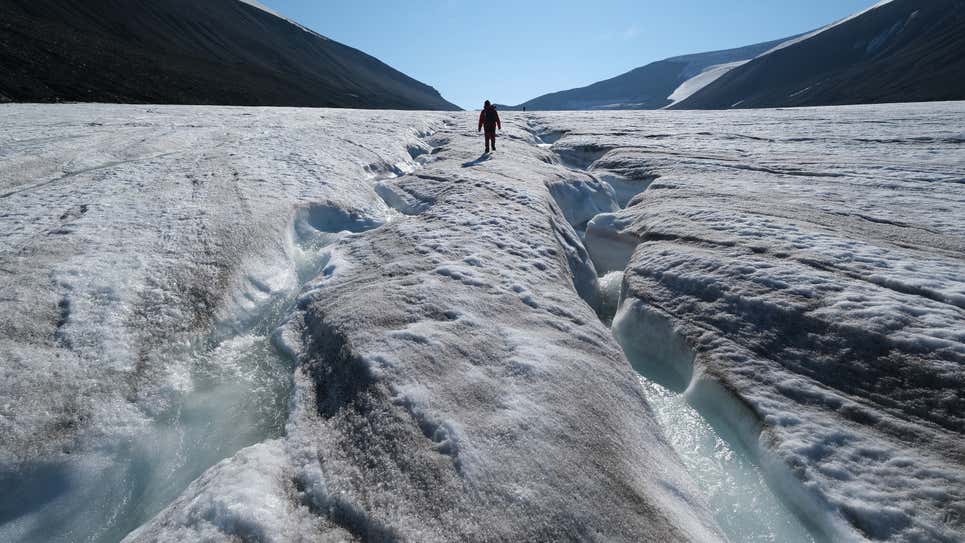
He said the report showed “the damage climate change is wreaking on natural world heritage, from shrinking glaciers to coral bleaching to increasingly frequent and severe fires and droughts”.

Links :

Wednesday, December 9, 2020

The old Arctic is gone

A hiker walks among winding channels carved by water on the surface of the melting Longyearbreen glacier during a summer heat wave on Svalbard archipelago on July 31, 2020.
Photo: Sean Gallup (Getty Images)

From Gizmodo by Brian Kahn

Scientists have spent the past 15 years pulling together data about the Arctic into an annual report card.
What’s become clear in the 15 iterations of the report is nothing will be the same for centuries to come, and the shifts are happening faster than anticipated.

On Tuesday, researchers unveiled the latest edition of the report card at the virtual American Geophysical Union fall conference.
It chronicles the past year of unprecedented transformation to every facet of the region and its impact on the people who call the Arctic home.

“In 2006 it was clear that the Arctic was changing,” the report said.
“However, the complexity of change was less understood and the rapidity of change that would occur in just a few years, highlighted by the (then) record-smashing low September 2007 sea ice extent, was unanticipated.” 
 
Arctic Report Card: Update for 2020 - Tracking recent environmental changes, with 16 essays prepared by an international team of 134 researchers from 15 different countries and an independent peer review organized by the Arctic Monitoring and Assessment Programme of the Arctic Council.
This is the 15th anniversary of the Arctic Report Card.
 

This year served up a reminder of every single aspect of Arctic change.
Sea ice? It hit its second-lowest level on record.
Temperatures? Second-highest ever recorded, with large areas persistently 7.2 to 10.8 degrees Fahrenheit (4 to 6 degrees Celsius) above normal.
Wildfires? Out of control and also unprecedented.

The report card puts these changes in context of the past few decades.
While all are jarring, this year’s wildfire activity stands out as truly exemplary of what’s happening to the region.
The report card, along with other research presented at AGU, found that Siberian fires this year burned an estimated 23 million acres, an area nearly six times the size of this year’s record blazes in California.
Alison York, a fire expert at the University of Alaska, said the area burned was “unprecedented” in 40 years of records.
It trails 2019, another massive fire year that may have contributed to 2020's extreme fire behavior.

“Many of 2019 fires did overwinter in the duff to jumpstart an early fire season in 2020’s extremely warm conditions,” York said.

Research earlier this year showed that climate change led to a 600-fold increasein the chances of fires like those seen in 2020 amid staggering 100-degree heat.
The blazes also released a record amount of carbon dioxide, as carbon-rich soil and trees went up in smoke, ensuring that more change gets baked into the system (don’t get me started on the exploding tundra).

That and the other shifts chronicled in 2020 are all exclamation points on a region in flux, with trends showing the quickening pace of transformation.
The build-up index, a measure of heat, relative humidity, and precipitation that’s used to predict fire activity, has trended way up over the past 40 years.
The ice the Arctic is known for is also disappearing and leading to widespread changes; Greenland’s ice melt has also quadrupled over the past 20 years, locking in ever greater rates of sea level rise.
In parts of the Arctic Ocean where ice-free summers are now the norm, there’s been a significant increase in temperatures over areas with ice-free summers, showing the ways that darker open water is trapping more heat in the region.
 
2020: This year saw continued declines in Arctic sea ice.
2020 Arctic sea ice summer minimum was the 2nd lowest in the 42-year satellite record behind 2012.
 

But more than the geophysical trends are the trends in shock among researchers.
The report notes when researchers began the report card 15 years ago, the changes being observed today were “unanticipated.”
It refers to shifts as a “sustained transformation.”

Rick Thoman, a researcher at the Alaska Center for Climate Assessment and Policy and report editor, noted in a press conference that the region is “warmer, less frozen, and biologically changed in ways that are scarcely imaginable even a generation ago.”

“The Arctic has achieved a ‘new normal,’” Jackie Richter-Menge, one of the report’s original (and current!) authors, said while referencing a photo she took on her first trip to sea ice on Prudhoe Bay, Alaska in March 1982, compared to one she took in February 2018.
The former showed a 30-foot-thick (9-meter) layer of sea ice, while the latter showed broken, fractured ice and open water.

Links :

Tuesday, December 8, 2020

Canada (CHS) layer update in the GeoGarage platform

34 nautical raster charts updated & 1 new chart added

Humanity’s construction footprint in the seas amounts to 32,000 square kilometers


Palm Jumeirah

From Mongabay by Allison Gasparini
  • A new study puts the physical footprint of marine structures globally into numbers for the first time.
  • Researchers conservatively estimate that 32,000 square kilometers (12,000 square miles) of the global seafloor is covered by human-made structures.
  • The map provides a jumping-off point for spatial planning to minimize the negative impacts of marine construction on local ecology.
From underwater tunnels to bridges to communication cables snaking across the ocean floor, structures made by humans are encroaching on marine life at an ever-growing pace.
Our physical footprint of marine construction covers an area of 32,000 square kilometers (12,000 square miles) on the seafloor globally, according to a recent study in Nature Sustainability.

The area spanned by these and other structures, such as artificial islands for coastal residents and vast aquaculture farms near shore, already is larger than the entirety of Belgium.
And it’s only projected to get bigger over the next decade, conclude the scientists, who project the area to expand by another 7,300 square kilometers by 2028.

The study marks the first time that the impact of marine structures on our global seascape has been quantified.
Researchers from the University of Sydney, Australia, collaborated with an international team to synthesize the available global data on marine structures and used it to come up with a conservative estimate of sprawl size.
 
Taken by an astronaut aboard the International Space Station, this picture shows fish farms along the coastline of the Liaoning Province in China.
Photo credit: NASA

“I’m gravely concerned about the damage that we’re doing to the marine environment,” said Louise Firth, a marine ecologist at the University of Plymouth, U.K., who was not involved in the study.
Yet in spite of concerns within the scientific community, no team had tried to grasp the complete scale of the activity until now, she said: “This is a great first step.”

Despite limitations and gaps in information, the map provides a valuable jumping-off point for future efforts to minimize the damaging impacts of human construction on marine ecosystems, said lead author Ana Bugnot, a marine ecologist at the University of Sydney.

“There’s an idea that the ocean is vast, and no matter what we do we’ll never destroy it,” Bugnot said.
“If we can get an estimate of how much we’ve damaged the environment in a number, people are more likely to pay attention.”

Such measurements help numbers-oriented people in positions of power, such as policymakers and construction managers, recognize that marine structures have profound impacts, Bugnot told Mongabay.
 
Floating sea farms off the coast of Xiapu, China.
Photo credit: Alex Berger

It took five years for the team to collect data, because there were no centralized sources.
While big corporations usually have archives of information, said Bugnot, some industries are secretive.
For instance, telecommunication companies might not divulge where they place cables on the seafloor.
Many countries are less willing to share details about their coastal development programs.

According to the study, most marine construction—a term that encompasses marinas, commercial ports, oil rigs, and more—is located within the Exclusive Economic Zones belonging to coastal nations.
In the United States alone, more than 50 percent of the country’s natural shoreline has been replaced by structures, such as seawalls and breakwaters.

Aquaculture farms, where workers produce seafood from shrimp to clams to fish, account for many of the marine structures today.
However, the study projects that structures related to alternative energy, such as windmill platforms and tidal farms, will grow most quickly going forward—expanding in area as much as 208 percent each year.

Most tricky for the team was gathering information on locally managed structures, such as artificial reefs—synthetic creations used to help restore coral reefs.
Most such structures have unreliable records and aren’t even managed, Bugnot said.
These manufactured habitats are tools of conservation, but they can have negative impacts if overdone in sensitive areas close to shore, she noted.

Bugnot and her colleagues hope managers and developers will use their map for spatial planning.
By determining where existing structures are located, communities can prioritize where and how to place new eco-friendly construction.

“At no point in this article are we saying, ‘You have to stop all marine construction.’ That’s just not going to happen,” said Bugnot.
“It’s about finding compromises.”
 
Links :

Monday, December 7, 2020

Is the iPhone 12 waterproof? We took it for a swim to test its water resistance

Watch the video on this page for the full test and to see some amazing underwater footage from the drone.

From CNET by Lexy Savvides

Apple's iPhone 12 put up a good fight after being submerged in the chilly waters of Lake Tahoe.

We know the iPhone 12 can handle spills and splashes, but Apple may be downplaying just how water-resistant this phone really is.
The iPhone 12's IP68 rating means it can survive up to 19.6 feet (6 meters) of water for 30 minutes.
This applies to all four iPhone 12 models: the iPhone 12, iPhone 12 Mini, iPhone 12 Pro and iPhone 12 Pro Max.
But we discovered that like its predecessor, Apple's newest iPhone can handle a great deal more than that.
Both of the iPhone 11 models far exceeded the official rating, surviving a 39-foot dive in salt water in Monterey Bay, California.
This year we took a brand-new iPhone 12 for a swim in the frigid fresh water of Lake Tahoe, on the other side of the Golden State, to test it out.

Teaming up with Mission Robotics, we mounted our iPhone 12 on the company's underwater drone, Theseus.
The drone can go as deep as 984 feet (300 meters) underwater; the pilot can see the view from Theseus' camera, as well as monitoring depth and water temperature metrics from a computer on shore.

John Kim/CNET

Dive 1: Testing the claim (19.6 feet for 30 minutes)

According to Apple's support page, you shouldn't intentionally submerge or swim with your iPhone, or take it to extreme temperatures.
But for the purposes of our test, we wanted to push it to the limits.

For our first dive, we wanted to test the IP68 claim: 19.6 feet (6 meters) of water for 30 minutes.
From the shore of Lake Tahoe, we positioned the iPhone on a mount facing the drone's camera with the screen set to stay on, so we could see if anything happened to the iPhone while it was underwater.

 
The iPhone 12 on Theseus.John Kim/CNET

The water temperature in Lake Tahoe at this depth was 52 degrees Fahrenheit (11 degrees Celsius).

Once the 30 minutes were up, we pulled the phone out of the water and dried it off with a cloth.
Then we tested it out to see if the phone was working.
The touchscreen was fine and the volume rocker worked as expected.
All three cameras (front, ultrawide and wide) looked clear with no evidence of fogging and the photos looked normal.
We recorded a voice memo before dunking the phone and could hear that after the first dive the speaker sounded a little muffled in comparison, but it's hard to tell whether that would've improved after letting it dry out longer.
Apple's support page suggests placing the iPhone's base and Lightning connector in front of a fan to help the drying process.
We had other ideas, however.

Dive 2: The extreme test (65 feet)


With the iPhone 12 working as normal, we got the drone ready for its second dive in Lake Tahoe.
This time, we wanted to take the phone to more extreme depths.
We submerged the phone to 65 feet (20 meters) underwater, more than three times the maximum depth rating.
The water temperature at this depth was 50 degrees Fahrenheit (10 degrees Celsius).

With the timer running on the iPhone 12's screen, we could see how much time had elapsed since we submerged the phone.
Once it hit 30 minutes, we decided to leave it submerged a little longer, just to see what would happen.
We finally pulled the drone out of the water at the 40-minute mark and ran through the same tests once more.

John Kim/CNET

Surprisingly, everything worked as normal.
The screen was responsive, the volume and power buttons worked, and the two cameras were in working order as well.
The speaker still sounded muffled when playing back the voice memo, but it was still audible.

After wiping down the iPhone 12, we powered it down and let it sit for a few days to let it dry out completely.

The final test

After letting it dry out for 72 hours, we wanted to do one final test to see if there had been any long-term damage as a result of the extreme underwater test.
The phone itself was completely dry, but its three lenses -- the ultrawide and wide-angle on the back, as well as the front camera -- had developed some fogging.

At this point the battery had also completely drained, so we let the phone juice up for a while via the Lightning port before powering it back on.
But once we did, the iPhone 12's screen showed a Diagnostics prompt.
After trying to get through the Diagnostics prompt a few times, we plugged the iPhone 12 into a MacBook to see if we could reset the device.
It worked, but we still couldn't get past the Diagnostics screens.

While we have no way of knowing exactly what caused this error to happen, it may have been lingering water damage, the shift in temperature between the cold water of Lake Tahoe to an indoor environment, or a combination of both.

How water-resistant is the iPhone 12?


Our highly unscientific test would suggest that the iPhone 12 can withstand very deep water and clearly meets the IP68 claim.
But, like all electronics, it does have a limit to how much water it can take and you should never intentionally submerge the phone in water (lake or otherwise).

As with our earlier water experiment with the iPhone 11, your results may vary.
Also remember that water damage is not covered under warranty.
We contacted Apple and the company pointed us toward these instructions on its support page.
Following these guidelines may improve your iPhone's chances in the event that it does come into contact with water or any other kind of liquid.


Sunday, December 6, 2020

Biggest waves & ocean power | The Ocean Race

Enjoy some of the biggest waves and wettest moments from The Ocean Race.