He was diagnosed with psoriatic arthritis in 2008, which disabled him so much that he lost his business.
After 5 years of intense pain and increasing dependency on drugs, he decided to quit all drugs cold turkey, and find alternative ways to deal with his disease.
He began practising yoga daily, changed his diet, and started practising freediving.
This caused drastic changes: within months he could walk without a cane, and he could play with his two young daughters again.
It also taught him how good he actually was at freediving; within a year he started setting Danish records.
He started traveling the world going to freediving competitions, where the warm weather and sun also improved his condition.
He used his increased exposure from the Danish records to tell the story of his recovery and inspire people to live a healthy lifestyle.
He started teaching others how to deal with auto-immune disorders.
The downside of his new fame was that the insurance company, who paid his monthly disability check, noticed that he was doing things a healthy person does.
Despite the argument that he's only healthy because he can do these travels and trainings, the insurance company threatened to sue him for lying -he'd have to pay back all the disability checks plus a fee.
With the help from his doctors Stig managed to convince them his disease is real, just that he manages it well, but the insurance company decided to stop paying him his disability.
The stress this whole procedure caused was enormous and Stig relapsed into severe pain.
We shot this video in January, the hardest month for Stig, where he had to figure out how to proceed. We talked about how life can keep dealing you blow after blow, and how you know that you'll be ok anyway.
But it still sucks that you have to deal with the blows, and have to go through that uncertainty of what comes next.
Stig has decided to focus on his new breathing program, in which he teaches people how to breathe properly to deal with stress and disease, together with yoga and diet.
He might not be able to compete much this year, but he's getting back up and doing his best to be of use to others.
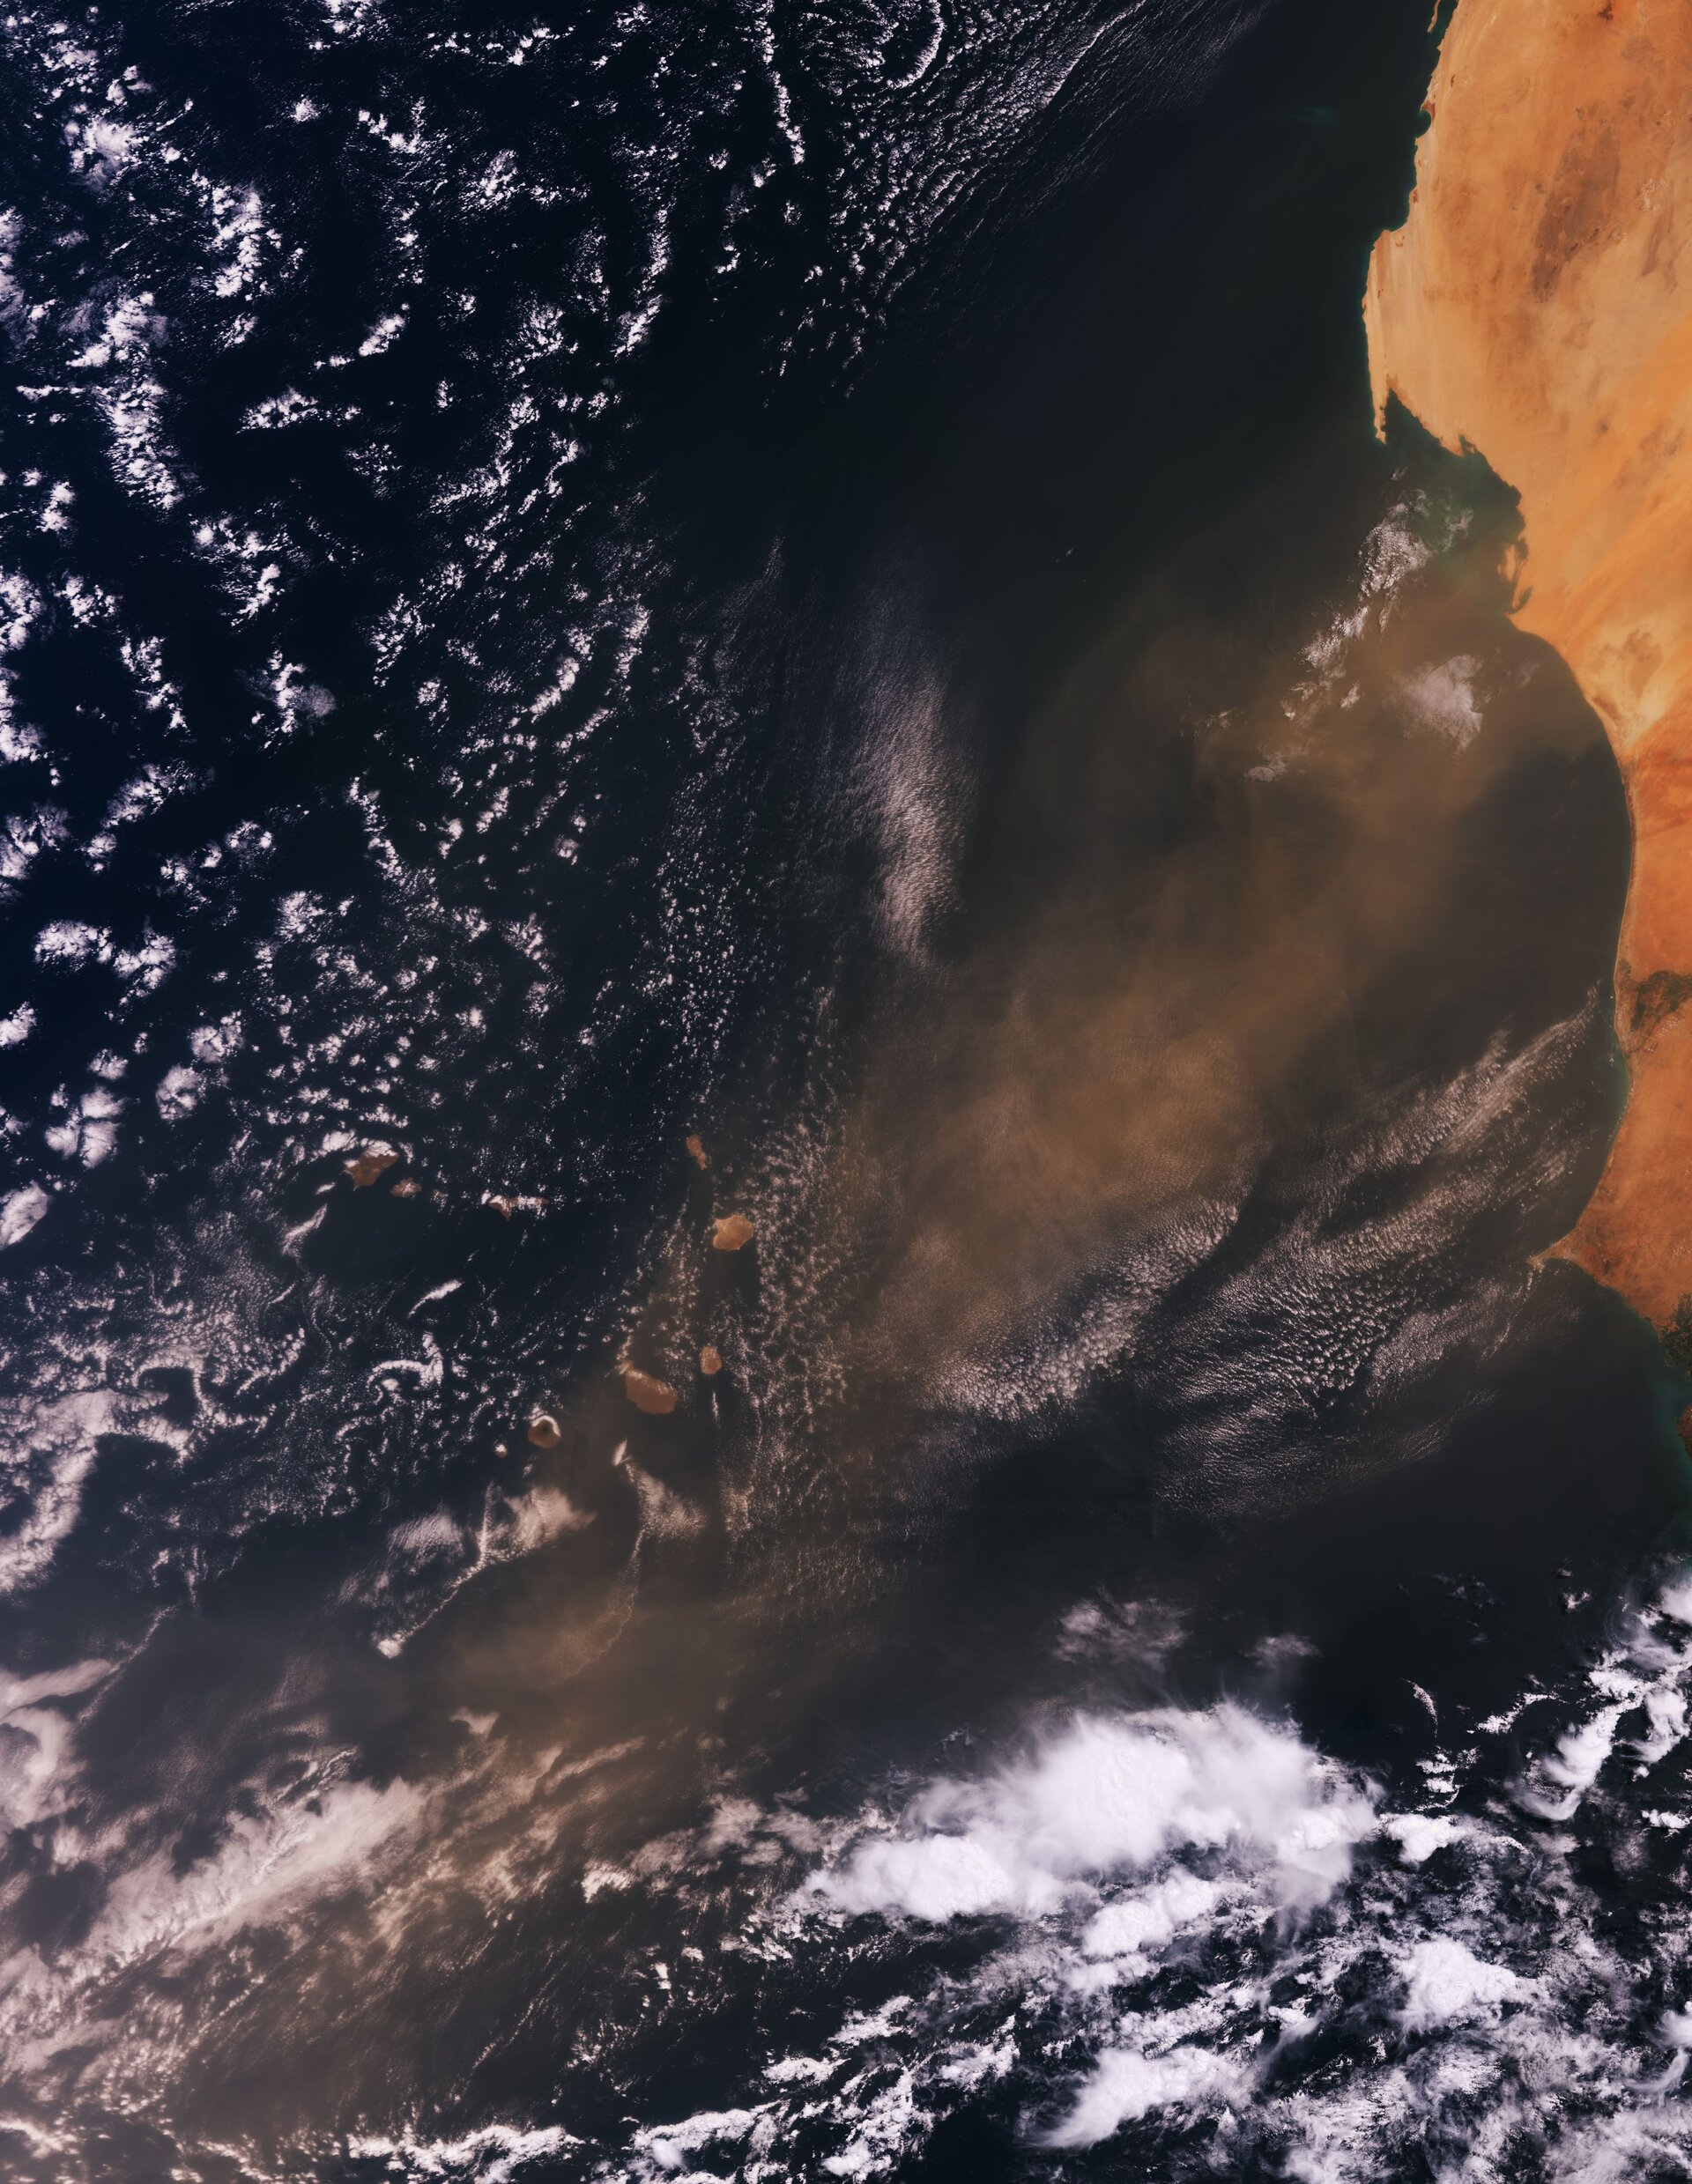
Every summer, the wind carries large amounts of desert dust particles from the hot and dry Sahara Desert in northern Africa across the Atlantic Ocean.
Data from the Copernicus Sentinel satellites and ESA’s Aeolus satellite show the extent of this year’s summer dust plume, dubbed ‘Godzilla,’ on its journey across the Atlantic.
This Saharan dust storm is also known as the Saharan Air Layer, which typically forms between late spring and early autumn, peaking in late June to mid-August.
Large amounts of dust particles from the African desert are swept up into the dry air by strong winds near the ground, as well as thunder storms.
The dust can then float for days, or weeks, depending on how dry, fast and turbulent the air masses become.
Winds in the higher troposphere then sweep the dust across the Atlantic Ocean towards the Caribbean and the United States.
Although this meteorological phenomenon occurs every year, the June 2020 plume is said to be unusual owing to its size and the distance travelled.
According to NOAA’s Atlantic Oceanographic and Meteorological Laboratory, the dust plume was around 60—70% dustier than an average outbreak – making it the dustiest event since records began around 20 years ago.
The Copernicus Sentinel-5P mission is dedicated to monitoring air pollution by measuring a multitude of trace gases as well as aerosols.
This animation shows the spread of aerosols from the Saharan dust plume moving westward across the Atlantic Ocean from 1 June to 26 June 2020.
This plume has reached the Caribbean, South America and the United States.
The animation above shows the spread of aerosols from the Saharan dust plumes moving westward across the Atlantic Ocean from 1 June to 26 June 2020.
Normally, Saharan dust plumes disperse in the atmosphere and sink into the Atlantic before reaching the Americas.
However this year, the dense concentration of dust travelled approximately 8000 km and can be seen arriving near the Caribbean and the southern United States.
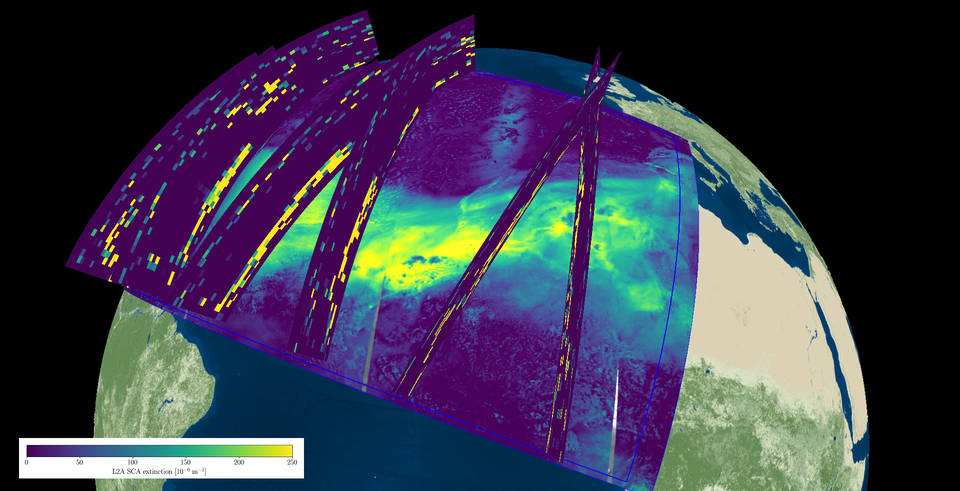
The composite image below shows combined observations from the Aeolus satellite and the Copernicus Sentinel-5P satellite on 19 June 2020.
The underlying Sentinel-5P aerosol index in florescent yellow and green, which indicates the extent of the elevated Saharan dust plume over the Atlantic, has been overlaid with Aeolus’ aerosol and cloud information.
Aeolus data provides valuable information regarding the altitude and vertical extent of the aerosol layer, compared to downward-looking imagers, as it can determine the height at which the dust layer is travelling.
Aeolus data in this image indicates that most of the dust was 3—6 km above the ground.
These data are extremely important for air-quality models used by, for example, the Copernicus Atmosphere Monitoring Service, to predict how far the dust layer will travel and how it develops and therefore the effects it will have locally.
Different satellites carry individual instruments that provide us with a wealth of complementary information.
While the Copernicus Sentinel-5P satellite maps a multitude of air pollutants around the globe, Aeolus is the first satellite mission to acquire profiles of Earth’s wind on a global scale.
As shown here, Aeolus also delivers information about the vertical distribution of aerosol and cloud layers.
This combination of satellite data allow scientists to improve their understanding of the Saharan Air Layer, and allows forecasters to provide better air quality predictions.
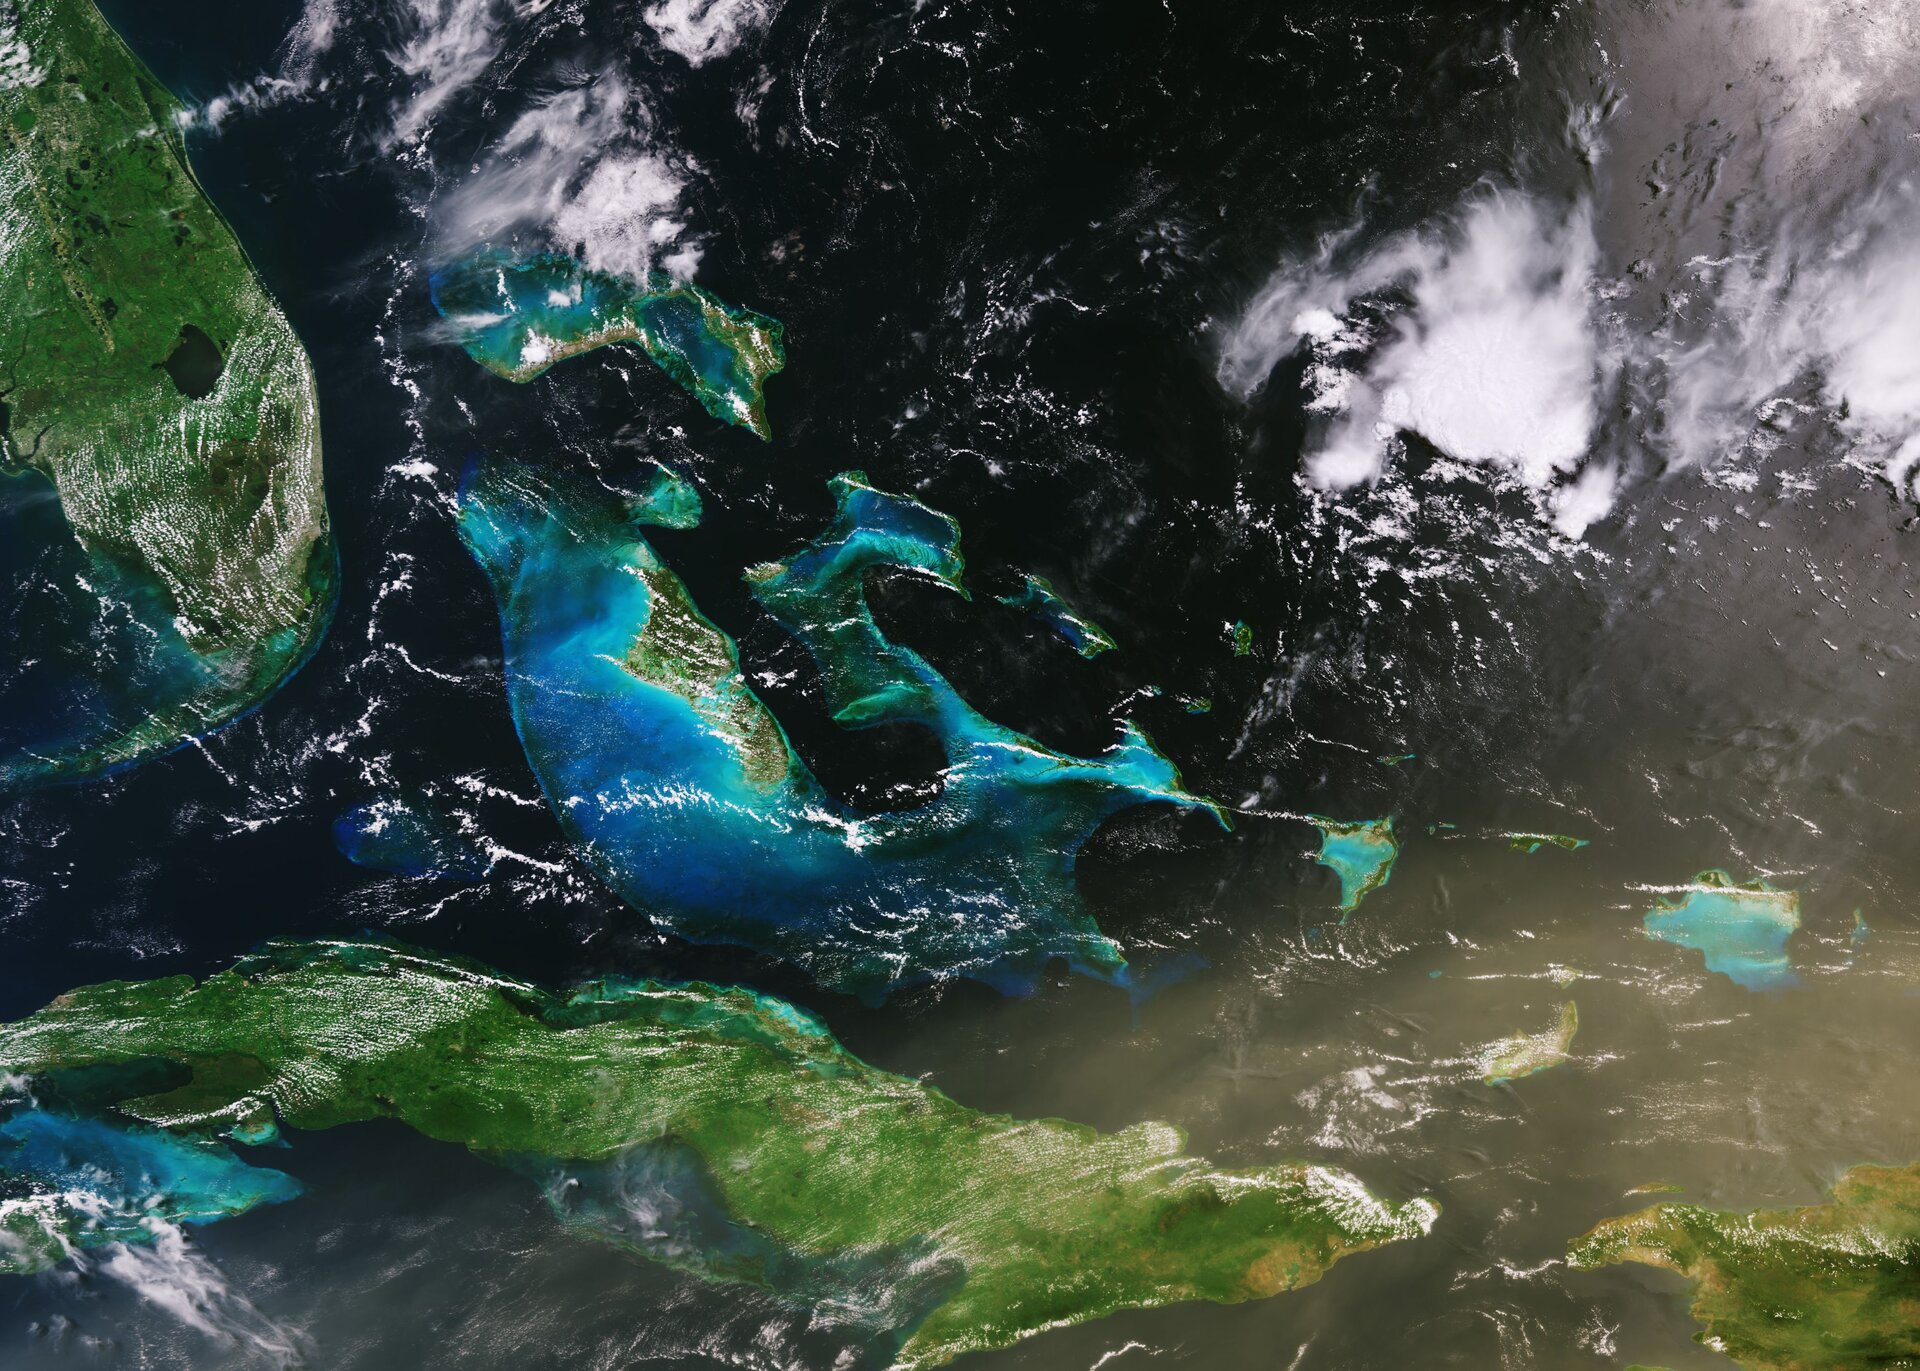
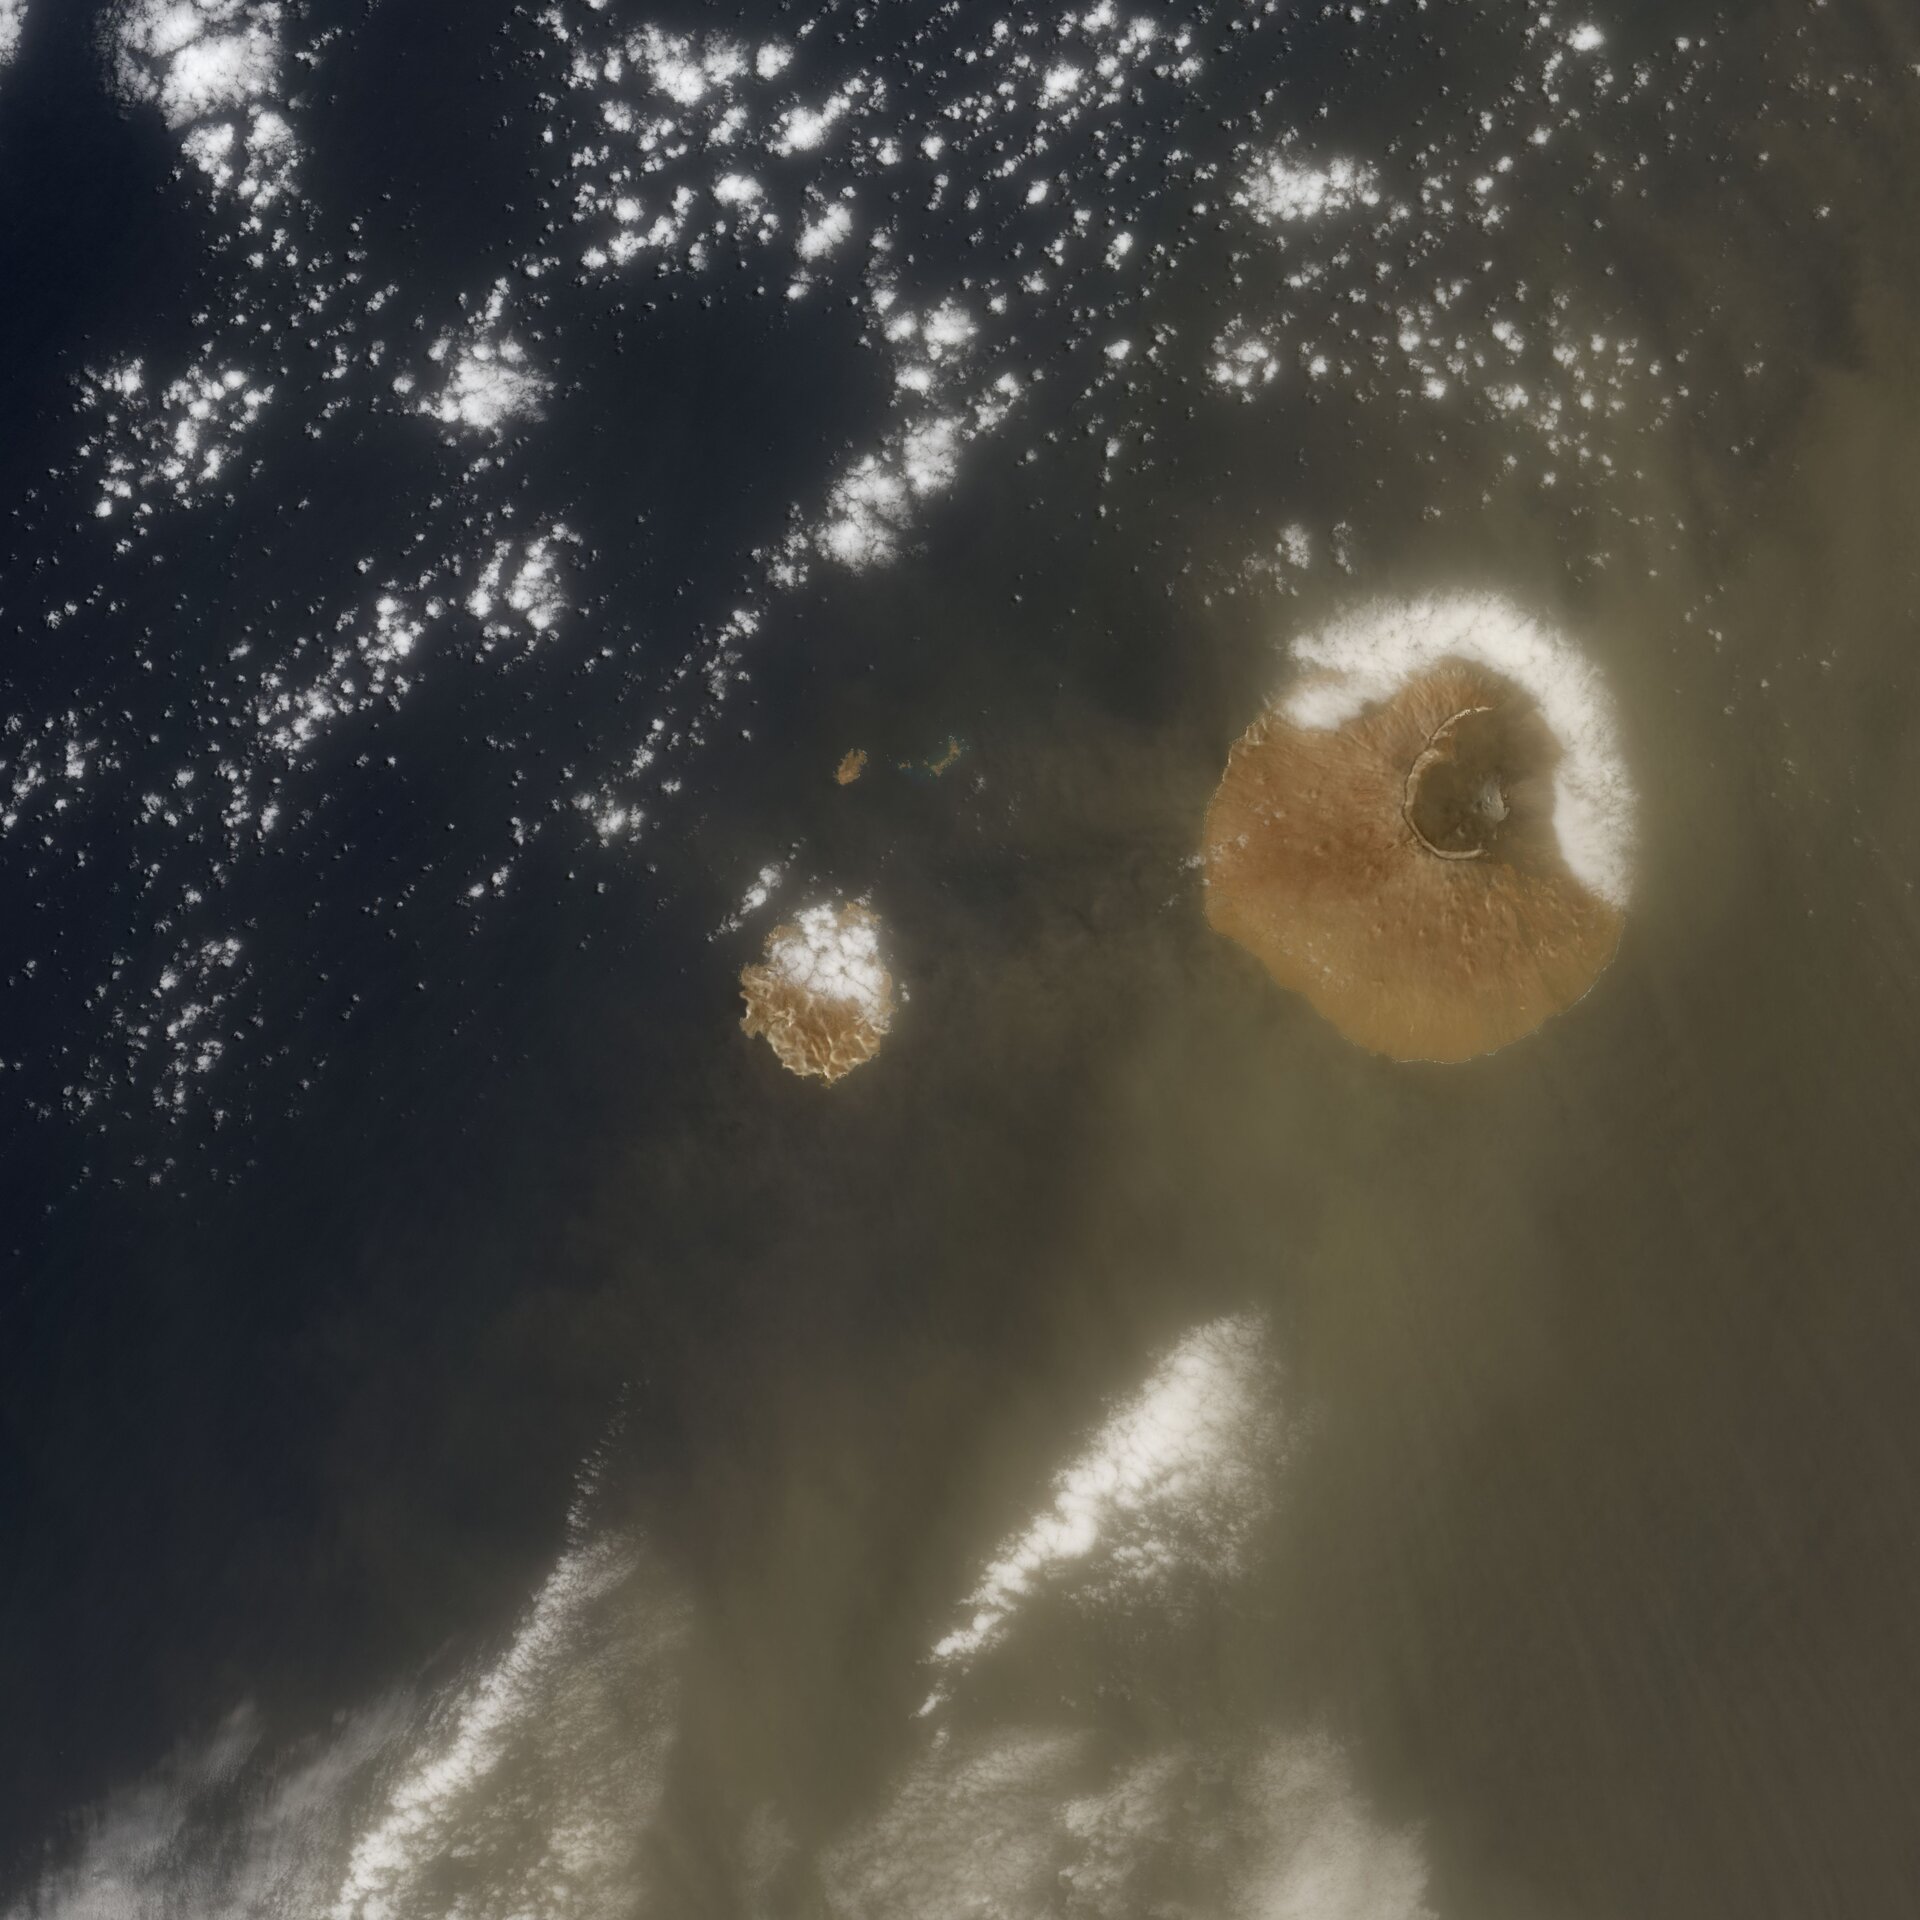
The images below, captured by the Copernicus Sentinel-2 and Sentinel-3 missions, show the dust particles over Cabo Verde, Boa Vista, Cuba and Sao Filipe.
While the dust poses a threat for our health, causing hazy skies and triggering air quality alerts, the travelling Saharan dust plays an important role in our ecosystem.
The dust is a major source of nutrients which are essential for phytoplankton – microscopic marine plants that drift on or near the surface of the ocean.
Some of the minerals from the dust falls into the ocean, triggering blooms of phytoplankton to form on the ocean surface, which in turn provides food on which other marine life depends.
The dust is also essential for life in the Amazon.
It replenishes nutrients in rainforest soils – nutrients that would otherwise be depleted by frequent rainfall in this tropical region.
The dry and dusty air layers have also been shown to suppress the development of hurricanes and storms in the Atlantic.
Tropical storms need warm ocean waters and warm humid air in order to form.
If a storm were to develop, it would collide with the dusty and dry layers of air of the Saharan dust cloud, preventing it from growing further.
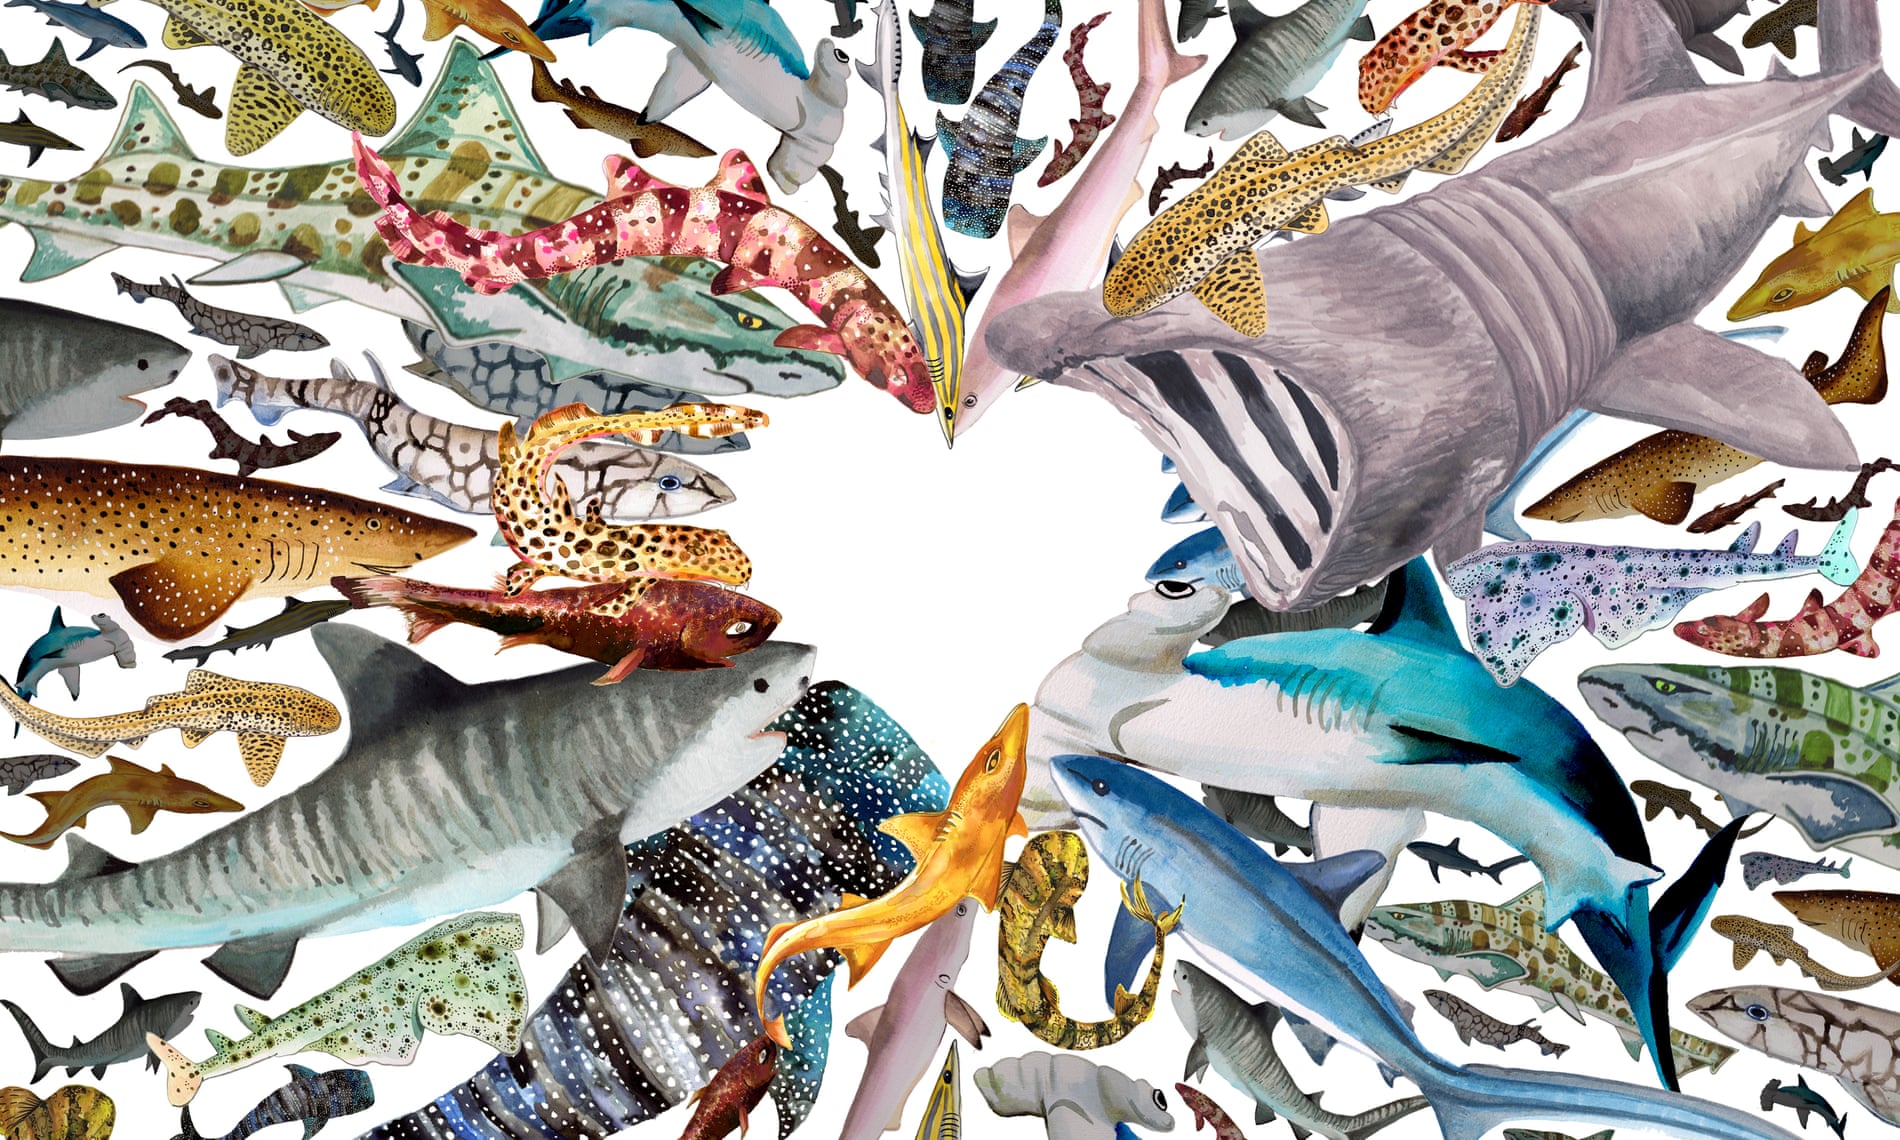
There are more than a thousand known species of shark. Mysterious and often misunderstood, the shark family is magically
diverse – from glowing sharks to walking sharks to the whale shark, the
ocean's largest fish. But these magnificent animals very rarely threaten
humans: so why did dolphins get Flipper while sharks got Jaws? Sharks
are increasingly considered, like whales, to play a crucial role in
ocean ecosystems, keeping entire food chains in balance – and have done
so for millions of years. But these apex predators are now in grave
danger. The threats they face include finning ( in which their fins are
sliced off before they are thrown back into the water), warming seas,
and being killed as bycatch in huge fishing operations. To celebrate our emerging understanding of sharks’ true nature and
investigate the many underreported ways in which humans rely on them,
the Guardian is devoting a week to rethinking humanity's relationship
with the shark – because if they are to survive, these predators cannot
be prey for much longer.
Why we need sharks: the true nature of the ocean's 'monstrous villains' There are more than a thousand known species of shark.
Why did dolphins get Flipper while sharks got Jaws?
These majestic, diverse animals bring balance to the ocean ecosystem – and they’re in grave danger
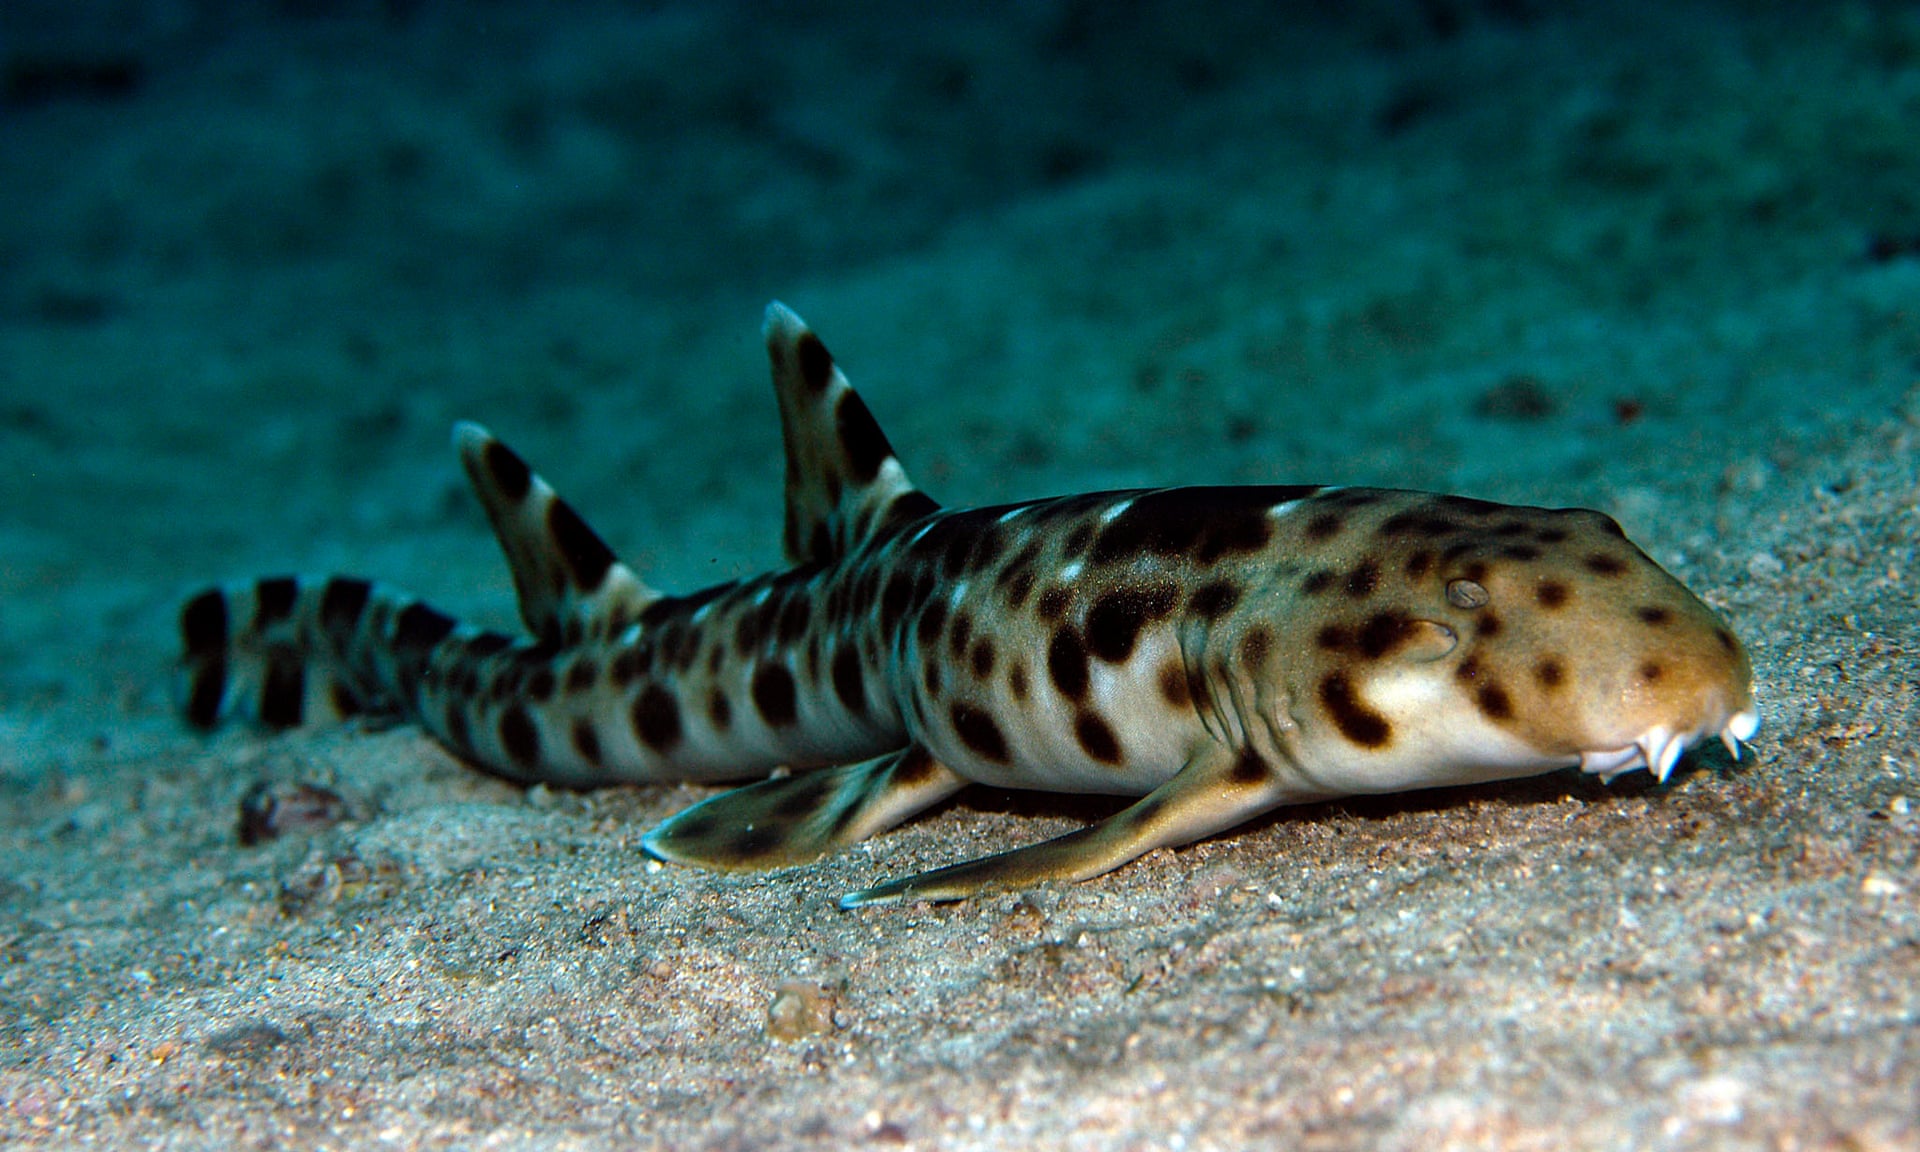
Each day, as the sun sets over the coral-fringed Raja Ampat Islands in Indonesia, an underwater predator stirs.
As predators go, it’s not especially big or ferocious – an arm’s length from head to tail, with a snuffling, moustachioed snout.
Cristina Zenato needs only two words to describe sharks—nature’s masterpiece. A professional diver in the Bahamas, she loves sharks.
Especially the Caribbean reef sharks that flourish around Grand Bahama Island thanks in large part to her efforts to protect them.
The sharks swim right up to the woman known as the Shark Dancer and nuzzle against her while she pets them like they’re dogs or cats.
We take a dive off Grand Bahama Island with Zenato to learn how she built such a strong bond with these beautiful creatures.
What’s unique is that it doesn’t so much swim along the seabed as walk.
Using its four fins as legs, and twisting its spine like a lizard, it can emerge from the water and hold its breath for an hour, strutting across the exposed reef and clambering between tide pools to find prey.
It’s a walking shark, and far from the stereotypical view of these baleful beasts, it tells an alternative story of how sharks look and live.
Biologists recently confirmed there are nine species of walking sharks.
They are the ocean’s newest sharks – probably only 9m years old as a group, with the two youngest species splitting apart less than 2m years ago – challenging the long-held notion that sharks are ancient and unchanging.
They are not evolutionary survivors from bygone eras, but animals that continue to adapt.
The walking shark, the newest species of shark in the ocean.
Photograph: Gerry Allen/Conservation International
The walking sharks themselves are just a fraction of the immense diversity of sharks.
There are bramble sharks and gollumsharks, night sharks and shy sharks, clouded angelsharks and splendid lanternsharks; there are fat catsharks, mouse catsharks, frog, cow and weasel sharks.
In all, more than 500 elasmobranch species are alive today.
One in 10 shark species are bioluminescent: they light up in the dark.
Another is so small you could tuck it in a pocket, and it has little pockets of its own – filled, for an unknown reason, with glowing goo.
Some sharks puff up to look bigger and scarier than they really are.
Mother sharks can be pregnant for three years at a time, or have virgin births.
There are bramble sharks and gollumsharks, night sharks and shy sharks, clouded angelsharks and splendid lanternsharks
But if all you knew about sharks you learned from Hollywood, you’d think they were aquatic horrors.
Sharks have a film genre all their own: there are movies about ghost sharks and zombie sharks, sharks that squirt acid, killer sharks that swim through sand or snow, and a staggering six instalments of the Sharknado film franchise.
Even more problematic is when the more believable films depict sharks as monstrous villains: in 2016, The Shallows featured a female surfer being brutally attacked by a vengeful great white, leading a group of marine scientists to write an open letter to Columbia Pictures warning that the movie was a dangerous mischaracterisation that could keep the tide of public opinion turned against sharks.
Olympic great Michael Phelps races a 'great white shark' on Sunday as part of .
The shark was in-fact a computer simulation rather than a actual great white but its swim speed was calculated using data collected from the real thing.
Phelps finished the 100m course in 38 seconds, two second slower than the 'shark'
In reality, sharks are overfished in their millions.
They aren’t adapted to being prey, rather than predator: sharks grow slowly, spending ages as teenagers before reaching maturity; they lay few eggs and give birth to few pups, not enough to replenish dwindling populations.
Those that stay alive can spend decades, even centuries, absorbing man-made pollutants and plastics.
Individual sharks have seen their world become hotter and more acidic in their lifetime: Greenland sharks swimming around today were born when the Arctic Ocean was several degrees cooler.
The upshot of all this is bleakly predictable.
At last count, a quarter of all sharks and their flattened cousins, the rays, were found to be threatened with extinction.Q&A
Sharks matter to humanity.
Much is lost when they vanish from the seas.
“There’s a lot we can learn from sharks,” says Jasmin Graham, shark biologist and project coordinator of MarSci-Lace at Mote Marine Laboratory in Florida, where researchers are investigating how sharks quickly heal wounds and how they evolved immunity to many diseases.
“If they’re not here, then that evolutionary history, that information, is lost.” At the 2008 Beijing Olympics, swimmer Michael Phelps won eight gold medals wearing a suit inspired by the tiny, toothlike denticles in sharks’ skin that reduce drag and boost their speed.
(The suits were later banned after studies revealed that they trap air bubbles, helping swimmers float.)
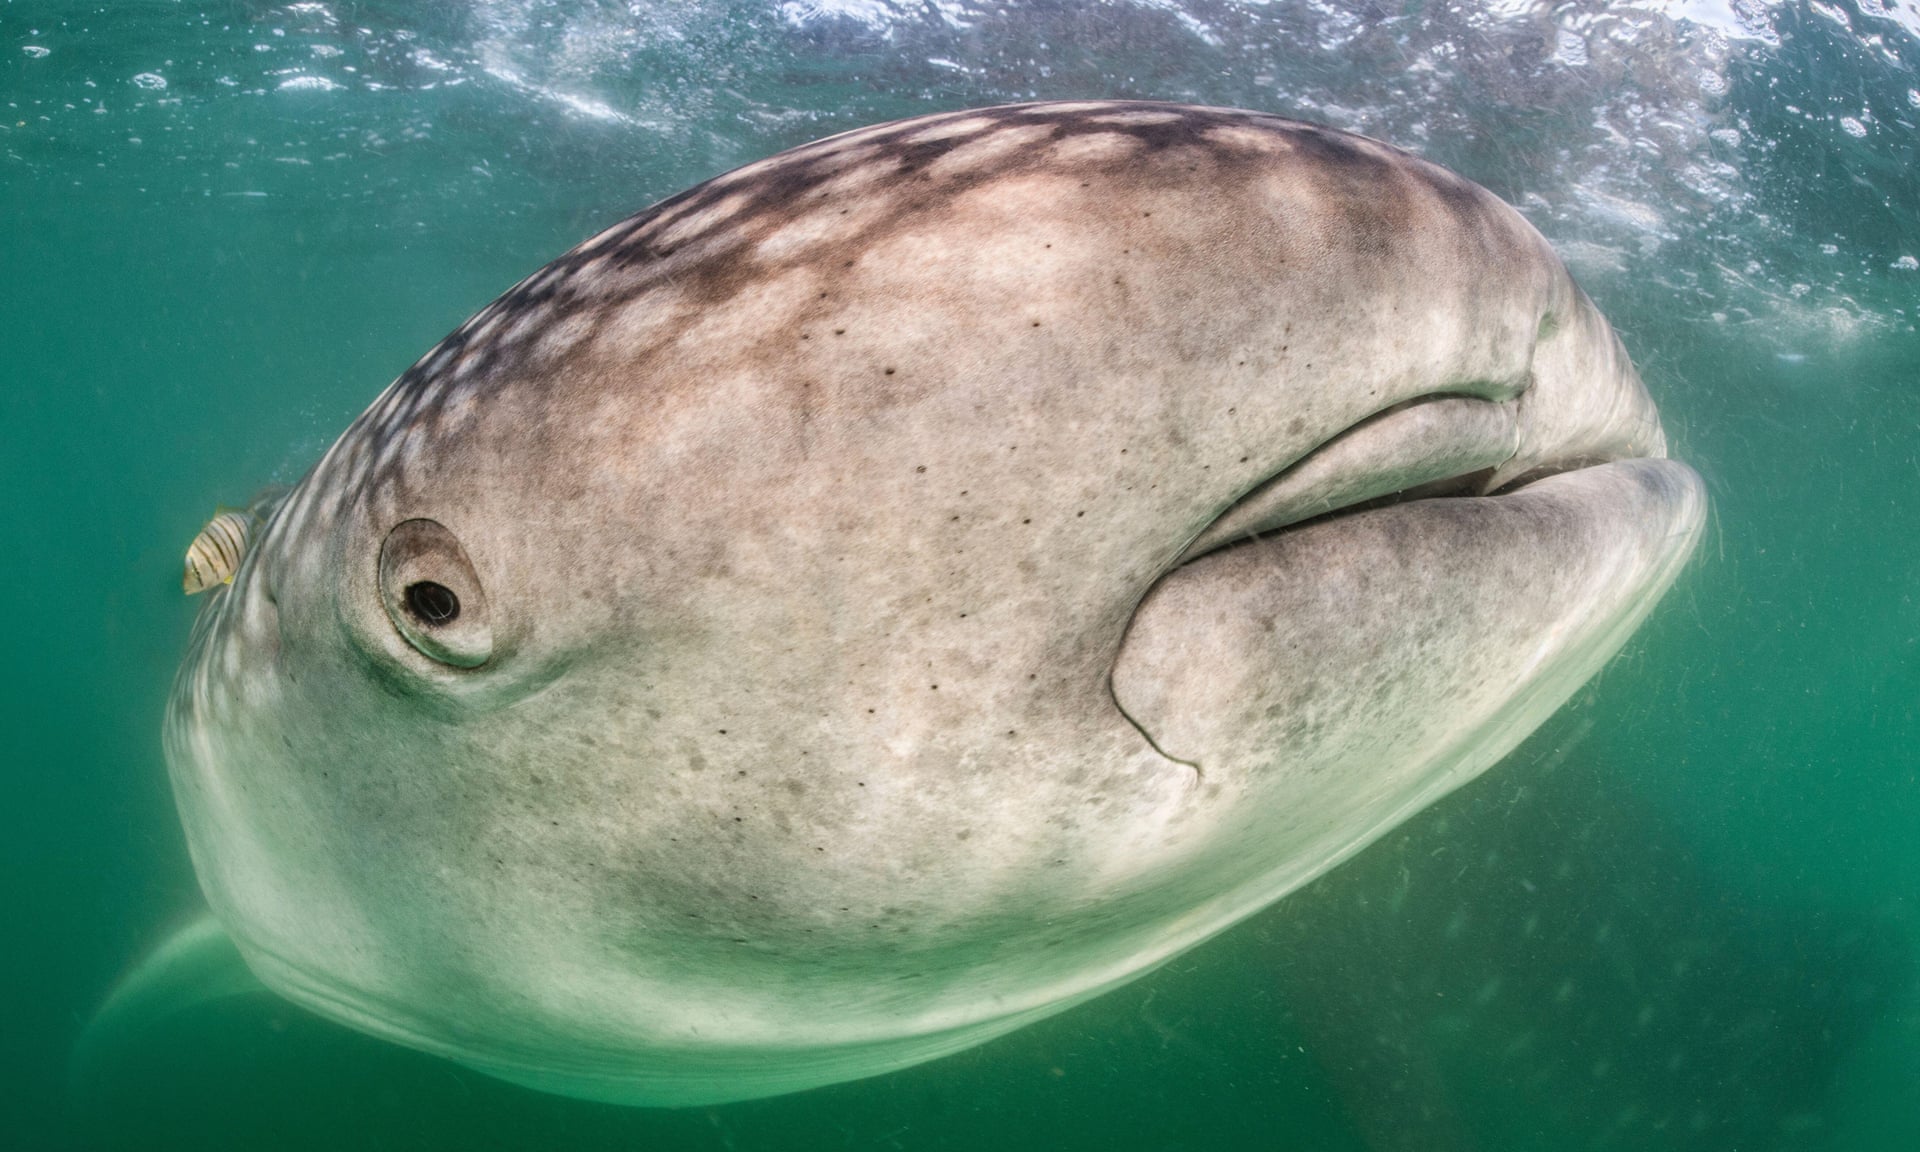
Whale sharks, the largest fish in the sea, scoop up tiny plankton as they travel.
Photograph: Nature Picture Library/Alamy
Sharks matter not just because they can be useful for humans, however, but entire ocean ecosystems.
“Lots of shark species have been shown to be keystone predators,” says Graham.
“They maintain balance in ecosystems and keep things in order, removing weaker, sicker prey and stopping any single species from exploding in numbers and taking over.” One study comparing remote islands in the Central Pacific showed that when sharks are fished out, coral reefs can become dominated by small fish and overrun by algae.
“We don’t understand until we lose the species how important it was,” says Graham.
Sharks maintain balance in ecosystems and keep things in orderJasmin Graham, shark biologist
We need to talk about sharks.
Though no sharks have yet gone the way of the dodo, plenty of species are lined up for imminent extinction.
And the loss of sharks is not just about species blinking out, but a diminishment from their former abundance.
Just like the erasing of native fauna from the continents – of bears and wolves, tigers and lions, koalas and kakapos – so the oceans are now losing their sharks.
The only difference is that their dying out mostly goes unnoticed.
In more than 20 years of diving and researching the oceans I’ve had many encounters with wild sharks, each one a moment to treasure and note in my dive logbook.
I used to feel adventurous when family and friends asked me if I was scared to dive with sharks.
(No, never.) But increasingly, as the question keeps being asked, it unsettles me – that so many people still think this way.
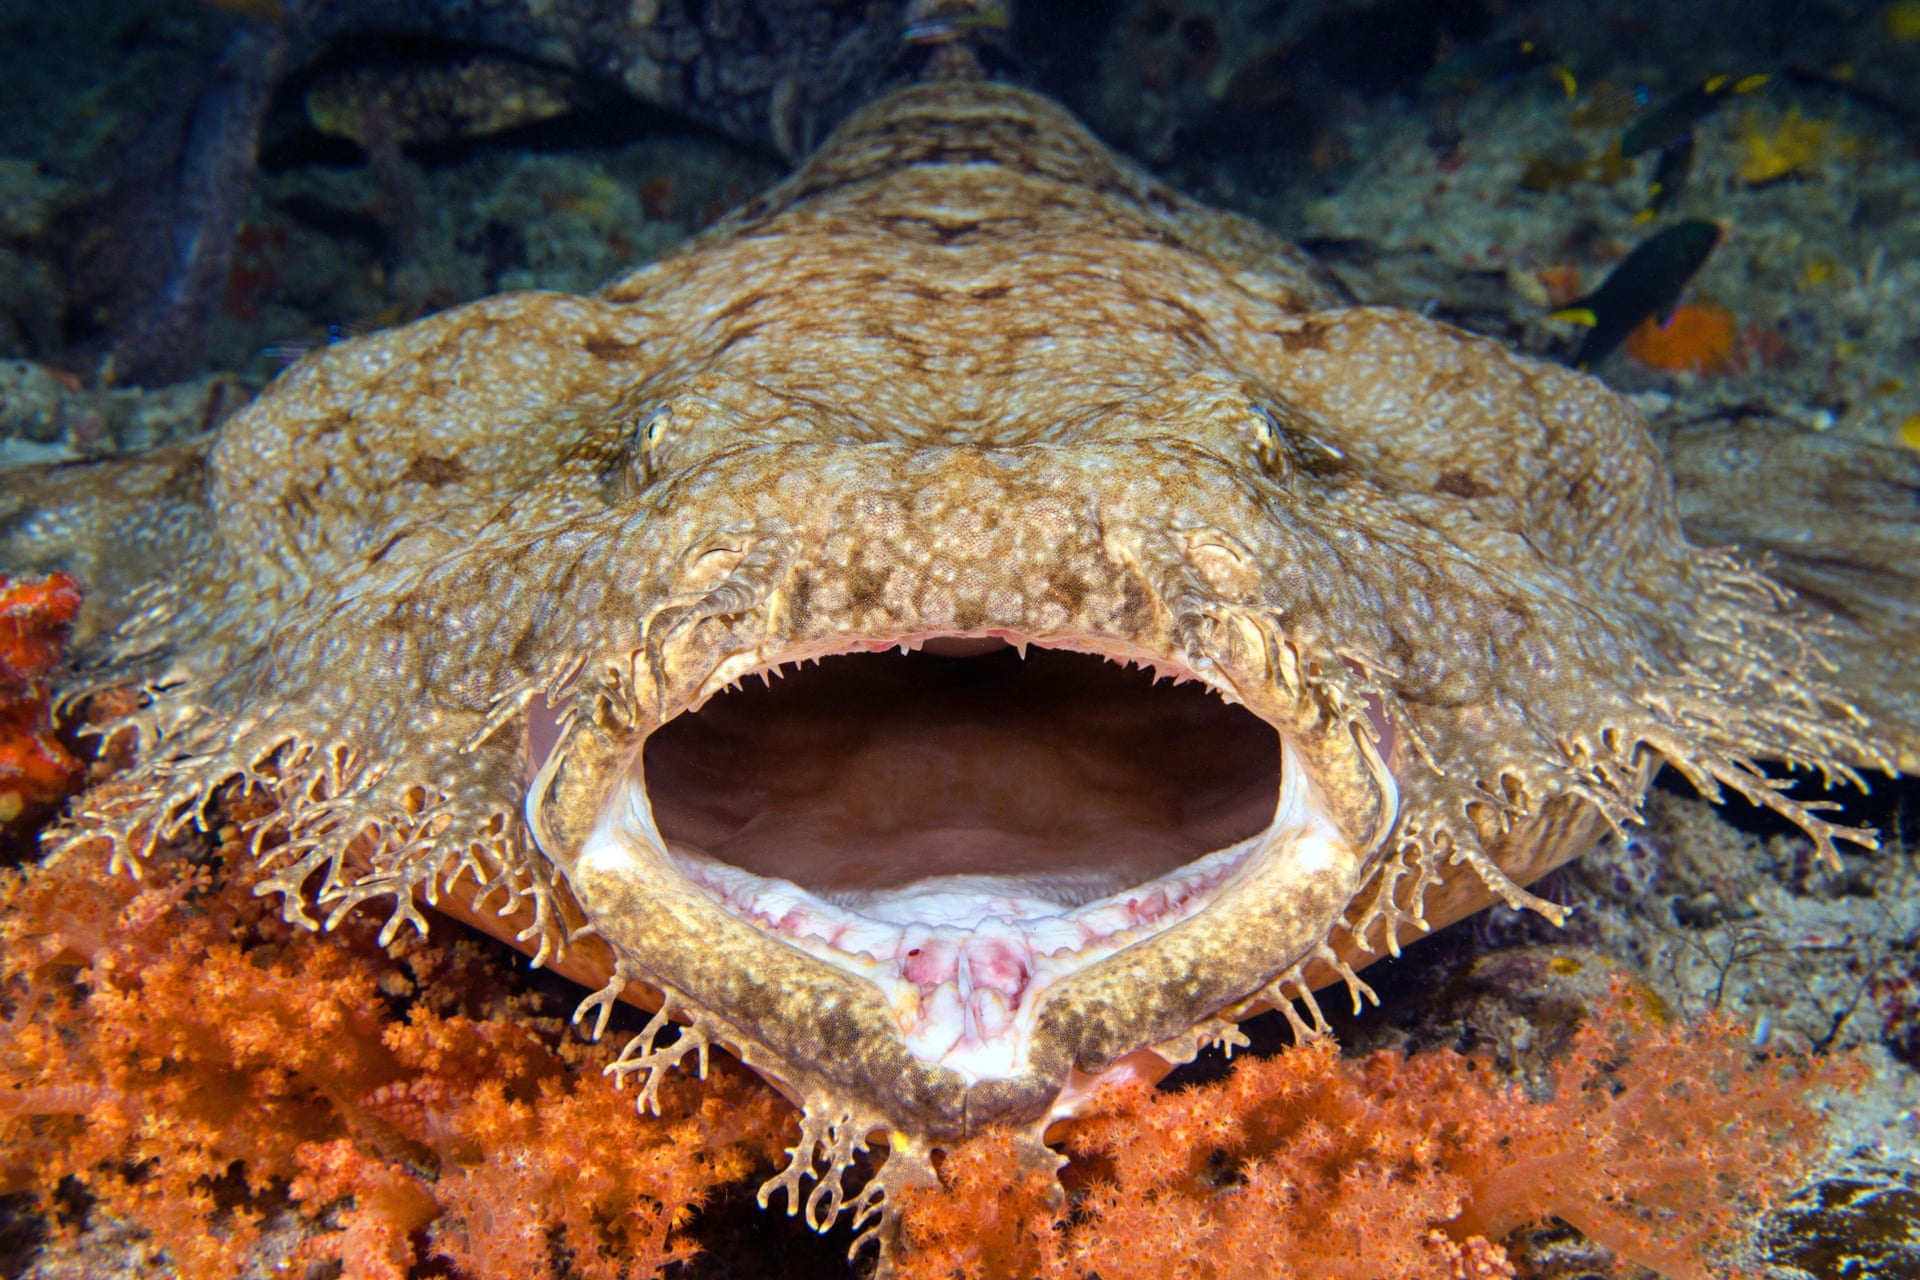
Tasseled wobbegong shark among coral off the coast of West Papua, Indonesia.
Photograph: Nature Picture Library/Alamy
For years, scientists and conservationists have been saying that sharks have more to fear from humans than we have from them.
Pick whichever statistic you like best of things far more likely to kill you: a toppling vending machine, a falling coconut.
Still there’s this lingering idea that sharks are dangerous, vindictive and brutal.
Fear is certainly not being deliberately stoked by the very few people who’ve been attacked by sharks, many of whom, despite losing limbs, have become outspoken advocates for shark conservation.
Marine biologist Ocean Ramsey shares exclusive video (Januay 2019) of her and her team of divers’ encounter off the coast of Hawaii with what could be the largest great white shark on the planet.
“As a kid, I saw Jaws, and I wasn’t particularly scared of it,” says Graham.
“I was just asking why? Why do people think that they’re so scary? How are they different from a dolphin? They’re both predators.
Why did the sharks get a bad rep and dolphins got to have Flipper?”
These majestic animals are doing much worse worldwide than they were back in 1975 when Jaws was released.
They need all the positive publicity they can get.
New stories need to be told about sharks – the big ones and small ones, the ones that walk and glow, and all the other things they can be.
With the improved accuracy and integrity of un-augmented GPS over the last several years, and with the introduction of the U.S.
operated satellite-based augmentation system known as Wide Area Augmentation System (WAAS), the maritime community no longer has a mission requirement for DGPS.
GPS now provides sufficient positional accuracy to meet international navigation requirements for harbor approaches and to position Federal Aids to Navigation (ATON).
The Global Positioning System is a U.S. government owned utility that is now ubiquitous, and provides users with free, highly accurate positioning, navigation, and timing (PNT) services.
GPS technology can be found in cell phones and watches, shipping containers, and ATMs.
It is essential for all forms of navigation, farming, surveying and construction, banking and the financial markets, and the power grid.
In its earlier iterations the information GPS provided was not accurate enough for some applications, including the Coast Guard's positioning of marine aids to navigation.
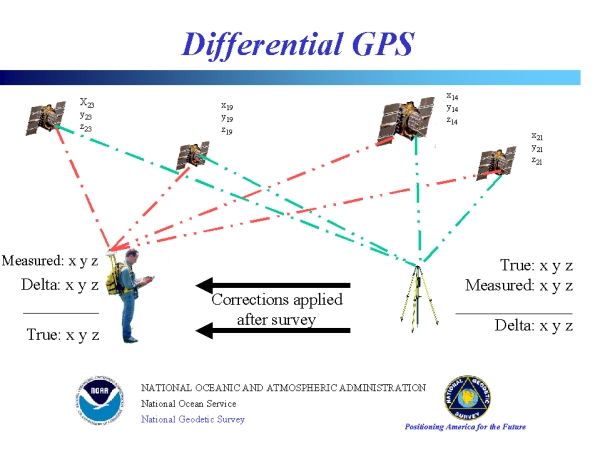
To solve this problem, in the late 1980's and early 1990's, the Coast Guard established the Maritime Differential GPS System to augment the existing GPS signal with accuracy corrections and integrity monitoring by broadcasting over Medium Frequency from terrestrial broadcast sites.
The correction brought GPS position accuracy from several meters to less than one meter.
"The process includes the installation of navigation at a precise known location, which receives the GPS signal and compares the position solution from received signal to its known location.
This result of this comparison is then generated in the form of a correction message and sent to local users via a radiobeacon broadcast.
The received correction is applied by the user's GPS equipment to reduce the system position error, thereby improving the user's absolute accuracy.
This effort was coordinated through the Special Committee (SC) 104 created by the Radio Technical Commission for Maritime Services (RTCM)," wrote Gene W. Hall Lt. Cmdr., USCG Differential GPS Navigation Service, in 1996.
The solution caught on, and the use and availability of DGPS expanded beyond Coast Guard missions.
In its heyday, DGPS operated by the Coast Guard, Department of Transportation (DOT), and the Army Corps of Engineers (USACE), broadcast corrections from 85 sites that covered the nation from coast to coast, out to 50 nautical miles offshore.
Coverage also included the Great Lakes, Hawaii, Alaska, Puerto Rico and the U.S. Virgin Islands.
DOT and USACE have already discontinued the inland DGPS component.
The Coast Guard has operated the remaining Nationwide DGPS service, consisting of one control center and 38 remote broadcast sites, through its Navigation Center in Alexandria, Va.
The phased shutdown of those 38 sites began in 2015 and concluded on June 30, 2020 by turning off the signal from the final four sites located in the Great Lakes and the St. Lawrence Seaway.
What is the role of satellite observations in weather forecasting?
Satellite observations make a crucial contribution to the quality of today’s weather forecasts.
Their global coverage means that they provide information on the atmosphere, the land surface, the ocean and sea ice that can’t be provided by in situ measurements.
Through a process called data assimilation, they help to produce the best possible estimate of the current state of the Earth system.
That estimate, called the analysis, is used as the initial conditions on which weather forecasts are based.
In addition, satellite data help to monitor the quality of forecasts and to identify and remedy deficiencies in the Earth system models used in weather forecasting.
What types of satellite observations are there?
Satellites carry passive instruments, which measure radiation emitted naturally, and active instruments, which send out signals and measure the backscatter.
Natural radiation contains information on, for instance, temperature, humidity, clouds and surface conditions.
It can also provide information on winds by tracing motions of humidity or cloud features in successive observations.
Active instruments use radar or lidar to probe the surface, clouds and winds.
Radio occultation observations are unique in that they involve sending signals from one satellite to another.
The bending angle of such signals crossing the troposphere or stratosphere depends on temperature and humidity.
How has the use of satellite observations at ECMWF evolved?
ECMWF’s use of satellite data has greatly increased over the last few decades.
Today such data collectively make the biggest contribution to forecast quality at ECMWF compared to other types of observations, such as weather station or aircraft data.
Satellite observations do not measure variables such as temperature or ocean wave height directly.
Instead, they measure quantities linked to these variables, such as radiances or radar echoes.
ECMWF has come to play a leading role in extracting the maximum amount of information from such observations.
How are radiances assimilated into ECMWF’s Earth system model?
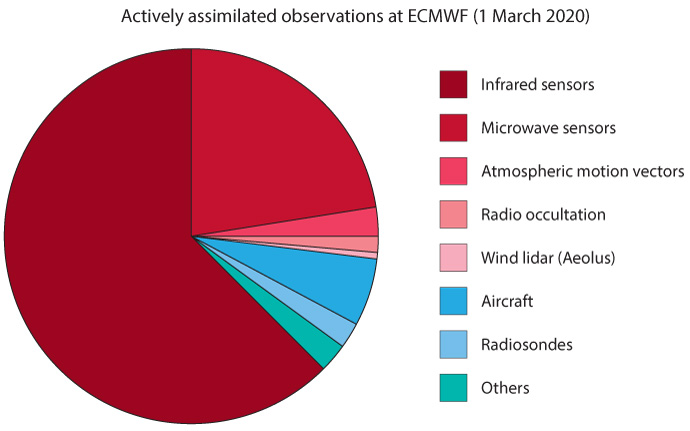
Currently the vast majority of satellite data used at ECMWF come from passive instruments measuring infrared or microwave radiances.
Such radiances typically reflect conditions in a rather deep layer of the atmosphere and could be the result of any number of atmospheric states.
To be able to compare the observations with the state of the atmosphere in the forecasting model, we need to know what radiances would be observed if the model state correctly described the atmosphere.
Such simulated radiances are produced by what is known as an observation operator.
By comparing simulated radiances with observed ones, ECMWF’s 4D-Var data assimilation system can work out how the model state needs to be adjusted to pull it more closely towards the observations.
What is ‘all-sky’ satellite data assimilation?
ECMWF has pioneered the use of satellite observations of microwave radiances affected by clouds and precipitation.
Today such all-sky observations are routinely used at ECMWF and make a huge contribution to the quality of weather forecasts.
All-sky assimilation requires a good representation of raindrops, snowflakes and other hydrometeors in the model, and some knowledge of how they affect microwave radiances.
Only then can we successfully simulate the radiances a satellite instrument would measure if the state of the atmosphere corresponded to the model state.
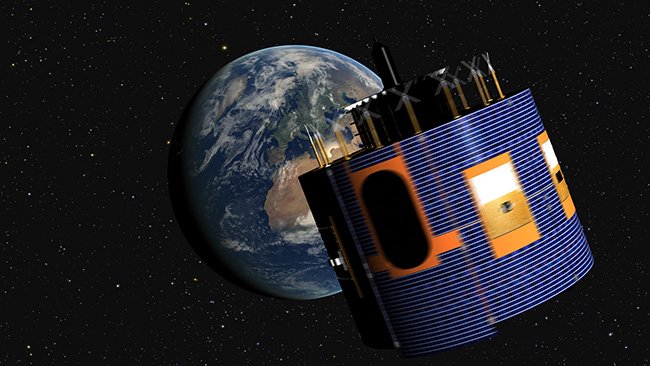
Geostationary
satellites, such as this Meteosat Second Generation satellite, are in
orbit nearly 36,000 km above the Earth’s equator.
What are the main areas of research in satellite data assimilation at ECMWF?
Active areas of research include the development of techniques to fully exploit hyperspectral infrared instruments, which have many thousands of channels; all-sky assimilation for infrared radiances; the use of more of the information that satellites provide on the wider Earth system, such as surface conditions, the ocean and atmospheric composition; and the treatment of random and systematic errors in satellite observations.
In addition, the Centre works on new generations of instruments with partners such as ESA and EUMETSAT in Europe and similar agencies in Japan, the US and China.
ECMWF has, for example, begun to assimilate Doppler wind lidar observations from ESA’s ground-breaking Aeolus satellite, and it is preparing the ground for the assimilation of cloud profile observations from the EarthCARE mission planned by ESA and the Japan Aerospace Exploration Agency (JAXA).
HMT Empire Windrush arrives at the Port of Tilbury on the River Thames on 22 June, 1948.
Visible
just right of centre is the anchor a team of campaigners and scientists
hope to raise from the ship – which sank in 1954 – as a monument to the
generation it helped establish in Britain.
The mission to raise the anchor from a shipwreck – as a monument to the generation it brought to Britain
Carrying migrants to Britain for a new life, the Empire Windrush gave its name to a generation – and later, a scandal.
This is the story of a ship, the people it carried, and a new plan to make a monument from its most iconic symbol.
WHEN the passenger liner HMT Empire Windrush docked at Port of Tilbury on the River Thames in June 1948 with hundreds of Caribbean immigrants aboard, it was a key moment in the establishment of multicultural Britain.
The vessel later came to symbolise the scandalous way in which the government treated many of the so-called Windrush generation – who celebrate a day of recognition on June 22.
The ship itself now lies 2,800 metres down at the bottom of the Mediterranean Sea, 23 nautical miles off the coast of Algeria.
In 1954 it caught fire while en route to the UK, and – after all but four of those aboard had been rescued – it sank.
Now a piece of it may be about to return to the surface in a bid to symbolise the winds of change the ship ushered to British shores over 70 years ago.
Empire Windrush passengers inbound from Commonwealth territories in the Caribbean included those answering calls for work, ex-servicemen and women, and children – many of whom travelled on their parents' passports.
Despite their right to remain, due to immigration law tightening and the government destroying the landing cards of passengers in 2010 many who arrived as part of the first wave were unable to prove legitimate UK citizenship in later life.
This became known as the Windrush scandal.
PHOTOGRAPH BY ALAMY
The story of a ship
When it comes to symbols of migration, few conveyances have been quite so mythologised as the Empire Windrush – a remarkable turn of fortune given the ship's former duties.
Built in 1930 by builders Blohm & Voss, it was originally a German liner named the M.V.
Monte Rosa.
As part of Germany's Hamburg Sud line, its first years saw it give many Germans trans-Atlantic passage to a new life in South America, escaping the economic depression in their homeland.
As National Socialism began to take root in Germany, it was recruited as a propaganda vessel to showcase the ideology of Nazism, with cruises to Scandinavia and the Mediterranean.
Then, as the Second World War began to rock Europe, its festive colours were repainted grey, and the Monte Rosa became a ship of war.
According to Paul Arnott in his book Windrush: A Ship Through Time, the vessel's trajectory turned into darker waters during the war years.
Used as a troop carrier, it brought German ground forces to Scandinavia, at one point supporting and resupplying the infamous battleship Tirpitz – Hitler's ‘beast’ – as it strafed the Norwegian coast to deter Allied attacks.
Then in October 1942, the ship that would become the Empire Windrush was one of two carrying Jews deported from Nazi-occupied Norway to Hamburg – from where they were transported to the gates of Auschwitz, and murdered.
Video: The Empire Windrush arrives at Tilbury, 1948
By the end of the war the Monte Rosa had become a hospital ship, and was seized by the Royal Navy at Kiel on the north German coast.
Sailed to the shipyards of Glasgow, it was re-fitted as a British troop transport – and given the name that would resonate through history.
The first wave
Between 1945 and 1948 the Empire Windrush was used as a Navy transport, repatriating British soldiers home from former theatres of war such as India and Greece.
Then in May 1948, it sailed to the Caribbean – calling at Trinidad, Jamaica, Tampico, Cuba and Bermuda before returning to Tilbury, in Essex on June 22.
Aboard was what would become known as the 'first wave' of Windrush migrants – some 500 mostly Jamaican and Trinidadian workers and their families who, as part of the Commonwealth, were entitled to live in Britain.
Also on board were some 66 Polish migrants who had spent much of the war in Mexico.
These too were bound for a new life in Britain under Churchill's Polish Resettlement Act, which acknowledged the contribution of Polish soldiers and intelligence to the Allied war effort.
On paper, they were both welcome and needed: a personnel gap created by the war had created a vacuum of skilled workers needed to rebuild the country's industry and economy.
But for many of the arrivals on the Empire Windrush that June – and the tens of thousands who arrived from Commonwealth territories all over the world by other means between 1948 and 1973 – the environment they arrived into wasn't the welcome they had hoped for.
As the migrants' contribution to the economy began to become evident, attitudes began to change – with some employers, including the NHS, recruiting proactively and directly from the Caribbean.
Some even paid for the migrants' fares, usually recouped through wages.
The communities born from this wave of migrants, and their influence on the arts, education and culture has in the years since been unanimously hailed as a watershed moment in the diversification of British culture.
Scandal and betrayal
The so-called Windrush scandal began to emerge in late 2017. Under a 2012 policy employers, landlords and financial institutions had been encouraged to create what then-Home Secretary Theresa May described as a 'hostile environment' for those attempting to live in the UK illegally.
A government ruling in 1971 had entitled any Commonwealth citizen currently living in Britain indefinite leave to remain – in short granting rightful citizenship to those who had arrived and settled as part of the Windrush generation.
But the 2012 policy – an attempt to reduce annual net migration to 100,000 – potentially affected anyone who couldn't provide documentation stating right-of-residency.
This meant Windrush children who had travelled to the UK under the passports of their parents – some of whom who had lived in Britain for upwards of 50 years – were challenged to prove their immigration status was legal.
The consequences wrecked lives.
Citizens unable to prove legitimate citizenship found their rights eroded.
These privations included access to healthcare, legal representation, or housing.
Some who had lived in Britain legally for most of their lives lost jobs, their homes – or faced deportation back to countries they had no memory of.
The Evening Standard of June 21 1948 carried a story and image relating to the Empire Windrush's arrival in Britain under the headline 'Welcome Home.' Not all branches of the media were as welcoming, and many immigrants faced hardship and discrimination on arrival. Photograph by John Frost Newspapers / Alamy
‘Added poignancy’
Now there’s a new chapter in the Windrush story.
A group of campaigners plans to locate the wreck, recover the ship’s stern anchor, and return it to the UK as “a fitting monument to multicultural Britain”.
Among them is Patrick Vernon, who was a child of the Windrush generation, maritime archaeologist Jessica Berry, and shipwreck hunter David Mearns.
Provided funding is secured, it’s the latter who will lead the search, locate the wreck and bring the anchor to the surface.
“We’ve had all the negative aspects of the Windrush scandal, and now this could become a positive one.” Mearns tells National Geographic.
“If the anchor was a centrepiece of a monument somewhere in the UK, it would be a touchstone for people to visit and literally touch, connecting themselves to that ship and the symbolism of the first wave of Windrush immigrants.”
In an era when Britons are re-examining their public monuments and statues, it would have added poignancy.
Mearns, who runs a Sussex-based shipwreck recovery service called Blue Water Recoveries, is confident he has narrowed down the position of the wreck to a search area of just 36 square nautical miles.
He has analysed the original mayday signals, and the reports from rescue vessels, and from the Royal Navy destroyer that had been towing her when she finally slipped beneath the waves. The search for the ship
“In the grand scheme of shipwrecks, the position is very good,” Mearns says.
“Back in 1954, pre-GPS, you’re still relying on sextants, chronometers, and star and sun sightings.
36 square nautical miles is a small area.
My confidence level is high.”
With decades of experience in hunting for ships and aircraft on the ocean bed, Mearns has good reason to be confident.
A marine scientist and sonar specialist by trade, he has discovered 25 shipwrecks and boasts a 90 per cent success rate.
The more important wrecks include HMS Hood, the Royal Navy battlecruiser sunk by the German battleship Bismarck; Esmeralda, a Portuguese carrack that came to rest off the coast of Oman in 1503; and MV Lucona, a motor vessel sabotaged with a time bomb as part of an insurance fraud.
David Mearns indicates the anchor on the cover of a book about the Empire Windrush. In this most famous image of the ship – at the top of this article – the anchor is clearly visible. Photograph by Dominic Bliss
Although the circumstances of each wreck vary enormously, the methods Mearns uses to locate them share similarities.
The bulk of his time is spent poring over maritime records, researching distress calls, eye-witness accounts from survivors and rescuers, and reports of floating debris.
He is no stranger to government records offices such as the National Archives in London and the National Archives and Records Administration in Washington, D.C.
Personal records are also enormously helpful.
While searching for HMAS Sydney and HSK Kormoran off the coast of Australia, for example, he decoded a dictionary that the captain of the latter had used while in prison to secretly document the original sea battle.
“The stuff of World War II movies like The Great Escape,” is how Mearns describes it.
Using his training in oceanography, he hunts for clues in weather reports, ocean currents, and the positions, speeds and bearings of ships at the time they are damaged.
A process called reverse drift analysis allows him to analyse the position of wreck debris or life-rafts, for example, and calculate where the ship actually sank beneath the waves.
Once he has a reasonable search area, it’s then time to mobilise a vessel and all the various equipment.
This is when his job gets complicated and very expensive.
He requires a sturdy ship, specialist team members, and acoustic searching devices such as side-scan sonars or multi-beam echo sounders.
(“We use acoustics because sound propagates through water a long distance,” he explains.) Then, once the wreck has been located, he sets loose a remotely-operated underwater vehicle on a tether (ROV) to film it or recover items.
On the ship’s deck, there must be a strong platform with cables and winches from which the sonar equipment and the ROVs can be launched and towed.
A small remotely operated vehicle (ROV) on a tether, similar to that used by Mearns in his underwater excavations. Photograph by Brian Skerry / National Geographic Image Collection
Ocean searches last days, weeks, even months, depending on the size of the search area.
For HMS Hood, Mearns had 630 square nautical miles to cover; for HMAS Sydney it was over 1,750.
The Windrush, with just 36 square nautical miles should be a cinch by comparison.
However, Mearns is always prepared for long, sometimes queasy days at sea, staring at a sonar screen, his sleep severely rationed.
Deep sea forensics
There is a science to covering an ocean search area.
The ship normally cruises up and down in a straight line, towing the sonar device (or towfish, as it’s known) at the end of a long cable.
Since every extra day spent at sea adds to the mission cost, Mearns needs to locate wrecks as swiftly as possible.
Unlike mowing a garden lawn, for example, where you progress in orderly lanes, up and down and left to right, he first concentrates on the optimal lanes of highest probability, leaving the lanes of lowest probability until last.
It’s a statistical process based on something called Bayesian search theory, and it can mean the difference between a few days or many weeks of searching.
The vessels that Mearns operates nowadays are luxurious compared to those he endured at the start of his career, back in the 1980s.
“I’ve been on some real dogs,” he says of his early outings.
“It wasn’t uncommon to be at sea for 60 days living in a small, smelly space with five other blokes, sleeping on bunks three-high, with diesel fumes, low food quality, working 12 hours on and 12 hours off, without safety standards.”
The Empire Windrush in dock at Southampton, 1954. The same year, the 500ft (152m) ship caught fire and sank off the coast of Algeria. Photograph by Pa Images / Alamy
Operating complex machinery, often miles out at sea, is always a risky business.
As well as injured crew, Mearns has had to delay or abandon projects for reasons ranging from ship fires, engine failures, loss of sonar equipment and ROVs, “and in one instance literally running out of food, prompting an urgent return to port”.
But that moment of discovery, when all the research and hard work finally come to fruition, more than compensates for any hardship.
“The moment you find a wreck is exhilarating,” he says.
“You cannot help but react in a spontaneous way.
There’s a lot of adrenalin involved.
I describe it like an athlete winning a gold medal.
You spend years training for it, and it’s all encapsulated in that split-second when you cross the finish tape.
Just like seeing the sonar image of a shipwreck popping up on your screen.”
Muralising the Empire Windrush on a wall in Bristol.
The ship has come to symbolise the arrival in Britain of a new wave of cultural diversity now generations old.
The 'first wave' and subsequent arrivals up to 1971 became known as the Windrush generation.
Honouring a generation
Mearns is in his office in the Sussex town of Midhurst, riffling through a green lever-arch file containing all his research on the Empire Windrush.
On his walls are paintings and photos of the more famous wrecks he has located, as well as industry awards and Guinness World Records certificates (deepest wreck found, deepest cargo salvage, deepest live internet broadcast, oldest astrolabe and oldest shipwreck bell discovered).
On his shelves are artefacts and memorabilia he has collected over the years: a three-foot-high Roman amphora; part of a cannonball from the Portuguese carrack he located in Oman; an ancient compass housing; the hub of a ship’s wheel from a German blockader; a diving helmet.
In between all these are dozens of research files and books on maritime history and ocean science.
The room is an office-cum-library-cum-museum.
Originally from New Jersey, in the United States, Mearns came to Britain 25 years ago and took over ownership of Blue Water Recoveries in late 2008.
Having spent much of his career on lucrative salvage projects and accident investigations, he’s now in a position where he can donate his services pro bono if, as is the case with the Empire Windrush, he feels it’s a worthwhile cause.
“Passion as opposed to profit,” he says.
In his 2017 book, The Shipwreck Hunter, he describes his motivation: “When deciding what shipwrecks are worth pursuing, I specifically look for… human stories hiding within the overall drama of the shipwreck itself.”
This partly explains why he favours historical wrecks over treasure-laden wrecks.
(Sunken treasure is further complicated by UNESCO regulations and opposition from archaeologists.) Two historical ships he is very keen to search for are TSS Athenia (the passenger liner torpedoed by a German U-boat at the beginning of World War II, with 117 lives lost) and the Endurance (Ernest Shackleton’s ship which sank off the coast of Antarctica).
Mearns says he’s “99 per cent positive” he has located the final resting place of the Athenia.
Any efforts to find the Endurance, however, would be severely hampered by the constantly moving pack ice above its last known location.
Before all that, however, he is directing his attention to the Empire Windrush.
Although he’s sure of her location in the Mediterranean, and confident he can cut free and raise the anchor, he knows that funding for the estimated £1.5 to £2.5 million project will be a challenge.
“I know I can find the ship, but if we reach out to the [Windrush] community and they say the project is inappropriate, we’re not going to do it.” David Mearns
A 'solidarity with the Windrush generation' demonstration in London, 2018. A new report has revealed 'profound institutional failure' in the government's handling of the affair. Photograph by Alamy
Most critical is the need for members and relatives of the Windrush generation to give their blessing.
On June 24th there will be an online consultation, open to the public.
“It’s the families who should decide. This is for their benefit, but they have to want it,” he says, aware of how sensitive the mission would be.
“I know I can find the ship, but the moral authority rests with them.
If we reach out to the [Windrush] community and they say the project is inappropriate, we’re not going to do it.”
From Spire by Asma Toroman A look at how advanced wave and weather forecasts, including swell waves and wind waves, are being used to improve maritime analytics.
Shipping companies and other maritime service providers are recognizing the need for more precise wave forecasts to add value to their operations and services.
And to meet that need, data providers are striving to accumulate detailed, high-resolution wave data and to offer easy-to-use APIs with helpful built-in functionalities.
Spire Weather offers a highly valuable and truly global weather forecast enriched with unique data from Spire’s satellite constellation: more precise and easier to use forecast with customized variables for the maritime industry.
Our maritime weather data pairs perfectly with maritime tracking.
Maximum insight, minimum friction.
Wave problems and risks
First, let’s do a quick recap of the challenges waves present for vessels.
At the most basic level, waves, no matter the size, make maritime travel less efficient.
Waves generate “wave load” (i.e.,they push against ships) and they create various ship movements that make travel less straight, and therefore less efficient.
And waves can cause damage.
They can damage cargo by slamming containers around, and even by knocking containers overboard.
And of course large waves, like those found in the Black Sea or the South China Sea, can directly damage vessels and equipment, make vessels sink, and pose serious hazards to employees.
Now let’s look at some ways wave data is being used, and how that use is improving.
Wave forecasts for route adjustments
Maritime weather science and forecasting are improving.
This is a result of 1) ongoing weather model improvements, and 2) advanced machine learning technology becoming more common (here’s a paper on machine learning being used to predict maritime fog).
One use of more exact, up-to-date ocean/sea state forecasts, including wave forecasts, is using it to adjust routes.
Wave forecasts can be incorporated into digital e-navigation algorithms to adjust and optimize ship course and speed based on predicted conditions several hours, days, or weeks into the future.
Spire waves height WMS and AIS with OpenLayers base map
At Spire, several weather forecasting bundles are focused for use
by the maritime industry,
and wave forecasts have recently been added to
these bundles.
Our maritime weather forecasts include:
Sea surface temperature
Ocean currents speed
Ocean currents direction
Significant wind wave height
Mean wind wave direction
Mean wind wave period
Significant total swell wave height
Mean total swell wave direction
Mean total swell wave period
Such programs may take into account a vessel’s characteristics and how that vessel responds to specific wave conditions.
A 2016 paper about ship weather routing optimization algorithms says that models may take into account a “ship’s behavior and responses, its speed profile and fuel consumption when facing wind, waves, current and other environmental conditions.”
As e-navigation and autonomous solutions improve, digital application creators will demand better wave forecasts that are high resolution (more data points per earth surface area) and more frequently updated.
And as the state of the art advances, there will be demand for algorithms for focused, niche applications. Wave forecasts in simulations and digital twins
Advances in maritime data reporting and machine learning have led to improvements in the ability to run complex, accurate simulations of how vessels and equipment work.
One type of simulation is the “digital twin,” which is a computer model of a vessel or piece of equipment.
Digital twins allow researchers to run experiments and simulations without putting the real-world asset, or the people and processes associated with it, at risk.
For example, they might run a simulation that replicates years or decades of continual use to predict wear and tear.
Waves can be an important factor in these models.
Maritime program creators can incorporate near-future wind and wave forecasts, combined with data-reporting sensors on vessels and structures, to predict how their assets will respond.
With such models, they can answer questions like, “How will this specific offshore structure respond to these specific wind and wave conditions?” or “What specific conditions would have to develop to pose a danger for this specific vessel?” This technology has existed for decades, but it’s rapidly improving.
Wave forecasts can also be used in simulations to optimize fuel use and reduce emissions.
One of our case studies looked at Oldendorff, one of the world’s largest dry bulk shipping companies, and how they used our weather and wave forecasts in a digital twin simulation.
Their model aimed to optimize their fuel consumption, based on intelligent route planning, amongst other factors. Wave forecasts for public safety and environmental forecasting
Wave data, and weather data in general, can be studied and analyzed over longer time ranges, and used in predictive models.
These uses have applications in shipping and transport, but also in many other areas, including public safety, environmental studies, and government studies.
One example of this: incorporating wave forecasts into models for predicting how an oil spill, or other chemical spill, might spread in bodies of water.
For a specific example of this, see this 2018 paper Oil spill dispersion forecasting models, which describes how wave forecasts, and other kinds of data, were used to build an oil spill forecasting model.
Another example: At Spire, we are working on satellite-data-driven solutions that could enable more immediate detection of tsunamis by augmenting existing early-warning systems with newer sources of data, like GNSS radio occultation (RO) data. Wave data for analysis of incidents
When things go wrong, historical sets of data, including wave data, can be used to get a better idea of what happened.
For example: if a piece of equipment failed, or was known to have issues under certain conditions, the routes that specific ships traveled could be studied and correlations might be found between certain wave conditions and certain kinds of wear and tear.
Maybe a company’s ships that traveled routes that had extreme waves would show specific wear and tear issues, and it’s possible that could only be determined with an in-depth historical data analysis.
Wave data trends
In the maritime industry, shipping companies and other operators are demanding precise data, and demanding services that use that data for specific applications.
Wave data is just one facet of maritime data, an important one, and wave data sources and algorithms will continue to improve.
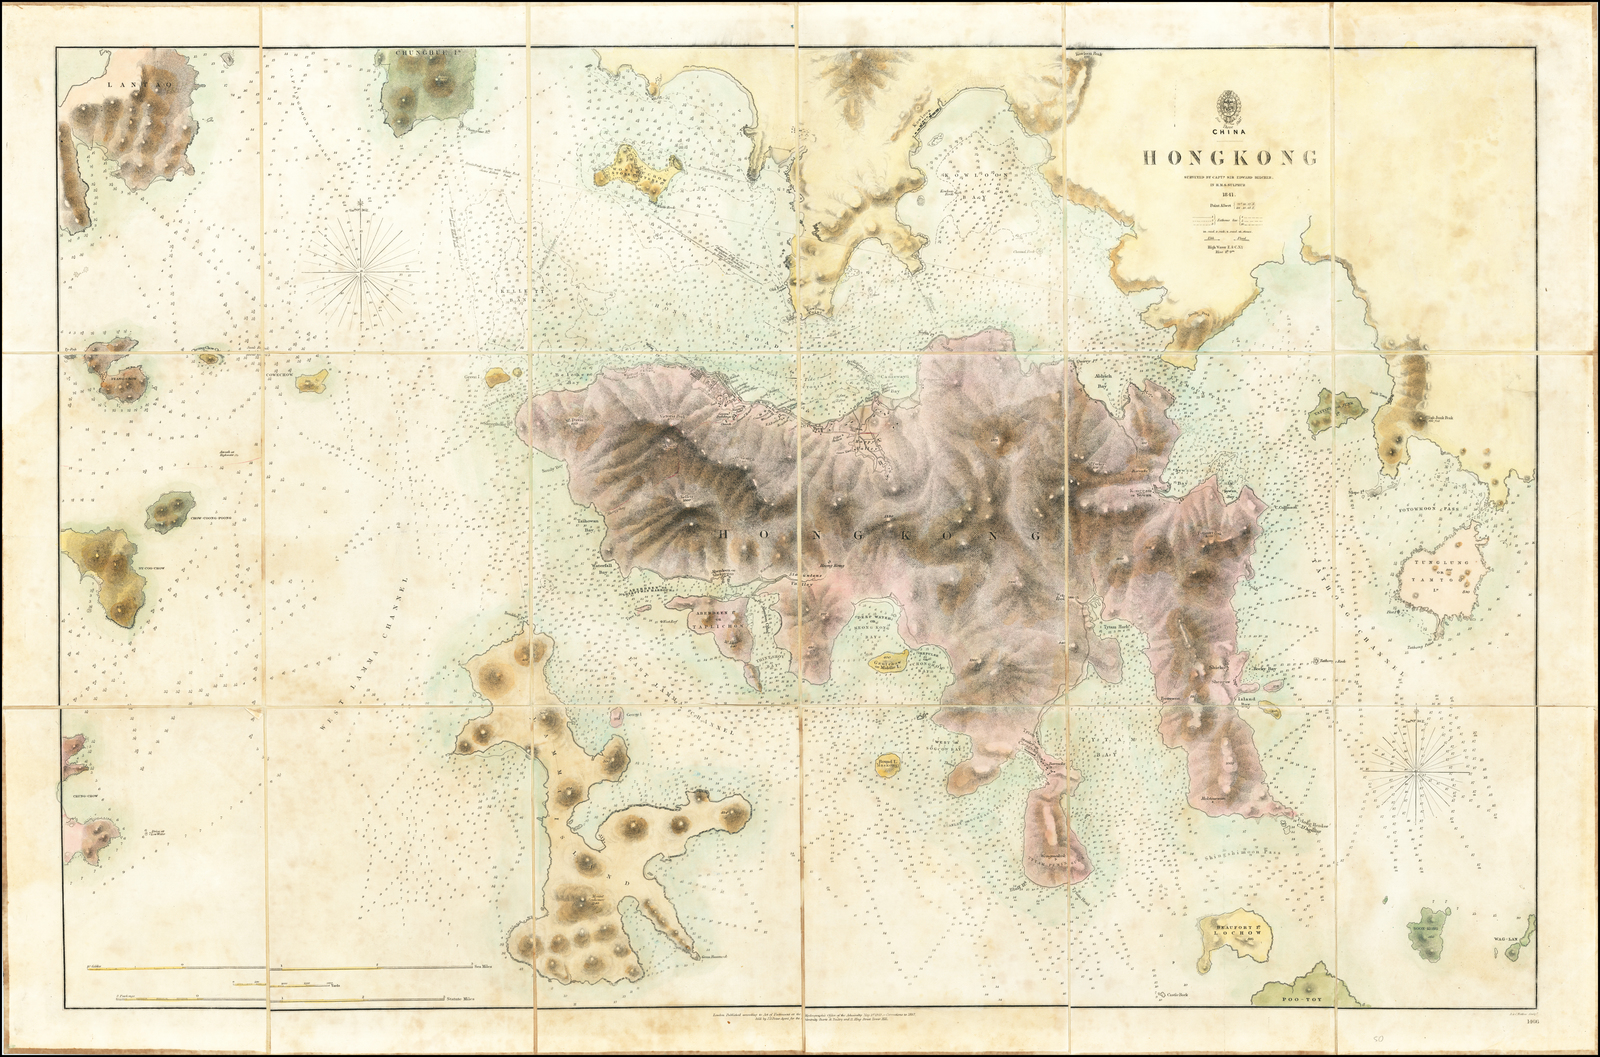
Early edition of the first printed map of Hong Kong, first published in 1843 by the British Admiralty Chart of Hong Kong, based upon the surveys of Sir Edward Belcher.
Belcher's survey is the first large format map or sea chart of Hong Kong.
On January 26, 1841, Edward Belcher and his men were the first of the British fleet to land on Possession Point at the north shore of Hong Kong for the British Crown.
He subsequently made the first British survey of Hong Kong harbor.
While the map is dated 1841, the first state of the map was not published until May 1843.
In comparing the map to the 1846 state, we note changes in the following areas:
Naming and improved coastline for Taihowan Bay and Sandy Bay
Staunton's Valley named and improved
Settlements in Victoria Bay are nearly doubled
Settlement shown in Happy Valley
Taitoo Id. is now Taitoo or Junk Island
Adrich Bay, Sywan Bay and Little Sywan Bay are named with better detail along the coastline.
1929 (dated) 27.5 x 40.5 in (69.85 x 102.87 cm) 1 : 186000
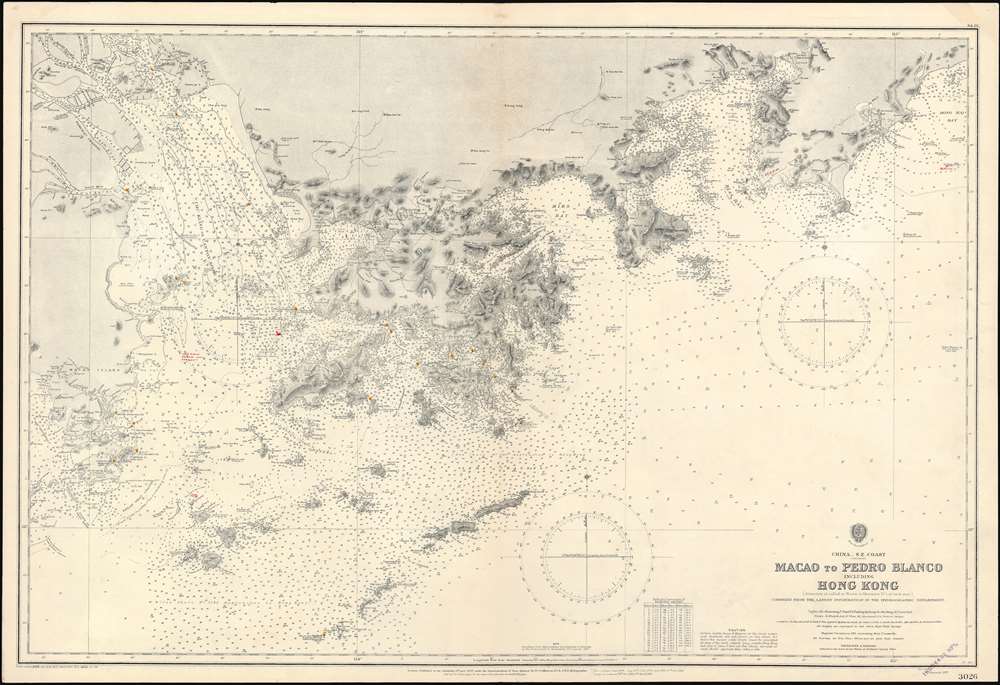
A rare 1929 British Admiralty nautical chart or maritime map of Hong Kong and vicinity. Centered on Hong Kong, the map includes Kowloon and the New Territories, it extends west as far as Macao, and east to Hong Hai Bay.
The chart exhibits manuscript updates in a practiced hand.
Census and Publication HistoryThis chart was first published in 1899, with the present example being updated to 1929.
In the 1960s, the U.S. Navy issued a similar chart of the same title.
The map appears in the OCLC in an 1899 and a 1960 edition, but no institutional holdings are identified.
We have been able to trace no other examples of the present edition and no verifiable examples of earlier editions.
surveyed by Captn. Sir Edward Belcher in H.M.S. Sulphur 1841
Hydrographic Office of the Admiralty An iconic chart of
the utmost importance, this is the 1890 issue of Edward Belcher’s
survey of Hong Kong and vicinity. This was the first British survey of
Hong Kong and played a significant role in Great Britain’s acquisition
of the Crown Colony. The chart covers all of Hong Kong Island as well as
the Kowloon Peninsula and, either in part of full, the adjacent islands
of Lan Tao, Peng Chau, Hei Ling Chau, Lamma, Sheung Sze Mun, Po Toi,
and Tung Lung Chau. It offers impressive detail to the level of
individual buildings, especially in the vicinity of Victoria, Central,
and on the Kowloon Peninsula. The chart also features innumerable
soundings in fathoms, the locations of rocks and other hazards, and
other aids to navigation. An inset map of Fotaumun Pass or Tathong
Channel appears in the upper right quadrant. The chart was the
product of surveys overseen by Edward Belcher (1799-1877), a British
naval officer, scientist, explorer, and marine surveyor active in the
middle part of the 19th century. Belcher surveyed Hong Kong Island and
Harbour after landing the bombing and surveying vessel H.M.S. Sulphur
on Possession Point on January, 26, 1841. Coming at the height of the
First Opium War (1839–42), Belcher’s was the first force to land on and
take possession of Hong Kong for the British Crown. He may have been
unaware of the long term significance of his conquest, but he was
certainly a keen enough observer to recognize the island’s strategic
significance and commercial potential. As such, his impressive chart,
first published in 1843 and updated many times thereafter, set the
standard upon which most subsequent nautical charts of Hong Kong were
based well into the 20th century. Indeed, I find in OCLC (#905910153) an
example printed in 1960! The chart was intended for hard use at sea,
and all early editions are consequently rare. This example of the
chart was owned by the Thomas Reese Anderson, a native of the
ship-building town of Sackville, New Brunswick and captain of the
1438-ton Albania of the Taylor Brother’s fleet. It was by far
the best and most up-to-date depiction of the region available, and
Anderson would have obtained it in advance of an 1891 charter voyage
from New York to Yokahama. Following the voyage he retired from sailing
and became a man of means in his hometown of Sackville, New Brunswick. He invested in various businesses including a railroad line, which
ultimately led to his death in 1918 after being struck by a shunting
train engine in 1918.
Hong Kong island with the GeoGarage platform (NGA raster chart)
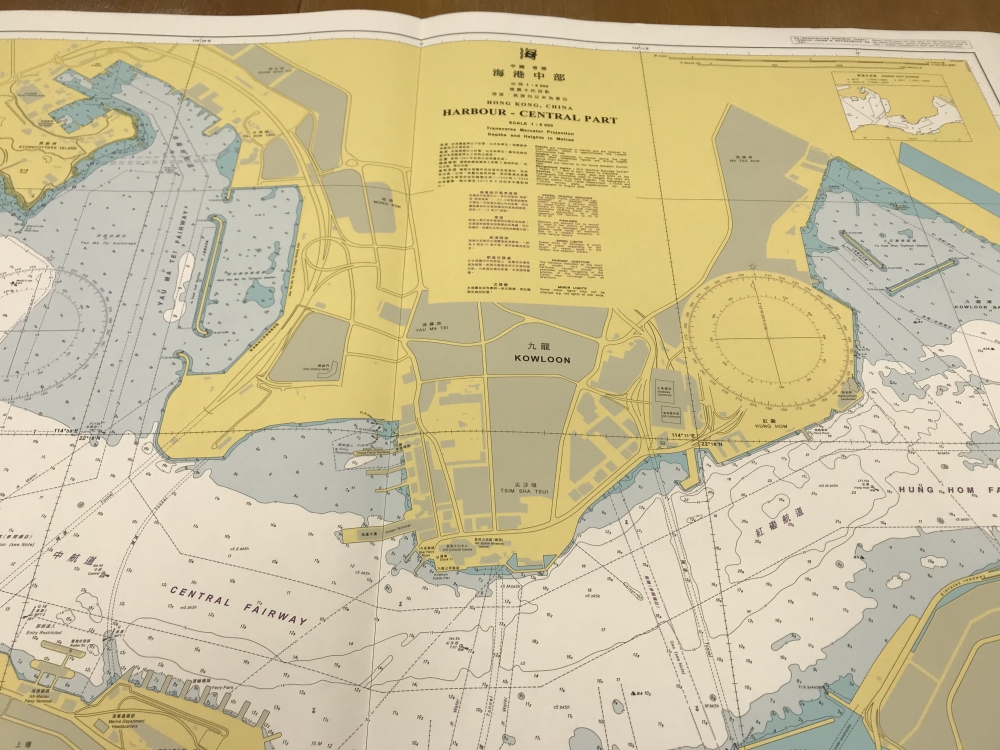
The HKHO produces 12 nautical charts for different parts of the Hong Kong waters.
The picture shows a nautical chart of the central part of the harbour.