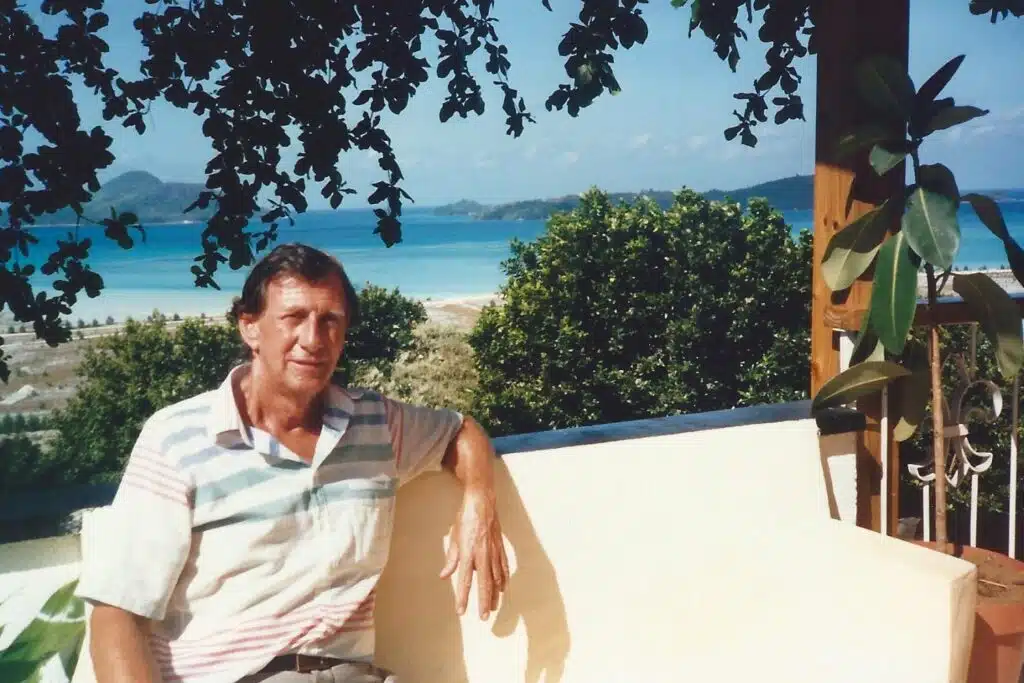
In 1962, Brendon Grimshaw, a 37-year-old British newspaper editor working in Kenya, decided to go on holiday in the Seychelles, an archipelago of 115 (mostly uninhabited) islands in the Indian Ocean.
More than just a change of scenery, Grimshaw was looking for a change of life.
As editor of some of the largest newspapers in East Africa, Grimshaw was aware of Africa’s changing sociopolitical scene: the United Republic of Tanzania (in East Africa) had declared its independence the year before, and Kenya was about to follow suit.
This meant that most jobs like his would soon pass to locals.
So, Grimshaw decided it was the perfect time to search for a new direction in life; one that would bring him closer to nature.
Taken by the breathtaking natural beauty of the Seychelles during a previous visit, Grimshaw found himself daydreaming about owning land there.
But even the smallest deserted island would cost a small fortune.
Still, the longer he stayed, the more the idea grew on him.
Then, fate stepped in.
On the next-to-the-last day of his visit, a young man approached Grimshaw and asked if he was interested in buying an island.
Grimshaw’s interest was instantly piqued.
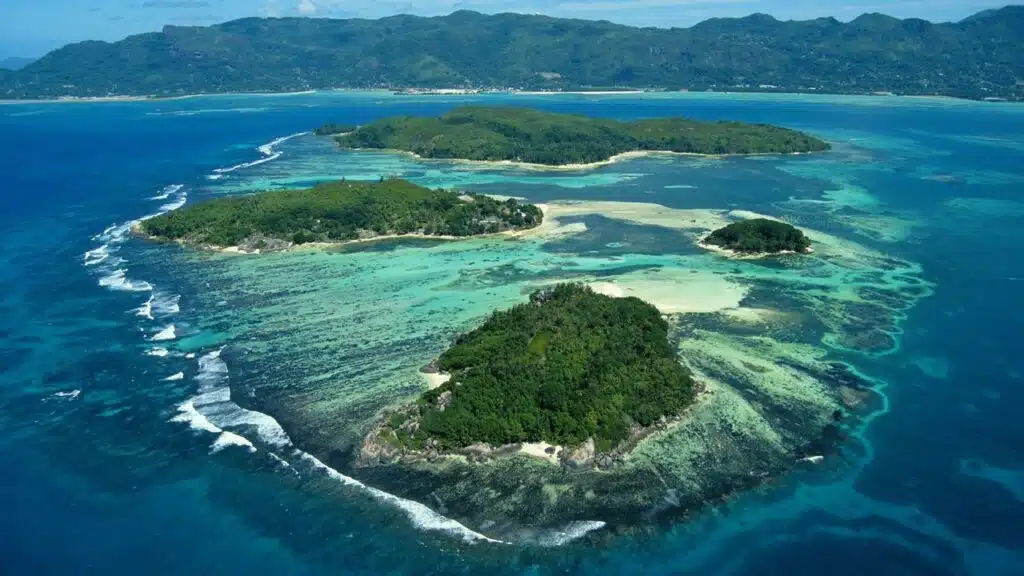
The man took Grimshaw to the island of Moyenne, an isolated .038 sq.
mile (24 acre) island off the northern coast of Mahé, Seychelles’ largest island; an island that hadn’t been occupied since 1915.
Moyenne was geographically close enough to Seychelles’ main island to be accessible–yet like a world away.
Though stiflingly over-grown and unkempt, Grimshaw decided he had to have it.
Just hours later–four minutes to midnight on the last day of his stay, in fact–Grimshaw signed an agreement to pay £8,000 (about $10,000) to the current owner, one Philippe Georges, to take ownership of Moyenne.
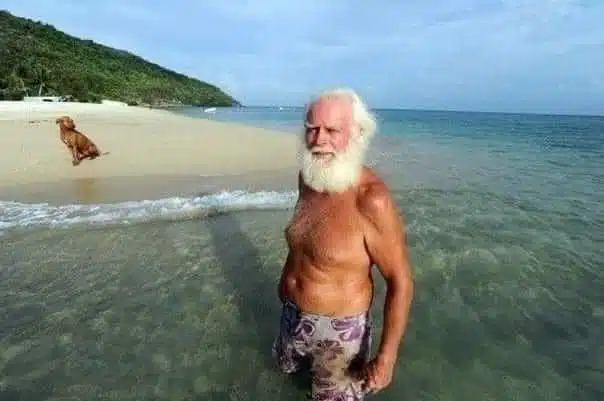
Though it would take nearly ten years of back-breaking work to make the island inhabitable, in 1972, Grimshaw became the island’s only full-time resident, and remained so until his dead.
By that time, Moyenne had been transformed from a tiny over-grown jungle into an idyllic island paradise.
UpbringingBorn on July 27, 1925, in Dewsbury, Metropolitan Borough of Kirklees, West Yorkshire, England, to Raymond and Kate “Kitty” (nee Coare) Grimshaw, Brendon Derek Grimshaw grew up in a modest home with his grandparents and father’s relatives as neighbors.
While most of what is known of Grimshaw’s early years comes from Grimshaw himself, contained in his autobiography, A Grain of Sand, he credits his father for being a good provider (owner of a radio and television business), and his mother for teaching him the more refined things in life such as a love of books and theater.
He also credits her for the rebellious streak that sent him off on his own at the age of 15.
NewspapermanHaving demonstrated a talent for writing by age 13, Grimshaw’s mother took it upon herself to arrange a meeting for her son with the editor of the Batley News, in West Yorkshire.
WWII had begun two years before and many local businesses (including the Batley News)were in need of employees.
When asked if he wanted to be a “newspaperman,” Grimshaw quickly said yes—and was hired on the spot.
Grimshaw started out in the front office–wrapping newspapers for delivery, operating the antiquated switchboard, and “totaling endless columns of figures”–but soon progressed to the printing department, becoming proficient on the “stone” (setting type by hand), the Linotype typesetting machine, and the newspaper printing machines.
Before long, he was promoted to reporter and given two districts to cover, and soon after, made film critic, responsible for writing two weekly columns.
At age 23, Grimshaw had became the youngest chief reporter in Britain.
Two years later, he switched from the Batley News to The Star, in near-by Sheffield.
But reporting British news suddenly seemed less exciting than it once had.
Seeking a change, Grimshaw applied to International newspapers in the Near East and Africa.
In a matter of weeks, he was hired as Senior Sub-editor at the East African Standard in Nairobi, the capital of Kenya; a job that required him to carry a shoulder-holster gun (and sleep with it under his pillow) due to an uprising by the Mau Mau, a militant African nationalist movement.
Over the next eight years, Grimshaw was promoted to Featured Editor, as well as drama and book critic–but his mind kept drifting off to more exotic locations.
Places surrounded by nature.
At 37 years of age, he’d seen enough of the world to know that there’s more to life than running a newspaper.
Robinson Crusoe and His Man FridayOnce the purchase of Moyenne was official, the daunting task of restoring it to its former beauty and making it inhabitable began.
For the next nine years, Grimshaw continued to work as a journalist, working for the Tanganyika Standard and the Sunday News, in Dar es Salaam, Tanzania–becoming editor and director of both newspapers.
During these years he made frequent trips to Moyenne, slowly bringing the island back to life.
Invasive weeds had choked the native vegetation and the tiny island is said to have been so overgrown that falling coconuts never reached the ground.
The island floor had grown so dense and tangled that crossing the island was impossible; birds were noticeably absent and rats held dominion over the undergrowth.
Once assessing the massive task at hand, Grimshaw made his initial goal not just to make the island fit for habitation, but to protect Moyenne from over-development.
At first, this meant uncovering the island’s raw beauty and building a humble island home where he could live out his days, but once the work was under way, his long-term dream became to create a natural paradise that would outlive him– and remain protected long after he was gone.
As if fated to be part of Grimshaw’s ambitious undertaking, the 19-year-old son of a local fisherman named Antoine Lafortune agreed to help Grimshaw with his project.
Immediately setting out to transform the island, the two cleared scrubs, planted trees (palm, mango, and paw-paw), and blazed paths through the jungle.
Then to make up for the lack of wildlife, Grimshaw brought 10 birds from a neighboring village and began feeding them in hopes of attracting more birds that would make the island their home.
And once sufficient space was cleared, Grimshaw arranged to reintroduce the once-native giant Aldabra tortoise to the island.
Pirates and Buried TreasureWhile taming the overgrown north-western corner of Moyenne, Grimshaw made an interesting discovery: two graves with tombstones that read, “Unhappily Unknown.”
According to local legend, the graves belonged to a pair of lowly pirate deck hands killed by two infamous pirate captains, who sailed the Indian Ocean, so that the dead men’s spirits would protect their buried treasure and haunt the island.
(One of the beaches on the island’s north side had already been dubbed, “Pirate’s Cove.”) Grimshaw decided the pirate stories were likely true (or so he feigned) and seemed to enjoy entertaining the idea.
Whether Grimshaw (and Lafortune) actually believed the legend or not, the two took it seriously enough to excavate in two locations on the island to assuage their curiosity; the sites now indicated by skulls & crossbones on current maps.
And whether they found anything of value or not—will likely never be known.
Tourism and Corporate InterferenceAbout ten years after Grimshaw moved to the island permanently, the Seychelles became a tourist destination; the exotic archipelago having become synonymous with a tropical island paradise.
Coming as no surprise, it wasn’t long before investors began eyeing-up idyllic Moyenne and began showing up wanting to buy it: a Saudi prince is said to have offered Grimshaw upwards of $50m for it.
But Grimshaw had no interest in wealth.
And no interest in seeing his beautiful paradise become a “luxury destination” for tourists.
By this point, Grimshaw knew one thing for certain: it was only a matter of time before wealthy investors would find a way to destroy the peace and tranquility he’d devoted two decades of his life to creating.
As offers continued to pour in, Grimshaw began devising a scheme to keep investors out permanently.
Past, Present, and FutureIn 1981, Grimshaw’s mother passed away, leaving no one to attend his aging father, Raymond.
To Grimshaw’s surprise, the 88-year-old agreed to move to the island to live out his final years with his only son.
Grimshaw wrote of these years with his father, “We had a wonderful time together and became the best of friends.”
In 1986, Grimshaw’s father passed away and was buried on the island; alongside the two unknown “pirates.”
In 1996, Grimshaw told his life story and his time on Moyenne in an autobiography titled, A Grain of Sand; a fascinating read that made him the subject of many newspaper travel articles and a television documentary (shortly before his death).
In an effort to ensure that the island would be preserved in its unspoiled state in perpetuity (acknowledging that he was unmarried, had no heirs, and no one to take on custodianship of the island), in 1998, Grimshaw established the Moyenne Island Foundation Society.
Though having no family to support his cause, Grimshaw earned the respect of the neighboring Seychelles people (and nature lovers all around the world) for his tireless devotion to restoring and conserving the island, and hoped that support would be enough to fend off outside interests.
In 2007, Grimshaw’s close companion of 45 years, Antoine Lafortune, passed away—but not before completing their plan to plant 16,000 trees—which included 700 exotic mahoganies.
Knowing that his own time was limited, in 2009, Grimshaw met with the Seychelles’ Ministry of Environment (Marine and Parks Department) to set up a permanent trust to protect the island.
The agreement they signed made Moyenne part of Ste Anne Marine Park–but granted it its own unique status.
As Moyenne Island National Park, it is the smallest national park in the world.
In 2010, Grimshaw permitted a film crew to visit the island to make a documentary about him and the incredible work he’d accomplished there; a film aptly titled, A Grain of Sand.
The EndBrendon Derek Grimshaw died on July 3, 2012, at the age of 86, and was buried beside his father (and the two unknown “pirates”).
At his request, Grimshaw’s tombstone reads, “Brendon D. Grimshaw 1925-2012.
Moyenne taught him to open his eyes to the beauty around him and say thank you to God.”
In his Last Will and Testament, Grimshaw expressed his final wishes: “Moyenne Island is to be maintained as a venue for prayer, peace, tranquillity, relaxation and knowledge for Seychellois and visitors from overseas of all nationalities, colours and creeds.”
His wishes now rest in the hands of the Moyenne Island Foundation.
LegacyWhile it’s easy to label Grimshaw eccentric–or perhaps insane (he did, after all, buy a horribly overgrown island on the other side of the world, pick up and move there leaving everything behind, believed pirates once frequented his island [and possibly buried their treasure there], and spent 50 years of his life restoring what was a relatively inconsequential dot of land), by any measure, what Grimshaw accomplished was nothing short of miraculous.
Now part of Seychelles Ste. Anne Marine National Park, visitors from all around the world enjoy his creation: 16,000 indigenous trees (including a small hard-mahogany forest), over three miles of nature trails, more than 120 giant Aldabra tortoises and dozens of hawksbill turtles, and a vast menagerie of over 2000 exotic birds–including the Hollandais pigeon and Madagascar red fody weaver bird.
(By one estimate, Moyenne is home to more plant species per square mile than any other national park in the world.) And not to forget, the natural beauty of the surrounding Seychelles Islands themselves is nothing short of spectacular.


 Airborne RGB image, co-collected with the bathy Lidar.
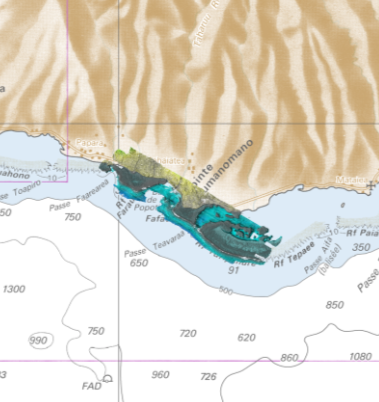
 Seabed classification based on fused airborne bathy Lidar and imaging data.
 Modern freshwater pipeline and remains from Bronze Age construction on the seabed.