Saturday, December 30, 2017

Locator beacon - saving lives for over 50 years

In the UK, by 1959 the first automatic beacon for liferafts had been produced by Ultra Electronics, and at the same time Burndept produced the TALBE (Talk and Listen Beacon Equipment) - VHF, and SARBE - Search-And-Rescue-Beacon Equipment (UHF) range of beacons which were used by the Fleet Air Arm and later, Royal Air Force
Later, SARBE beacons included a radio for voice communication by the survivor with the rescuing personnel. 
In the video : L/S of a man struggling from the sea into an inflatable dinghy.
We see a Wessex helicopter from RAF Acklington, Northumberland preparing to take after the crew climb aboard and set off to rescue the man.
The man in the dinghy takes out a Sarbe Beacon; a little battery pack with an aerial that sets off a signal.
Commentator in 1967 tells us Sarbe stands for 'Search and Rescue Beacon Equipment'.
Various shots at the Vidor Factory in South Shields, Tyne and Wear, show the Sarbe Beacons being made; the workers, mainly women, are seen putting the battery packs together.
A man tests the batteries by putting them in a tank of salt water.
Commentator gives us more of the technical details as a woman tests a battery on a voltmeter.
Cut back to the man in the dinghy as the helicopter approaches; several shots of the control dials on the helicopter control board.
A man is lowered from the helicopter; he picks up the man from the dinghy and they are both brought back up to safety

 Search and Rescue (SAR) operations involve locating and helping people in distress.
They can be carried out in a variety of locations including at sea, in mountains or deserts, and in urban areas.
With the launch of Initial Services, Galileo will help SAR operators respond to distress signals faster and more effectively while also lowering their own exposure to risk…
Search and Rescue service is Galileo’s contribution to the international Cospas-Sarsat network. Galileo is a EU programme, carried out in cooperation with the European Space Agency.

Links :

Friday, December 29, 2017

Bizarre, enormous 16th-century map assembled for first time

Urbano Monte’s enormous 1587 map is a unique vision of the world as he knew it.

From National Geographic by Greg Miller 

The largest known world map of its time—made of 60 individual sheets—can finally be seen as the mapmaker intended.

This colorful and intricately detailed map from 1587 is more than nine feet by nine feet when fully assembled.
For the last 430 years, its 60 individual sheets were bound together as an atlas, but now they have finally been put together—digitally—to reveal a complete picture of the world as it was understood at the time.

 Monte included a portrait of himself at age 43 (left)
and later updated it at age 45 by pasting a new portrait over it (right).

And what a world it was.
The map is packed with fantastical creatures, from unicorns in Siberia to mermen frollicking in the Southern Ocean and a terrifying bird flying off with an elephant in its talons.
The map reflects the geographical knowledge (and misconceptions) of its time, but in some ways it’s surprisingly advanced.
It portrays the Earth as it would be seen looking directly down on the North Pole from space, a perspective not commonly used by mapmakers until the 20th century.

 Monte’s depiction of Japan is oddly shaped and oriented east to west instead of north to south, but it includes many places not present on other Western maps of the time.

“It’s unique in many ways,” says G. Salim Mohammed, the head and curator of the David Rumsey Map Center at Stanford University, which recently added the map to its collection.
“No one has really studied this because it’s been hidden for centuries.”
Only three surviving versions of the map are known to exist.

The map is made up of 60 individual sheets, like this one showing northern Europe.

Little is known about the mapmaker, Urbano Monte.
He came from a wealthy and well-connected family in Milan, and like many gentleman scholars of his day, he had a keen interest in geography. It was, after all, an exciting age of discovery, writes Katherine Parker, a historian of cartography, in a recent essay about Monte’s map: “Their world was growing each day and Monte wanted to understand all of it.”

This sheet shows the islands of Tierra del Fuego (bottom), discovered just a few decades earlier.

Monte appears to have been quite geo-savvy for his day.
He drew on the works of more famous cartographers like Gerardus Mercator and Abraham Ortelius, and he included recent discoveries of his time, such as the islands of Tierra del Fuego at the tip of South America, first sighted by the Portuguese explorer Ferdinand Magellan in 1520.

 A bird flies over the Southern Ocean with an elephant in its talons.

Thanks to his connections in high places, Monte met with the first official Japanese delegation to visit Europe when they came to Milan in 1585.
Perhaps as a result, his depiction of Japan contains many place names that don’t appear on other Western maps of the time.

 A merman appears to pay tribute to King Philip II of Spain off the coast of South America.

Like many mapmakers of the era, Monte had a tendency to fill in the empty spaces on his map. Animals roam the land, and his oceans teem with ships and monsters.
King Philip II of Spain rides what looks like a floating throne off the coast of South America, a nod to Spanish prominence on the high seas.

 To digitize the map, the team scanned all 60 sheets and began assembling them as a series of five concentric rings. Four sheets make up the innermost ring.

A more unusual feature of Monte’s map, however, is the projection—that is, the method he uses to flatten the globe onto a map. Monte’s map is circular, with the North Pole at the center and lines of longitude radiating outward from there—what modern cartographers call a polar azimuthal projection, a very unusual choice for his time.
The projection became popular only with the advent of air travel in the 20th century, when the shortest route between two points often involved arcing up over the Arctic (here’s one example).

At this stage of assembly, two more rings have been added.
This is the map with all five concentric rings of sheets stitched together.

“I think Monte was really trying to show the circular nature of the Earth,” says David Rumsey, the map collector who bought the map and donated it to the center he founded last year at Stanford.
The polar projection has the advantage of accurately portraying the continents of the northern hemisphere.
It grossly exaggerates the size of Antarctica, but that actually fit with the cartographic thinking of the time, Rumsey says.
“Most cartographers thought it had to be massive to counterbalance the large landmasses to the north,” he says—a misguided but influential idea dating back to the ancient Greeks.

Monte’s map was re-projected so it could be aligned with the modern globe in Google Earth.

Bringing Monte's vision to life

Rumsey purchased the Monte map in September, and his nephew Brandon did most of the work to scan each page and stitch the images together.
They fit almost perfectly, which suggests it’s what Monte had intended all along.
The individual sheets and composite are now online, as is a version of the map aligned with the modern globe in Google Earth:


Using modern technology to fulfill the vision of a 16th century cartographer is exactly the sort of thing the new map center at Stanford was set up to do, say Rumsey and Mohammed.
Making the new digital version freely available should make it easier for scholars to learn more about Monte and his map.
For the rest of us, it’s a chance to explore an extremely rare map that happens to be one of the most spectacular of its time.

Links :

Thursday, December 28, 2017

Extremities of the Earth: The most remote inhabited island

Creator: Bellin (1746)
Publisher: Arkstée et Merkus

From LOC by Julie Stoner

Where is the lowest point on dry land?
Or the northernmost inhabited point on earth?
How about the highest city?
All of these questions and many more will be unraveled in this new occasional series, Extremities of the Earth, created to explore the farthest reaches of our planet.
For this inaugural post for the series, I found myself fascinated by the most remote inhabited island in the world: Tristan da Cunha. Located in the South Atlantic Ocean, this small island with a 25-mile circumference is farther away from the next outpost of humanity than any other inhabited place in the world.
About 1,200 miles away from the island of St. Helena and 1,750 miles from Cape Town, South Africa, Tristan da Cunha (colloquially known simply as Tristan) is home to 256 people.
The island is part of an archipelago of six small islands, with Tristan being the only permanently inhabited one.
It is believed that the island was first sighted by Admiral Tristao da Cunha, pictured below, in 1506, as he and his crew were sailing from Portugal to the east coast of Africa.
However, it was not until 1643 that the first recorded landing took place by the crew of the Dutch vessel Heemstede.

 “Triastao da Cunha, 1460?-1540.” Woodcut of Triastao da Cunha by Tobias Stimmer. Illustrated in Elogia Virorum Bellica Virtute Illustrium…by Paolo Giovio, 1575.
Rare Book Division, Library of Congress.

Due to its location, Tristan was a convenient place for ships to resupply on long sea voyages from Europe to Asia in the 16th and 17th centuries.
Although the first large-scale charts of the archipelago were created by the Dutch in 1656, the islands can be seen marked on earlier maps, such as on this portolan chart from 1633 by Pascoal Roiz.
Can you spot the island of Tristan da Cunha on this map?

 “A portolan chart of the Atlantic Ocean and adjacent continents,” Pascoal Roiz, 1633.
Geography and Map Division, Library of Congress.

 Detail of “A portolan chart of the Atlantic Ocean and adjacent continents,” Pascoal Roiz, 1633. Geography and Map Division, Library of Congress.

The first attempt at settlement of the island was made in 1810 by Jonathan Lambert of Salem, Massachusetts, who arrived on the island with three other men.
Lambert became the self-proclaimed “ruler” of the island.
His reign was short, however, as Lambert and two of the other men drowned while on a fishing expedition in 1812.
The expedition’s one survivor, Thomas Curry, was left to continue farming on Tristan, but he was soon joined by several more settlers.
In 1816, the United Kingdom annexed the archipelago and a garrison of British troops was sent to secure Tristan, although the troops were soon recalled in 1817.
Several men led by Corporal William Glass decided to remain and settle on the island, becoming the ancestors of many of today’s islanders.

 “Tristan da Cunha,” published by Directorate of Colonial Surveys, 1948.
Geography and Map Division, Library of Congress.

As seen in the map above, there is only one town on the island, officially named Edinburgh of the Seven Seas but locally known simply as the Settlement.
This is the only relatively flat plain on the island, with the remainder dominated by Queen Mary’s Peak, an active volcano and the highest island mountain in the South Atlantic Ocean.
In 1961, a volcanic eruption forced residents to evacuate the island, moving temporarily to England. The majority of Tristan residents chose to return in 1963.

 Tristan da Cunha NGA nautical chart with the GeoGarage platform

Today, the social and economic organization of the island is much the same as it was set up by William Glass in 1817.
All land is communally owned and all Tristan families are farmers at least part-time, working on family plots of land in an area known as the Patches.
Anyone interested in visiting the island today must receive prior approval by the island Administrator.
Although it is the most isolated settlement in the world, Tristan da Cunha remains a vibrant and successful community.

Links :

Wednesday, December 27, 2017

Nightmare scenario: ship critical systems easy target for hackers

Naval Dome exposes vessel vulnerabilities to cyber attack

From World Maritime News

Hackers can easily access and over-ride ship critical systems, results of a series of cyber penetration tests conducted by Naval Dome, an Israel-based cyber security specialist, show.
The tests were carried out on systems in common use aboard tankers, containerships, superyachts and cruiseships, under the supervision of system manufacturers and owners,
Naval Dome’s cyber engineering team hacked into live, in-operation systems used to control a ships’ navigation, radar, engines, pumps and machinery, and was able to shift the vessel’s reported position and mislead the radar display.

Another attack resulted in machinery being disabled, signals to fuel and ballast pumps being over-ridden and steering gear controls manipulated.
“We succeed in penetrating the system simply by sending an email to the captain’s computer,” Asaf Shefi, Naval Dome’s CTO, the former Head of the Israeli Naval C4I and Cyber Defense Unit, said commenting on the penetration into the ship’s Electronic Chart Display and Information System (ECDIS).

“We designed the attack to alter the vessel’s position at a critical point during an intended voyage – during night-time passage through a narrow canal. During the attack, the system’s display looked normal, but it was deceiving the Officer of the Watch. The actual situation was completely different to the one on screen. If the vessel had been operational, it would have almost certainly run aground.”


According to Shefi, the Naval Dome hack was able to alter draught/water depth details in line with the spurious position data displayed on the screen.
“The vessel’s crucial parameters – position, heading, depth and speed – were manipulated in a way that the navigation picture made sense and did not arouse suspicion,” he said.
“This type of attack can easily penetrate the antivirus and firewalls typically used in the maritime sector.”


Commenting on the ease with which Naval Dome was able to by-pass existing cyber security measures, Shefi explained: “The Captain’s computer is regularly connected to the internet through a satellite link, which is used for chart updates and for general logistic updates. Our attacking file was transferred to the ECDIS in the first chart update. The penetration route was not too complicated: the attacking file identified the Disk-On-Key use for update and installed itself. So once the officer had updated the ECDIS, our attack file immediately installed itself on to the system.”

In a second attack, the test ship’s radar was hit. While the radar is widely considered an impregnable, standalone system, Naval Dome’s team used the local Ethernet Switch Interface – which connects the radar to the ECDIS, Bridge Alert System and Voyage Data Recorder – to hack the system.
“The impact of this controlled attack was quite frightening,” said Shefi.
“We succeeded in eliminating radar targets, simply deleting them from the screen. At the same time, the system display showed that the radar was working perfectly, including detection thresholds, which were presented on the radar as perfectly normal.”


A third controlled attack was performed on the Machinery Control System (MCS).
In this case, Naval Dome’s team chose to penetrate the system using an infected USB stick placed in an inlet/socket.
“Once we connected to the vessel’s MCS, the virus file ran itself and started to change the functionality of auxiliary systems. The first target was the ballast system and the effects were startling. The display was presented as perfectly normal, while the valves and pumps were disrupted and stopped working. We could have misled all the auxiliary systems controlled by the MCS, including air-conditioning, generators, fuel systems and more.”

Itai Sela, CEO of Naval Dome, added that the virus infecting ship systems can also be unwittingly transferred by the system manufacturer.
“As manufacturers themselves can be targeted, when they take control of onboard computers to carry out diagnostics or perform software upgrades, they can inadvertently open the gate to a cyber attack and infect other PC-based systems onboard the ship. Our solution can prevent this from happening.”

Links :

Tuesday, December 26, 2017

Does this 17th-century map show an early image of Father Christmas?

The map images are Crown Copyright, courtesy of The National Archives (FO 925/4111, folio 11).


From IanVisits

A rare map of the Arctic Ocean held at The National Archives may contain some of the earliest colour images ever produced of Father Christmas.

Found inside a volume of John Seller’s Atlas Maritimus, the custom-made chart dates from around 1675.
Significantly this is also just a few years after the restoration of the Monarchy, and the overthrowing of the ban on Christmas that was introduced by the Puritans.

At the time also Father Christmas wasn’t seen as a gift-giving figure in the style of Santa Claus as we think of today, but as a personification of the Christmas festival, not dissimilar to John Bull or The Green Man, or for Americans, Uncle Sam.

Back to the map, and in the 17th century, as part of the bespoke production process, buyers could choose from a selection of maps for their own volume of an atlas showing seas and coasts then known around the world.

Hand-tinting, applied as an extra service, made each chart unique.
Curiously, the particular choice of red colouring applied in this example may make it the first ever map to depict Santa in his customary red clothing.

On the right hand side of the chart, in Novaya Zemlya, a sleigh crosses the snowy wastes pulled by reindeer with a red-coated driver; another image on the lower right shows a figure dressed in red and white, leaning on the scale bar as if chatting with the polar bear.


The icy waters shown on this ‘Chart of the Sea Coasts of Russia Lapland Finmarke Nova Zemla and Greenland’ lie to the extreme north of Europe, chiefly within the Arctic Circle.
These are the ‘seas of the midnight sun’ where the sun shines day and night in the middle of the short summer.
The lower edge of the chart shows the northern shores of Scandinavia at left – Norway and Lapland – on the White Sea, with Archangel in the centre lower edge, and the coastline then sweeps to the right across the top of north-west Russia to Novaya Zemlya.

This chart was not intended for navigation.
It lacks information useful to mariners, such as soundings, warnings of rocks and sandbanks, and the locations of harbours.
The space is filled instead with decorative details.

What is marked as Greenland at top left of the whole chart is really its eastern neighbour, Spitsbergen. ‘Finmarke’ is part of modern Norway, ‘Corelia’ (Karelia) lies to right of the prancing goat, while Lapland forms the ‘nose’ of the horse’s head shape.

Pictures of ships and a blowing whale at top centre, plus compass roses, and ornate cartouches for title and scale, were designed to appeal to an expanding market for charts among the nobility and gentry of Europe.

For those with an interest in the origins of Christmas, however, it may chart the beginnings of what became the fable of Santa Claus.
The red decorative details of the two figures dressed as Father Christmas are perhaps what bring a legend to life.

Sunday, December 24, 2017

How do the oceans assist in removing carbon dioxide from the atmosphere?


 Carbon dioxide ocean–atmosphere exchange
Atmospheric carbon dioxide is the most important human-made greenhouse gas responsible for global warming.
Oceans assist in removing carbon dioxide from the atmosphere: phytoplankton accumulate carbon dioxide through photosynthesis and their chlorophyll colours the ocean’s waters.
Satellites use this colour to measure chlorophyll, which helps scientists to calculate how much carbon dioxide is absorbed or emitted. 
Planetary Visions (credit: ESA/CCI Ocean Colour/Climate Monitoring User Group/Planetary Visions) 

 CO2 Monitoring Task Force presents architecture and definition of an operational system capacity for Anthropogenic CO₂ Emissions Monitoring & Verification Support.

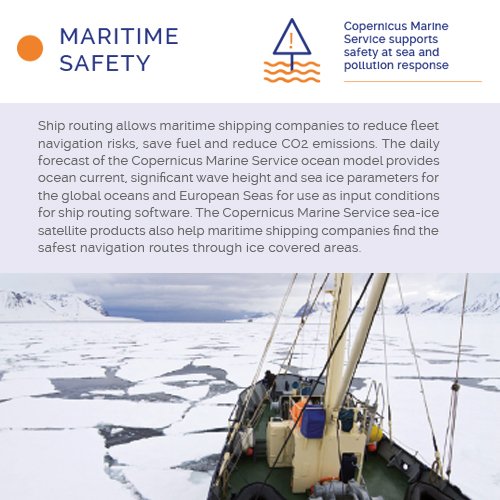
 Use case of Copernicus Marine Service : save fuel, reduce CO2 emissions, safest navigation

Links :