Saturday, November 26, 2016

4.1 Miles

A coast guard captain on a small Greek island is suddenly charged with saving thousands of refugees from drowning at sea.

From New York Times  by Daphne Matziaraki

When I returned home to Greece last fall to make a film about the refugee crisis, I discovered a situation I had never imagined possible.
The turquoise sea that surrounds the beautiful Greek island of Lesbos, just 4.1 miles from the Turkish coast, is these days a deadly gantlet, choked with terrified adults and small children on flimsy, dangerous boats.
I had never seen people escaping war before, and neither had the island’s residents.
I couldn’t believe there was no support for these families to safely escape whatever conflict had caused them to flee.
The scene was haunting.

Regardless of the hardship Greeks have endured from the financial crisis, for a long time my home country has by and large been a peaceful, safe and easy place to live.
But now Greece is facing a new crisis, one that threatens to undo years of stability, as we struggle to absorb the thousands of desperate migrants who pour across our borders every day.
A peak of nearly 5,000 entered Greece each day last year, mainly fleeing conflicts in the Middle East.

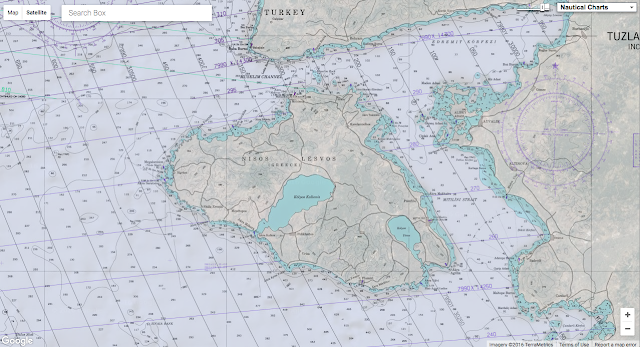
 Lesbos island (NGA chart in the GeoGarage platform)

The Greek Coast Guard, especially when I was there, has been completely unprepared to deal with the constant flow of rescues necessary to save refugees from drowning as they attempt to cross to Europe from Turkey.
When I was there filming, Lesbos had about 40 local coast guard officers, who before the refugee crisis generally spent their time conducting routine border patrols.
Most didn’t have CPR training.
Their vessels didn’t have thermal cameras or any equipment necessary for tremendous emergencies.
Suddenly, the crew was charged with keeping the small bit of water they patrolled from becoming a mass grave.

Each day, thousands of refugees crossed the water on tiny, dangerous inflatable rafts.
Most of the passengers, sometimes including whoever was operating the boat, had never seen the sea.
Often a motor would stall and passengers would be stranded for hours, floating tenuously on a cold, volatile sea.
Or the bottom of a dinghy would simply tear away and all the passengers would be cast into the water.
The coast guard felt completely abandoned, they told me, as if the world had left them to handle a huge humanitarian crisis — or allow thousands to drown offshore.
I followed a coast guard captain for three weeks as he pulled family after family, child after child, from the ocean and saved their lives.
All the ones in this film were shot on a single day, October 28, 2015.
Two additional rescues happened that same day but were not included.

The problem is far from over.
Many of the refugees come from Syria, where Russia is intensifying bombings that are killing thousands of civilians and devastating Syrian cities.
The United States is planning to respond.
According to the Greek Coast Guard, thousands of families with children are lining up along Turkish shores to make the unsafe crossing to Greece.

In making this film, I was struck by the fine lines that separate us, the moments when our paths cross fleetingly, and we look at one another for the first time and sometimes for the last.
This film shows that crucial moment between life and death, where regardless of political beliefs, fears or preparation, some people will go beyond themselves to save a stranger.

And it raises questions about our collective responsibility — the choices we all make for ourselves, and for others.
We don’t all confront the refugee crisis with the same immediacy as the coast guard captain portrayed here.
But as our world becomes more interconnected, and more violent, we do all face a choice — would we act as he does, to save the life of stranger?
Or would we turn away?

Links :

Friday, November 25, 2016

The grounding and sinking of MV 'Minna'

Resolution island with the GeoGarage platform (NGA chart)

From Hydro by David H. Gray


The high cost of exploration in subarctic, often uncharted, waters was demonstrated in an unorthodox but convincing way by the 1974 grounding and sinking of the MV Minna off Resolution Island [Canada] while conducting a combined hydrographic-geophysical survey in the northern Labrador Sea.

Minna aground at the left of photo, and the large panel radar arrays on the mountain top — in Resolution Island (Nunavut).
photo : John Newton

Minna was an 83.6m long (274ft), ice-strengthened freighter built in 1960 at Arendel, Norway, as MV Varla Dan and subsequently sold to the Karlsen Shipping Company of Halifax who changed her name.
Bedford Institute of Oceanography (BIO) in Dartmouth, Nova Scotia, Canada, chartered her in 1972, 1973, and 1974 for deep-sea hydrographic and geophysical surveys in the Labrador Sea.
Given that she was only carrying survey equipment, 300 tons of concrete ballast, and was light on fuel, her displacement at the time of the grounding would have been about 3000 tons.

Austron 5000 LORAN-C receiver (with visor over the oscilloscope), PDP-8 computer, and paper tape reader.
In the right-hand rack, third and fourth pieces from the top

The Survey Equipment

Navigation for hydrographic and geophysical surveys on the Minna was obtained from:
  1. Two range DECCA-LAMBDA 12-f, with Master transmitter on the Minna. The slave stations were on Spotted Island east of Cartwright, Labrador, and on Resolution Island.
  2. Rho-rho LORAN-C, which used an Austrom 5000 LORAN-C receiver and an atomic clock to predict the instant of transmission from the LORAN-C stations at Cape Race, Newfoundland, and from Angissoq, Greenland.
  3. A Marconi Doppler satellite receiver to establish a position every few hours to verify the DECCA ‘lane count’ and to determine the clock rate (microseconds/day) of the atomic clock on the Minna versus the ones at Cape Race and Angissoq. Doppler satellite positioning needed accurate ship’s velocity during the 20 minutes of the satellite passing overhead, which was provided by DECCA and/or LORAN-C.
The geophysical survey equipment included a magnetometer, three marine gravity meters, and one land gravity meter.
Two sizes of air guns and a 100-foot (30m) towed streamer with acoustic microphones connected to receivers were used for collecting seismic reflection data.

Most of this equipment was in a purpose-built unit designed and built at Bedford Institute and lowered into #2 Hold, which became the ‘survey office’.

 MV Minna hard aground at high tide — in Resolution Island (Nunavut).
photo : John Newton

Before the Grounding

The Minna visited Godthåb (now Nuuk), Greenland, for engine repairs and to verify the marine gravimeters against land-based gravity readings.
Departing Godthåb on 16 August, she ran a line of soundings towards Saglek, Labrador, then, at 08:00 on 18 August 1974, she entered Brewer Bay near the Northeast corner of Resolution Island to pick up electronic technicians who had installed a DECCA Slave transmitter on the island and then to establish the lane count.
The wind was from the Southeast to South-Southeast at Force 4 creating a swell of 1.3m.
The Bay

The navigable portion of Brewer Bay is about 240 metres wide by 600 metres with a maximum depth of 22 fathoms (40m).
The bay is surrounded by high hills providing little shelter and it experiences heavy ground swell and a circular tidal stream when near high water.
A landing beach is located in a cove on the south shore of the bay where supplies are landed annually and temporarily stored for the radar station on Cape Warwick just north of the bay.

 CCGS Griffon maneuvering to attempt to pull MV Minna off the rock.
Image courtesy: Steve Grant

The Tide

Because Minna had a single propeller and no bow thruster, her normal turning radius was large.
The ship was riding high due to low fuel and light load and was adversely affected by the SE wind causing her to have an even larger turning radius.
Accordingly, she went outside of the surveyed area while turning.
Because of forward motion and being blown sideways, she grounded on a rock pinnacle at 09:34.
At the time of grounding, the tide was dropping but still 3.1m above datum.
A sounding by lead line on the ship’s starboard (seaward) side, just aft of where the pinnacle pierced the ship’s outer hull, found no bottom; however, the ship’s sounder showed a depth of 25 fathoms.

 CCGS Griffon tends to the wreck at low tide
photo : John Newton

The Re-floating Attempts

Having assessed the situation, the captain ordered full astern at 11:00 (height of tide now 1.8m above datum), but the stern of the ship merely turned to port, thus coming closer to being parallel to the cliff, and failed to come off the pinnacle.
To return the ship to the original heading, the captain ordered full port rudder and went forward, driving the ship farther onto the rock.
By 13:00, CCGS Griffon, a buoy tender & light icebreaker, was proceeding to Brewer Bay to provide assistance.
At 19:30 (height of tide 5.5m above datum) and again at 20:20 (height of tide now 4.8m) the Griffon tried to pull while the Minna applied full reverse, but at both times the lines parted.
On the second attempt, the broken end of the hawser fouled Minna’s propeller, thereby reducing later attempts by the Griffon acting alone.
The Griffon tried a third time at 21:15.
Only at 21:30, did the crew begin lifting some of the concrete blocks from #1 Hold.
Around 23:00, it was reported in the deck log that #2 Hold was dry but #1 Hold was flooded – an indication that the ship was becoming more damaged.

Lightening the Load

The removal of cement blocks ceased at 06:00 on 19 August owing to water rising in #1 Hold, so the hatch was covered and the booms lowered.
Three more times Griffon attempted to pull Minna off the rocks; all attempts failed.
The heavy sea and swell and the wind from the Southeast (i.e., directly from the open ocean) caused the ship to keep striking heavily on the rocks.
At 13:00, they attempted to take the hatch-cover off #2 Hold to hoist the survey equipment from the Hold, but the hinges gave out, negating that course of action – another indication that the ship was breaking apart.
The crew and the BIO staff were transferred to shore and were not particularly welcome guests at the radar site, at least until some of the ship’s provisions (especially the duty-free alcohol) were brought up from the landing beach.
Between 18 and 20 August, the BIO staff returned to the ship during periods of high tide and man-handled all the moveable equipment through the ship, up the gangways, onto the deck, and then lowered it down into the BIO barge for transfer to shore.
Nine personnel were flown to Frobisher Bay (now Iqaluit) by chartered aircraft on 20 August and to Halifax by commercial airlines the next day. CCGS Norman McLeod Rogers (buoy tender/light icebreaker) arrived to take nine of the ship’s personnel to Frobisher Bay on 21 August to get flights to Halifax.

The Retrieval of the Equipment

The scientific equipment, which had been removed from the ship, was stored in a shed near the beach. Fortunately a squadron from the Royal Canadian Navy was exiting Hudson Strait and was called upon for assistance.
HMCS Assiniboine and Saguenay [destroyers] arrived on 22 August and HMCS Preserver [supply ship] on 23 August, but the squadron commander was not going to risk his ships going into such a small bay.
Nevertheless, the Navy retrieved the off-loaded equipment by sea-boat or Sikorsky Sea King helicopters to the Preserver and ultimately returned it to Bedford Institute.
Three of the survey staff went to Newfoundland on the naval ships.
The chief scientist and nine others stayed to dismantle the DECCA Slave station and on 26 August flew to Halifax via Frobisher Bay.
On 19 September 1974, CSS Baffin [hydrographic ship] retrieved the DECCA equipment from the shore and more of the equipment from the Minna.

The End

A Norwegian ocean-going tug arrived before 5 September, but waited until the next Spring High Tide on 15 September but the tug was not successful in freeing her.
On September 19, the Karlsen Shipping Company and its insurers declared the ship abandoned as no salvage company was interested in rescuing her.

Notice to Mariners

The yearly sealift of goods to the Northern Warning System station on Cape Warwick reported in June 1998 that the wreck of the Minna had slipped into deeper water because of ice action.
A Notice to Mariners was immediately issued instructing mariners to add a dangerous wreck symbol to the 1963 Edition of CHS chart 5430 and on its inset of Brewer Bay, at 61° 34′ 56.0ʺN, 64° 38′ 23.0ʺW (local datum).
Also, a multibeam hydrographic survey with full bottom coverage positioned by GPS was carried out late that summer.
The 2005 New Edition of the chart incorporates the 1998 survey both on the main chart (for the approaches to Brewer Bay) and for the entire inset of Brewer Bay.
The main chart shows the more normal wreck symbol whereas the inset uses the wreck symbol appropriate for large-scale charts near the north shore of the bay at 61° 35′ 17.5ʺN, 64° 37′ 53.5ʺW (NAD-83) with the bow facing northwest and drying (i.e., visible) at low tide.
The present Sailing Directions, published 2009, cautions mariners that “ice action has shifted the wreck; the exact position and depth over [the wreck] are not known.”

Figure 1: The inset of Brewer Bay on CHS Chart 5340 (Approaches to Sorry Harbour) showing Minna at 61° 35′ 17.5ʺN, 64° 37′ 53.5ʺW.
Soundings are in fathoms and feet, heights above chart datum (low water) are underlined and are in feet.

The Chart

The 1963 Edition of Chart 5340 was based on a 1952-3 US Navy survey, where its geographic grid was based on an astronomically determined survey point.
The topography on the chart was from aerial photography taken about the same time.
A New Edition of the chart was required to incorporate the 1998 CHS survey and so the chart was converted to NAD-83 so that it would be compatible with GPS positioning.
The shift in the geographic grid accounts for most of the 795 metres between the two positions quoted above.
The magnitude of this shift is typical for charts that are based on exploratory quality astronomic positions.

 Figure 4: Air photo taken 18 August 1976 showing Minna lying on her starboard side, bow to the southwest, stern to the northeast.
Image courtesy: National Air Photo Library, Roll A24530, Frame 9.

Air Photos

Air photos taken in 1976 show the Minna lying on her starboard side, bow to the southwest and stern to the northeast.
In the 1987 air photos, the ship is not visible above water, but the water tones suggest that the ship is submerged at its 1976 position, although the orientation may be reversed.
In the 1993 air photos, the ship is not visible, although there may be something in the water at the 1976 position.
Google Earth, which uses a July 2006 satellite imagery, shows shallow water at the wreck’s charted location.
These series of photographs pose two questions.
  1. Was the ship moving or rotating between these various epochs?
  2. Was the ship being naturally reduced to rubble by the action of wind, waves and ice?
Perhaps the apparent movement in the air photos and the situation as found in the 1998 survey, are the reasons for the Sailing Directions’ caution note and the continuance of the ‘Position Approximate’ on the inset of the chart.

Some Thoughts

Given modern capabilities of 100% bottom coverage and remotely controlled underwater vehicles, it would be interesting to evaluate the damage done by sea-ice on the hull of the Minna after 40-plus years.
Scott and Shackleton logbooks prove Antarctic sea ice is not shrinking 100 years after expeditions


From The Telegraph by Sarah Knapton

Antarctic sea ice had barely changed from where it was 100 years ago, scientists have discovered, after poring over the logbooks of great polar explorers such as Robert Falcon Scott and Ernest Shackleton.
Experts were concerned that ice at the South Pole had declined significantly since the 1950s, which they feared was driven by man-made climate change.
But new analysis suggests that conditions are now virtually identical to when the Terra Nova and Endurance sailed to the continent in the early 1900s, indicating that declines are part of a natural cycle and not the result of global warming.

 Scott's ship the Terra Nova

It also explains why sea ice levels in the South Pole have begun to rise again in recent years, a trend which has left climate scientists scratching their heads.
"The missions of Scott and Shackleton are remembered in history as heroic failures, yet the data collected by these and other explorers could profoundly change the way we view the ebb and flow of Antarctic sea ice,” said Dr Jonathan Day, who led the study, which was published in the journal The Cryosphere.

 The Endurance, trapped in sea ice

"We know that sea ice in the Antarctic has increased slightly over the past 30 years, since satellite observations began. Scientists have been grappling to understand this trend in the context of global warming, but these new findings suggest it may not be anything new.
"If ice levels were as low a century ago as estimated in this research, then a similar increase may have occurred between then and the middle of the century, when previous studies suggest ice levels were far higher."
 Captain Scott and team

The study was based on the ice observations recorded in the logbooks from 11 voyages between 1897 and 1917, including three expeditions led by Captain Scott, two by Shackleton, as well as sea-ice records from Belgian, German and French missions.
Captain Scott died along with his team in 1912 after losing to Norwegian Roald Amundsen in the race to the South Pole, while Shackleton's ship sank after becoming trapped in ice in 1915 as he and his crew attempted the first land crossing of Antarctica.
The study is the first to calculate sea ice in the period prior to the 1930s, and suggests the levels in the early 1900s were between 3.3 and 4.3 million square miles (5.3 and 7.4 million square kilometres)
Estimates suggest Antarctic sea ice extent was significantly higher during the 1950s, before a steep decline returned it to around 3.7 million miles (6 million square kilometres) in recent decades which is just 14 per cent smaller than at the highest point of the 1900s and 12 per cent bigger than than the lowest point.

 One of the first aerial photographs of the Antarctic obtained from a balloon in 1901, showing Erich Von Drygalski's ship The Gauss

The findings demonstrate that the climate of Antarctica fluctuated significantly throughout the 20th century and  indicates that sea ice in the Antarctic is much less sensitive to the effects of climate change than that of the Arctic, which has experienced a dramatic decline during the 20th century.
In future the team plans to use data from naval and whaling ships as well as the logs from Amundsen’s expeditions to complete the picture.
Separate research by the British Antarctic Survey also showed that the present day loss of the Pine Island Glacier on the West Antarctic Ice Sheet has been happening since the mid 20th century and was probably caused by El Nino activity rather than global warming.
Pine Island Glacier, which drains into the Amundsen Sea in West Antarctica, is retreating and thinning rapidly, but the initial triggering mechanism was unclear.
The team looked a sediment cores in the area which showed that an ocean cavity under the ice shelf began to form around 1945, following a pulse of warmth associated with El Niño events in the tropical Pacific Ocean.
“We are very excited about this new finding as it provides the first direct evidence of the timing of glacier retreat even before we had satellites to measure them,” said lead author, marine geologist Dr James Smith from British Antarctic Survey.
“They show us how changes half-way across the planet in the tropical Pacific, reached through the ocean to influence the Antarctic ice sheet.”
Co-author Professor Bob Bindschadler of NASA added: “A significant implication of our findings is that once an ice sheet retreat is set in motion it can continue for decades, even if what started gets no worse.
“It is possible that the changes we see today on Pine Island Glacier were essentially set in motion in the 1940s.”
The Pine Island research was published in Nature.

Links :

Thursday, November 24, 2016

New Zealand Linz update in the GeoGarage platform

Wellington Harbour, one of the 13 nautical raster charts updated by Linz
see : News

Model upgrade brings sea-ice coupling and higher ocean resolution

The higher ocean resolution for ensemble forecasts in IFS Cycle 43r1 results in forecast fields that reveal more detailed features and fit more snugly along coastlines.
This is illustrated by these forecasts of daily mean sea-surface temperature for 18 November 2016, initialised at 00 UTC on the same day, using the previous model version (top) and the new model version (bottom).

From ECMWF

ECMWF implemented a new version of its forecasting system on 22 November, which introduces a dynamic sea-ice model and increases the resolution of the ocean model.
These and other changes to the Integrated Forecasting System (IFS) significantly improve the Centre’s weather predictions.
The interactive sea-ice model in the new IFS Cycle 43r1 is used to produce ensemble forecasts in which the atmosphere, oceans and sea-ice are dynamically coupled.
Ensemble forecasts provide a range of likely scenarios and give an indication of the degree of confidence we can have in the forecast.

Forecast of daily mean sea-surface temperature for 18 November 2016,
initialized at 00 UTC on the same day, using IFS Cycle 43r1.
 
Bringing additional Earth system components into the model and developing ECMWF's ensemble forecast capabilities are important elements of the Centre's new ten-year Strategy.
Introducing interactive sea ice also makes it possible to predict changes in sea-ice cover during the forecast. In the previous model version, sea-ice cover was left static up to forecast day 15.

Dynamic predictions of sea-ice cover produce very different results from the assumption of static sea-ice cover.
This is illustrated by this two-week ensemble forecast from 2 November 2016 (blue lines), which shows a significant evolution from the initial conditions (dashed orange line).
Subsequent verification (pink line) shows that the dynamic forecast is much closer to observations than the static sea-ice cover.
The spread of the blue lines gives an indication of the range of likely scenarios given inevitable uncertainties in the evolution of atmospheric and ocean conditions.

The sea-ice model is LIM2, the Louvain-la-Neuve Sea Ice Model developed at the Belgian Université catholique de Louvain.
It is part of the NEMO (Nucleus for European Modelling of the Ocean) modelling framework also used at ECMWF to model the ocean.
In another significant development, the resolution of the ocean model used in ensemble forecasts has gone up from 1 degree and 42 layers to 0.25 degrees and 75 layers.
This means that small-scale ocean circulation features are better captured and coastlines are better resolved than previously.

Other innovations include changes in the representation of some low-level clouds to reduce cloud cover bias, and in the coupling between the surface and the atmosphere to improve 2-metre temperature forecasts.
There are new cloud and freezing level output fields for aviation; a new sun-following radiation output for solar panels; and eight new wave model output fields, including the magnitude and direction of the wave energy flux that is responsible for the impact of waves on coastlines and offshore structures.

Better weather forecasts

Improvements in forecast skill can be seen in a range of weather parameters.
These include 2-metre temperature, in particular in ensemble forecasts, and 10-metre wind speed over the ocean.
There are also consistent gains for total cloud cover in the tropics as well as the extra-tropics.
In particular, IFS Cycle 43r1 reduces the model’s tendency to predict too much cloud at high latitudes during winter.

Improvements in cloud cover bias are particularly noticeable at high latitudes.
The plot shows the percentage change in total cloud cover bias in the new IFS cycle for 48-hour forecasts compared to observations for the period November 2015 to January 2016.
Negative values mean a reduction in bias; -100% means the bias has been completely eliminated over that period.
 
The new IFS cycle brings a range of other changes which improve the performance of specific parts of the forecasting system, including indications of severe weather.
The Extreme Forecast Index (EFI) flags up the risk of extreme weather compared to a reference climate for the relevant region and time of year.
One of the changes in IFS Cycle 43r1 is a more accurate representation of the reference climate. This leads to the elimination of spurious EFI signals in some situations.

The charts show 10-day EFI forecasts for 2-metre temperature at the northern tip of the Red Sea initialised on 8 November 2016. In IFS Cycle 43r1, the representation of the EFI reference climate has been improved.
Spurious EFI signals in the previous version (left) are thus avoided in the new version (right).

The modelling changes, together with changes in data assimilation and in the use of observations, also bring improvements to high-resolution and ensemble forecasts of upper-air parameters.
In the extra-tropics, error reductions in the order of 0.5–1% are found for most upper-air parameters and levels.
These reductions translate into improvements in ECMWF’s primary headline scores:
  • The gain in the skilful range of ensemble forecasts of 850 hPa temperature in the extra-tropical northern hemisphere (defined as the lead time at which the Continuous Ranked Probability Skill Score drops below 25%) is about 0.5 hours.
  • The gain in the skilful range of high-resolution forecasts of 500 hPa geopotential in the extra-tropical northern hemisphere (defined as the lead time at which the anomaly correlation drops below 80%) is about 1 hour.
Full details of all the changes in this model cycle are available on the web page on the implementation of IFS Cycle 43r1.

Wednesday, November 23, 2016

A name directory for the ocean floor

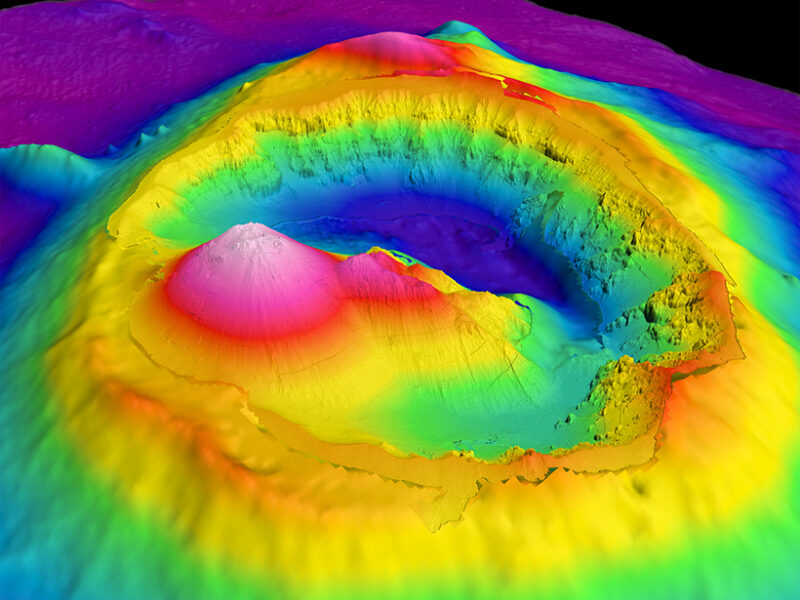
Bathymetry image of Brothers Seamount and caldera, an undersea volcano about 3 kilometers in diameter off the coast of New Zealand.
Autonomous underwater vehicles acquired high-resolution (2-meter) bathymetry data inside the caldera.
Surface ships mapped the lower-resolution (25- to 30-meter) bathymetry data on the surrounding volcano flanks.
This feature was formally named using tools provided by the General Bathymetric Chart of the Oceans (GEBCO).
Credit: S. Merle (NOAA/PMEL)

From EOS by By , Hans Werner Schenke, and Yasuhiko Ohara

The Izu-Ogasawara Trench, a deep-sea trench south of Japan, was discovered in 1933 and named after the nearby Ogasawara Islands.
However, the Ogasawara Islands have also been called the Bonin Islands: They are the type locality for the volcanic rock boninite [Crawford, 1989].
Consequently, the Izu-Ogasawara Trench is often incorrectly and confusingly referred to as the “Izu-Bonin Trench.”
Newly discovered undersea features are often given informal names that over a period of years, with repeated use, become incorporated into maps and scientific papers.
Historically, this has sometimes led to confusion and misidentification.
Occasionally, one name has been used for several different features, or a single feature has been named independently by different groups, resulting in several different informal names.
One might think that with the rise of global communications and data-sharing networks, this problem might resolve itself.
However, new ocean exploration technologies are exacerbating this old problem by adding to the inflow of new information.


An increasing number of ships now routinely survey our oceans, and we are learning more about the seafloor and its features.
The rapid developments in multibeam sonar technology and the deployment of these instruments on remotely operated vehicles (ROV) and autonomous underwater vehicles (AUV) mean that some features only tens of meters in relief are now being mapped and named.
To ensure that these features’ names don’t get renamed on subsequent cruises, scientists turn to a reliable tool: the General Bathymetric Chart of the Oceans (GEBCO) Gazetteer online interactive map.
This map is supplemented with other online resources, including naming guidelines, links to proposal forms, and a glossary.
GEBCO’s Sub-Committee on Undersea Feature Names (SCUFN) is also developing new Web applications to facilitate collaboration and coordination for naming undersea features within the world’s oceans.
These future applications, plus the new Web supplemental resources, will assist users in completing name proposals and should help speed up the review and approval process.

 Louisville seamounts

The GEBCO Gazetteer

GEBCO, an international group of experts in ocean surveying and mapping, established SCUFN in 1975 when the need became apparent for a uniform policy for the handling and standardization of undersea feature names.
GEBCO’s aim is to provide the most authoritative publicly available bathymetry of the world’s oceans, including undersea feature names.SCUFN reviews name proposals for undersea features that lie entirely or mainly (more than 50%) outside the external limits of territorial waters.
The subcommittee comprises a multinational group of hydrographers and Earth scientists. SCUFN is supported by a secretariat based at the International Hydrographic Organization in Monaco, which coordinates its activities and maintains the GEBCO Undersea Feature Names Gazetteer.
This gazetteer contains a list of more than 3800 named features throughout the oceans.
Several national naming authorities and geographic naming boards also maintain separate gazetteers that include names of undersea features outside territorial waters, and SCUFN endeavors to harmonize the GEBCO Gazetteer with these names.
The gazetteer enables users to search and view features quickly.
It also provides further metainformation (where it is available) about feature dimensions, the discoverer, and the origin of the name.
Proposers of new undersea feature names or journal reviewers can use this resource to ensure that names are not duplicated or features are not already named.

 This image shows over 14,000 large seamounts identified from a mid-resolution bathymetric map, using methods outlined in Kitchingman and Lai (2005).
There are more small seamounts, but their distribution should be roughly similar to that shown here.

Proposing Undersea Feature Names

People who want to propose names for new features should use the GEBCO undersea feature names website.
This site describes the role of SCUFN and has useful links to proposal forms, naming guidelines, and meeting reports.
The SCUFN guidelines for naming features are given in the “Standardization of Undersea Feature Names,” International Hydrographic Organization Publication B-6, which is available in six languages.
This publication includes information about proposals along with examples of supporting documentation, including maps and images depicting the features.
Undersea feature names have two parts: a specific term and a generic term.
The specific term should primarily relate to nearby onshore or offshore features, the discovery ship, or an eminent maritime figure, explorer, or scientific researcher.
Other specific terms may be given to recognize cultural icons or traditions.
The generic term relates to the geometrical form of the feature (escarpment, seamount, trench, etc.) or, in special cases, the genesis of the feature. SCUFN regularly reviews generic terms, adding new terms as they become established in scientific usage and abandoning older terms that have fallen out of use.
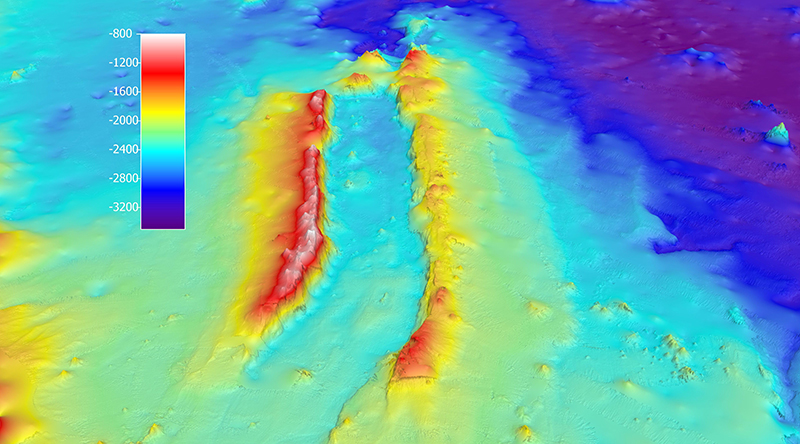
For example, the Adare Trough, located in the Ross Sea off the coast of Oates Land, Antarctica, is a flat-bottomed depression with symmetrical, parallel sides that is more than 100 kilometers long.
The specific term “Adare” is from the nearby Cape Adare, and the generic term “trough” describes the morphology of the feature.

 The Adare Trough, located in the Ross Sea off the coast of Oates Land, Antarctica, has the specific name “Adare” that refers to the nearby Cape Adare and the generic name “trough” that describes the morphology of the feature.
The color scale gives the elevation in meters.
Credit: GNS Science

Several features in the GEBCO gazetteer have generic terms that are no longer recommended but are maintained to harmonize names with other gazetteers.
Definitions for generic terms, including example images of feature types, are now readily available on a new website.
This resource allows those proposing new undersea feature names to identify the correct generic term for the features they find.
Currently, proposals are emailed directly to the SCUFN secretariat (info@iho.int), where they are uploaded onto a Web application and shared with subcommittee members for review.
Final approval of proposed names is made at the annual SCUFN plenary meeting.
SCUFN members consider proposals in the chronological order of submission: Late proposals will be considered last if there is sufficient time at the plenary meeting.
For each of the past 5 years, SCUFN has reviewed between 70 and 200 names.
In 2016, the subcommittee reviewed 206 feature names, and 144 of these will be added to the GEBCO Gazetteer.

Mapping, Classifying, and Protecting Seamounts (GRID Arendal)
What are seamounts?
How are they mapped?
How are they classified?
How can we use these spatial data to protect marine environments?
These are some of the questions highlighted in this story map. 

Future Goals

We plan to enable users to submit undersea feature name proposals to SCUFN via a new Web application using an online form or by uploading a completed proposal document with accompanying images.
SCUFN members can then immediately access these submissions to assess feature names and share comments about each proposal.
In this way, the new interface will help speed up SCUFN review and approval processes.
We expect to unveil this new Web tool in 2017.
The online submission tool will include a facility for submitting geographic information system files (GIS shapefiles) that can be used to help evaluate the proposal and can be incorporated into the Web map application.
Until that tool launches, we encourage users of undersea feature names in scientific literature and on bathymetric maps to access the current iteration of the gazetteer as well as resources connecting them to generic feature terms and naming guidelines.
Once proposals become more streamlined, we will be well positioned to meet our goal: to increase the number of feature names in the GEBCO Gazetteer and to make them readily available to the scientific community for publications and Web map services.

Links :

Tuesday, November 22, 2016

Obama administration blocks Arctic oil drilling through 2022


Oil and Ice: The Risks of Drilling in Alaska's Arctic Ocean
Produced by The Center for American Progress

From HuffingtonPost by Chris d'Angelo

Citing environmental risks, the Interior Department called the plan the “right path forward.”

Further cementing President Barack Obama’s climate legacy, the Department of the Interior announced on Friday its intent to ban oil drilling in the U.S. section of the Arctic Ocean for the next five years, citing environmental risks.

 
 Arctic sea ice has not only been shrinking in surface area in recent years, it’s becoming younger and thinner as well. In this animation, where the ice cover almost looks gelatinous as it pulses through the seasons, cryospheric scientist Dr. Walt Meier of NASA Goddard Space Flight Center describes how the sea ice has undergone fundamental changes during the era of satellite measurements.This visualization incorrectly identifies the oldest ice as being 5+ years old, when it would be more accurate to say 4+ years old.

The plan blocks the sale of new offshore oil and gas leases in the Beaufort and Chukchi seas, north of Alaska, between 2017 and 2022.
“The plan focuses lease sales in the best places ― those with the highest resource potential, lowest conflict, and established infrastructure ― and removes regions that are simply not right to lease,” Secretary of the Interior Sally Jewell said in a statement.
“Given the unique and challenging Arctic environment and industry’s declining interest in the area, forgoing lease sales in the Arctic is the right path forward.”

The Obama administration’s proposed five-year program for oil and gas had included 13 potential lease sales — 10 in the Gulf of Mexico and one each in Alaska’s Cook Inlet, Beaufort Sea and Chukchi Sea.
In March, the White House abandoned plans to include the Atlantic Coast in the upcoming sale.

The Interior Department’s final plan, which limits drilling during the five-year period to the Gulf of Mexico and Cook Inlet, is being met with mixed reactions from environmental groups calling on Obama to use his executive power to permanently protect the fragile Arctic.

The plan is a “significant win for Arctic and Alaskan communities and a strong step towards addressing climate change” but continues to leave the Gulf of Mexico at risk, San Francisco-based nongovernmental organization Rainforest Action Network told The Huffington Post in a statement.
“This move locks the Gulf into another five years of corporate giveaways ― with decades more of climate pollution, offshore oil spills, devastation to fisheries, and health impacts to local communities,” RAN Executive Director Lindsey Allen said.
“A true transition from fossil fuels doesn’t allow for energy sacrifice zones, especially when we know the climate can’t handle further fossil fuel development.”

Carter Roberts, president and CEO of the World Wildlife Fund, applauded the announcement, saying there’s no proven technology to safely drill in the Arctic, and no way to clean up oil if it were to spill in frozen waters.
He added that he hopes more permanent protection would follow.

Earlier this week, NextGen Climate urged Obama to use his executive authority to permanently protect the Arctic and Atlantic Oceans from such drilling, noting the “dangerous agenda” of President-elect Donald Trump.
“The Trump Administration has the potential to do serious damage to our climate ― but in the last few months of his presidency, President Obama can take concrete steps to secure his environmental legacy,” NextGen President Tom Steyer said in a statement, adding it would continue to flight against “Trump’s dark vision and dangerous plans for our country.”

Such presidential executive action would be separate from the leasing program.

Unsurprisingly, the oil and gas industry is disappointed by the announcement.
The American Petroleum Institute, an industry trade group, called the move “short-sighted” and “detrimental.”
“Our national energy security depends on our ability to produce oil and natural gas here in the U.S., and this decision could very well increase the cost of energy for American consumers and close the door on creating new jobs and new investments for years,” API President and CEO Jack Gerard said.
“We are hopeful the incoming administration will reverse this decision ― consistent with the will of American voters.”

The proposed expansion of oil and gas drilling in the Arctic and Gulf would result in climate-related social costs between $58.6 and $179.2 billion, according to a Greenpeace report released in June ― enough to potentially outweigh the economic benefits of selling the energy.
The plan still requires Jewell’s final approval, and would take effect July 1, 2017.

As he has promised to do with so many of Obama’s previous actions aimed at combatting climate change, Trump will likely try to do away with Arctic drilling ban.
After all, the Republican president-elect has said he believes climate change is a “hoax.”
Trump pledged in May to pull the U.S. out of the historic Paris climate agreement.
He has also said he would cut all federal spending for climate change research, cleaner technologies and aid for communities already threatened by climate impacts.
For guidance, he has turned to climate change denier Myron Ebell and fossil fuel lobbyist Mike McKenna to help with transition work at the Environmental Protection Agency and Department of Energy.
Furthermore, Trump has said he would increase America’s production of coal, oil and natural gas, as well as do away with Obama administration regulations aimed at cutting emissions.

Global security leaders have warned Trump that failing to fight climate change could prove disastrous to national security, leading to increased risks of violent conflict and economic instability.
Retired Maj. Gen. Paul Eaton, managing director of the Vet Voice Foundation, applauded Obama’s decision as a win for national security.
“Encouraging oil and gas development in the Arctic would compromise our national security by placing additional demands on our military and undermine one of the globe’s most pressing national security concerns ― climate change,” he said in a statement to HuffPost.

The proposed final plan makes available more than 70 percent of the economically recoverable resources, which Bureau of Ocean Energy Management Director Abigail Ross Hopper said is “ample opportunity for oil and gas development to meet the nation’s energy needs.”
The bureau said a number of factors went into the decision to remove the Arctic from the plan, including “ecological conditions, environmental risks and recent changes in industry interest.”
Jacqueline Savitz of Oceana said the announcement “demonstrates a commitment to prioritizing common sense, economics and science ahead of industry favoritism and politics as usual.”

Links :

Monday, November 21, 2016

Revolutionary weather satellite blasts off


The GOES-R series, NOAA's next-generation geostationary weather satellites, is a game changer. These satellites, beginning with the launch of GOES-R, will provide continuous imagery and atmospheric measurements of Earth’s Western Hemisphere, total lightning data, and space weather monitoring to provide critical atmospheric, hydrologic, oceanic, climatic, solar and space data.
These measurements will lead to significant improvements in the detection and observations of meteorological phenomena that directly affect public safety, protection of property and our GOES fleet in the GOES-R era nation’s economic health and prosperity.

 From The Verge by Loren Gush

An Atlas V rocket was all set 2 days ago to launch from Cape Canaveral, Florida, sending a NASA-built weather satellite into orbit.
It’s the GOES-R probe, and it’s being touted as a game changer for weather forecasting.
The spacecraft, which will also be operated by the National Oceanic and Atmospheric Administration, is supposed to provide incredible real-time images of developing storm systems, better than any satellite that has preceded it.


GOES-R will keep an eye on Earth’s weather as it orbits 22,000 miles above.
But how does your local weather forecaster know what GOES-R sees?
Learn how GOES-R’s data is used for your local weather forecast in this animated video.

GOES-R even has a lightning mapper on board

To do this, GOES-R — which stands for Geostationary Operational Environmental Satellite-R — will scan Earth’s skies five times faster than the other GOES satellites currently in orbit, with four times the spatial resolution.
“This means we’ll have better quality data at high resolution far more often than we do today,” Joe Pica, director of the Office of Observations at NOAA, said at a NASA press conference.
Such information will allow NOAA scientists to see developing weather systems in unprecedented detail, which will improve our tracking of tornadoes, hurricanes, and wildfires.
GOES-R even has a lightning mapper on board, meant to help forecasters know which storms are more severe than others.
The information the satellite receives will help refine seasonal and weather predictions, improve warning times before storms, as well as help plan the best flight routes for airplanes.


A rendering of GOES-R.
NOAA Satellites 

While GOES-R will tell us more about the climate of Earth, the satellite is also equipped to give us more information about what our Sun is up to as well.
Specifically, the probe will be able to measure the intensity of solar flares, which are responsible for causing “space weather” around Earth.
A flare is often accompanied by something called a coronal mass ejection (CME) — a huge burst of charged particles that shoots out from the Sun.
These CMEs can clash with our planet’s magnetic field, causing geomagnetic storms that mess with our satellites, communications systems, and even our power grid. GOES-R will be able to tell scientists whether a potentially problematic geomagnetic storm is headed our way.
In order to get all of this high quality weather information, GOES-R is headed to a geostationary orbit — a circular path about 22,000 miles above the Earth’s equator.
This is a preferred orbit for many communication satellites, because spacecraft moving along this path follow the rotation of the planet.
That way, they appear to be in the same spot in the sky at all times.
Once it gets to geostationary orbit, GOES-R will be renamed GOES-16 and begin its science operations in about a year.

Links :
  •  CNET : New GOES-R satellite features a camera that will provide near real-time high-resolution imagery
  • CNN : New satellite will vastly improve your weather forecast
  • Forbes : The GOES-R Weather Satellite Launches Saturday: 4 Reasons It's A Game Changer

Sunday, November 20, 2016

2016 deadliest year in the Mediterranean


From MOAS

Despite tireless efforts to save lives by both civil society and European navies, MOAS crews are witnessing search-and-rescue efforts in the Mediterranean becoming more challenging than ever.

The number of deaths this year has risen to almost 4,300 exceeding death tolls of past years.
While the number of people crossing the Mediterranean as a whole has decreased when compared to previous years, it must be noted that the number of people attempting the Central Mediterranean route – from Libya to Italy – has remained largely unchanged.

MOAS has seen its humanitarian efforts overwhelmed this year, largely due to the changing approach of smuggling networks. Whereas in past years, crossings were organised in more manageable trickles, perhaps a few a day, this year our crews have seen departures organised in large waves.

MOAS research and analysis suggests that this change in approach might be both an attempt to maximise opportunity and meet demand on the part of the smugglers.
The smuggling networks appear to be industrialising, with increased competition representing a new challenge for them in procuring enough rubber boats, engines, and fuel containers to meet the demand.

This is leading to unprecedented numbers of migrants and asylum seekers being placed on unseaworthy rubber boats.

“The combination of heavier loads and inferior quality is a recipe for disaster”, said MOAS Head of Operations Ian Ruggier.
“Rescue assets have had to deal with increased challenges. There is no doubt that the vessels are built to last a few miles to see people beyond Libyan territorial waters”.

As a result, it is almost certain that the true death toll is much higher than the recorded figure as it is highly likely that many boats sink without ever being reported.
It is now more challenging for rescuers to spot all the boats being sent in one wave, and then manage to rescue everyone.
There have also been incidents in which our crews have spotted vessels at night that had been at sea since the early morning, suggesting many other migrant boats may go unnoticed.

Over 30,000 people have already been saved since MOAS launched its first life-saving mission in 2014, and almost 19,000 have been rescued and assisted since June 2016 alone.

“Crossings in the Mediterranean will not be stopped by creating more borders or building walls and fences. There is no force based solution to migration. People will always find a way to come to Europe. There is an urgent need to manage the phenomenon rather than try to hide behind razor wire. For this to occur European leaders must stand up and be counted”, said MOAS director Pete Sweetnam.

MOAS continues to call for the creation of safe and legal routes to end the needless loss of life at sea and to guarantee protection and dignity for human beings in search of a better life.

Links :