GlobCurrent aims to advance the quantitative estimation of ocean surface currents from satellite sensor synergy and to demonstrate the impact and advancements through user-led scientific, operational and commercial applications.
This in turn, will highlight the advantages of satellite approaches and increase the uptake and exploitation of satellite ocean current measurements. The GlobCurrent project is funded by the Data User Element, which is a programmatic element of the 4th period of the European Space Agency's Earth Observation Envelope Programme.
Conceptual animation illustrates the wind damage associated with increasing hurricane intensity - courtesy of The COMET Program and the NOAA National Hurricane Center.
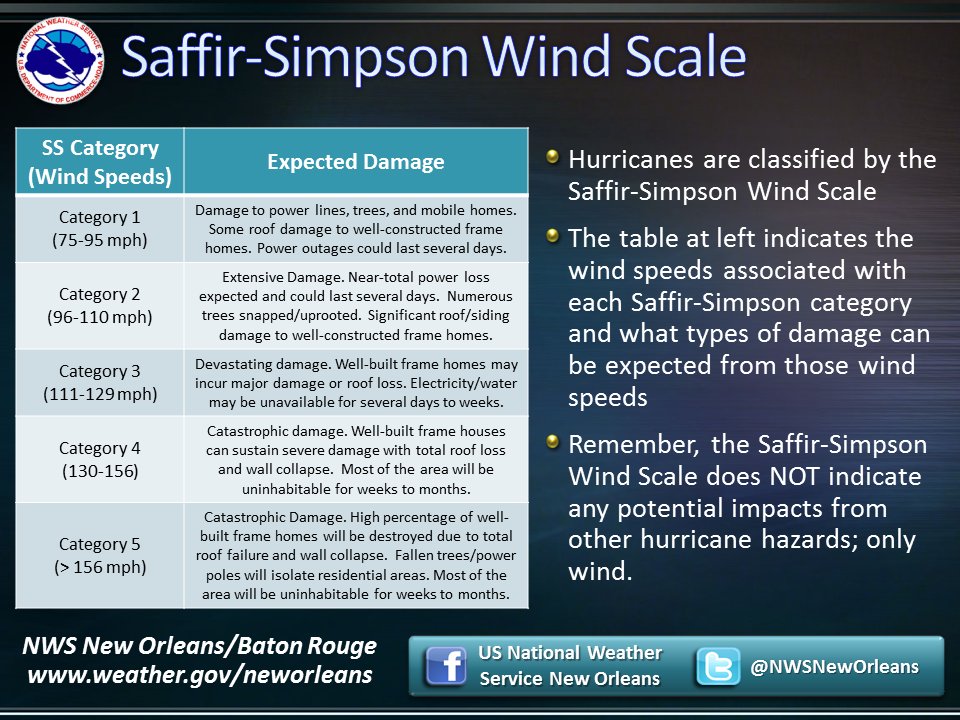
According to the National Hurricane Center, hurricanes reaching category 3 and higher are considered major hurricanes because of their potential for significant loss of life and damage.
Category 1 and 2 storms are still dangerous and require preventive measures.
Here is the breakdown of the categories based on wind speeds.
The Saffir-Simpson category describes only the WIND threat of a hurricane.
Category 1: Sustained winds of 74-95 mph
Category 1 storms are considered to have very dangerous winds and will produce some damage. Potential for damage includes:
Well-constructed frame homes could have damage to roofs, shingles, vinyl siding and gutters.
Large branches of trees will snap and shallowly rooted trees may be toppled.
Extensive damage to power lines and poles likely will result in power outages that could last a few to several days.
Category 2: Sustained winds of 96-110 mph
Category 2 storms are considered to have extremely dangerous winds that will cause extensive damage. Potential for damage includes:
Well-constructed frame homes could sustain major roof and siding damage.
Many shallowly rooted trees will be snapped or uprooted and block numerous roads.
Near-total power loss is expected, with outages that could last from several days to weeks.
Category 3 (major): Sustained winds of 111-129 mph
Category 3 storms have winds that will cause devastating damage. Potential for damage includes:
Well-built frame homes may incur major damage or removal of roof decking and gable ends.
Many trees will be snapped or uprooted, blocking numerous roads.
Electricity and water will be unavailable for several days to weeks after the storm passes.
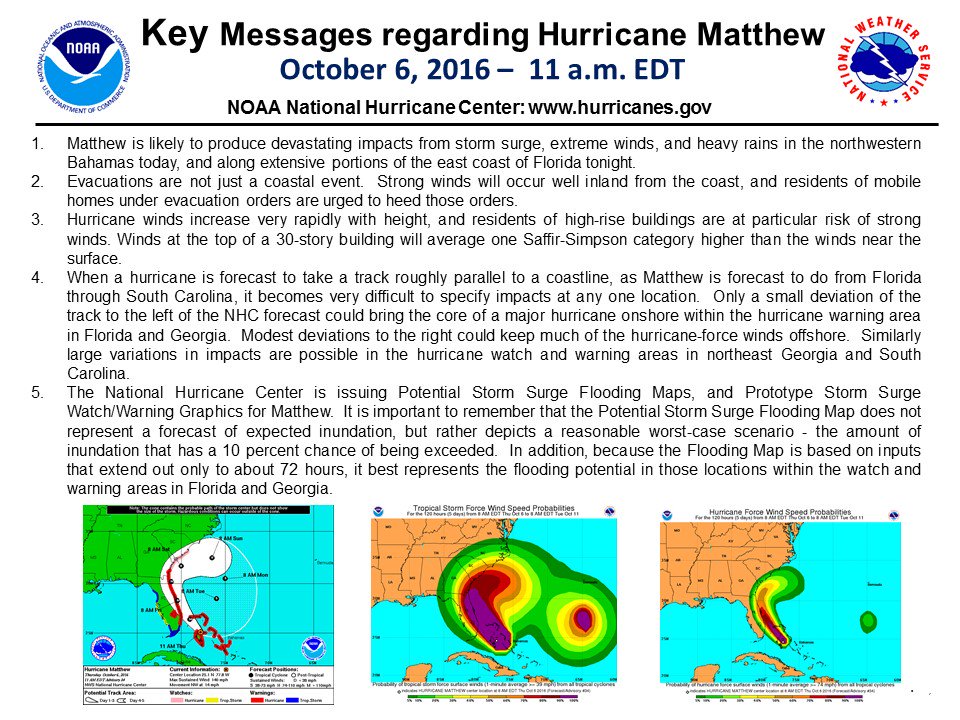
This animation of NOAA's GOES-East satellite imagery from Oct. 4 to Oct. 6 shows Hurricane Matthew making landfall on Oct. 4 in western Haiti and moving through the Bahamas on Oct. 6. TRT: 00:38.
Category 4 (major): Sustained winds of 130 - 156 mph
Category 4 storms have winds that will cause catastrophic damage. Potential for damage includes:
Well-built frame homes can sustain severe damage with loss of most of the roof structure and/or some exterior walls.
Most trees will be snapped or uprooted and power poles downed.
Fallen trees and power poles will isolate residential areas.
Power outages will last weeks to possibly months. Most of the area will be uninhabitable for weeks or months.
Category 5 (major): Sustained winds of 157 mph or higher
Category 5 storms have wind that will cause catastrophic damage. Potential for damage includes:
A high percentage of framed homes will be destroyed, with total roof failure and wall collapse.
Fallen trees and power poles will isolate residential areas.
Power outages will last for weeks to possibly months. Most of the area will be uninhabitable for weeks or months.
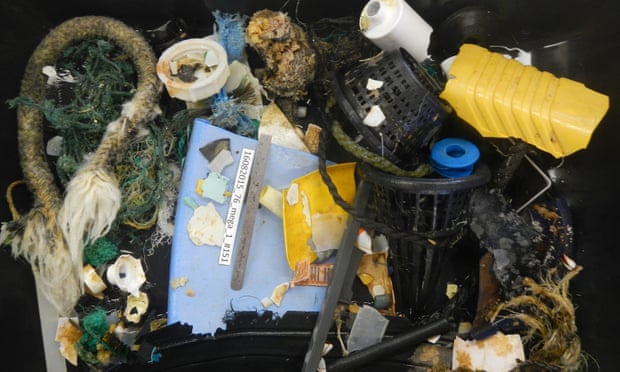
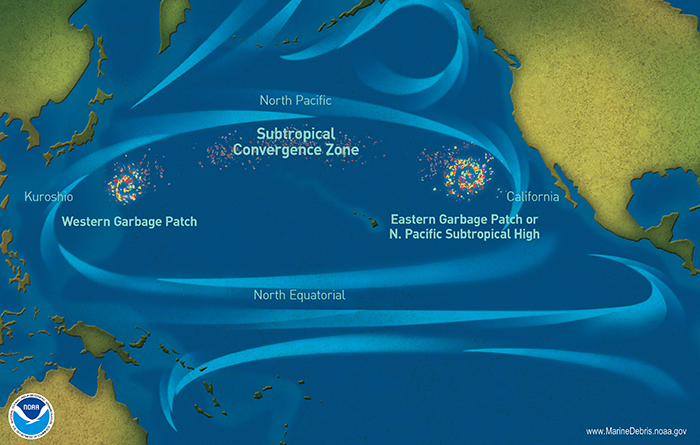
Giant collection of fishing nets, plastic containers and other discarded items called a ‘ticking time bomb’ as large items crumble into micro plastics
The vast patch of garbage floating in the Pacific Ocean is far worse
than previously thought, with an aerial survey finding a much larger
mass of fishing nets, plastic containers and other discarded items than
imagined.
A reconnaissance flight taken in a modified C-130 Hercules aircraft
found a vast clump of mainly plastic waste at the northern edge of what
is known as the “great Pacific garbage patch”, located between Hawaii and California.
The density of rubbish was several times higher than the Ocean Cleanup, a foundation part-funded by the Dutch government to rid the oceans of plastics, expected to find even at the heart of the patch, where most of the waste is concentrated.
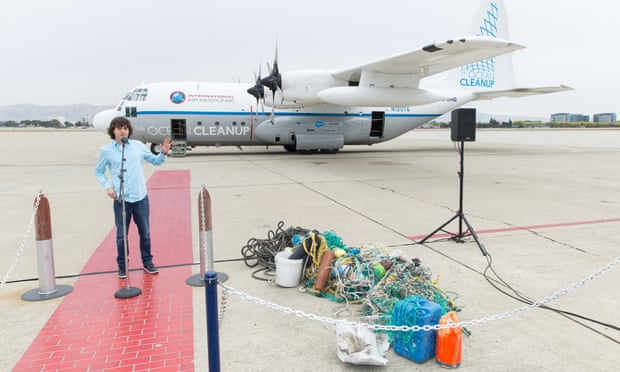
“Normally when you do an aerial survey of dolphins or whales, you
make a sighting and record it,” said Boyan Slat, the founder of the
Ocean Cleanup.
“That was the plan for this survey. But then we opened the door and
we saw the debris everywhere. Every half second you see something. So we
had to take snapshots – it was impossible to record everything. It was
bizarre to see that much garbage in what should be pristine ocean.”
Boyan Slat, founder of the Ocean Cleanup : aerial expedition, Ocean Force One tour
Photograph: The Ocean Cleanup
The heart of the garbage patch is thought to be around 1m sq km
(386,000 sq miles), with the periphery spanning a further 3.5m sq km
(1,351,000 sq miles).
The dimensions of this morass of waste are
continually morphing, caught in one of the ocean’s huge rotating
currents.
The north Pacific gyre has accumulated a soup of plastic
waste, including large items and smaller broken-down micro plastics that
can be eaten by fish and enter the food chain.
According to the UN environmental programme, the great Pacific
garbage patch is growing so fast that it, like the Great Wall of China,
is becoming visible from space.
Last year, the Ocean Cleanup sent 30 vessels to cross the patch to
scoop up micro plastics in fine nets to estimate the extent of the
problem.
However, the new reconnaissance flights from California have
found that large items of more than half a meter in size have been
“heavily underestimated”.
Slat said: “Most of the debris was large stuff. It’s a ticking time
bomb because the big stuff will crumble down to micro plastics over the
next few decades if we don’t act.”
Following a further aerial survey through the heart of the patch on Sunday, the Ocean Cleanup aims to tackle the problem through a gigantic V-shaped boom,
which would use sea currents to funnel floating rubbish into a cone.
A
prototype of the vulcanized rubber barrier will be tested next year,
with a full-sized 100km (62-mile) barrier deployed by 2020 if trials go
well.
The boom will not be able to suck up all of the strewn rubbish,
however, with Slat warning that plastic is “quite persistent. We need to
clean it up, but we also need to prevent so much entering the oceans.
Better recycling, better product design and some legislation is all part
of that. We need a combination of things.”
Using about 30 vessels, The Ocean Cleanup currently executes the largest ocean research expedition in history, aiming to determine how many tons of plastic are in the Great Pacific Garbage Patch.
The full scale of plastic pollution was revealed in 2014,
when a study found there were more than 5tn pieces of plastic floating
in our oceans.
In 2014, 311m tonnes of plastic were produced around the
world, a 20-fold increase since 1964.
It is expected to quadruple again
by mid-century.
A report by the Ellen MacArthur Foundation earlier this year predicted there would be more plastic than fish in the oceans by 2050 unless urgent action was taken.
Oceans might not be thought of as magnetic, but they make a tiny contribution to our planet’s protective magnetic shield.
Remarkably, ESA’s Swarm satellites have not only measured this extremely faint field, but have also led to new discoveries about the electrical nature of inner Earth.
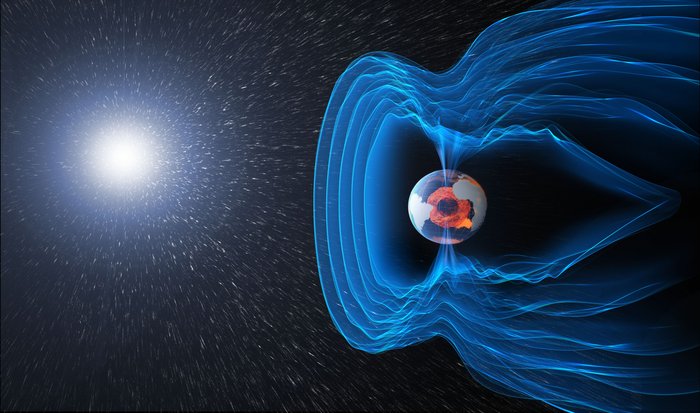
The magnetic field shields us from cosmic radiation and charged particles that bombard Earth from the Sun.
Without it, the atmosphere as we know it would not exist, rendering life virtually impossible.
Scientists need to learn more about our protective field to understand many natural processes, from those occurring deep inside the planet, to weather in space caused by solar activity.
This information will then yield a better understanding of why Earth’s magnetic field is weakening.
Although we know that the magnetic field originates in different parts of Earth and that each source generates magnetism of different strengths, exactly how it is generated and why it changes is not fully understood.
Earth's protective shield
The magnetic field and electric currents in and around Earth generate complex forces that have immeasurable impact on every day life.
The field can be thought of as a huge bubble, protecting us from cosmic radiation and charged particles that bombard Earth in solar winds.
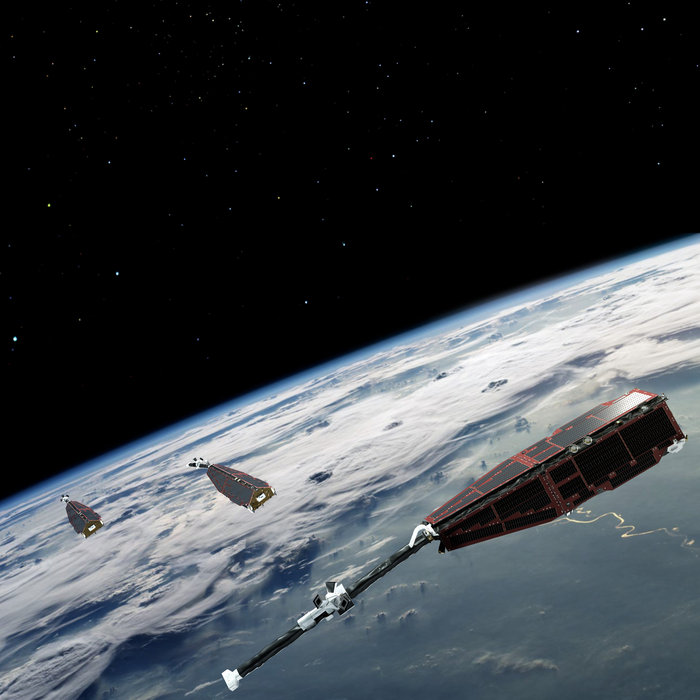
This is why, in 2013, ESA launched its trio of Swarm satellites.
While the mission is already shedding new light on how the field is changing, this latest result focuses on the most elusive source of magnetism: ocean tides.
When salty ocean water flows through the magnetic field, an electric current is generated and this, in turn, induces a magnetic response in the deep region below Earth’s crust – the mantle.
Because this response is such a small portion of the overall field, it was always going to be a challenge to measure it from space.
Last year, scientists from the Swiss Federal Institute of Technology, ETH Zurich, showed that if it could be measured from space – never done before – it should also tell us something about Earth’s interior.
However, this all remained a theory – until now.
Thanks to Swarm’s precise measurements along with those from Champ – a mission that ended in 2010 after measuring Earth’s gravity and magnetic fields for more than 10 years – scientists have not only been able to find the magnetic field generated by ocean tides but, remarkably, they have used this new information to image the electrical nature of Earth’s upper mantle 250 km below the ocean floor.
Magnetic field sources
The different sources that contribute to the magnetic field measured by Swarm.
The coupling currents or field-aligned currents flow along magnetic field lines between the magnetosphere and ionosphere.
Alexander Grayver, from ETH Zurich, said, “The Swarm and Champ satellites have allowed us to distinguish between the rigid ocean ‘lithosphere’ and the more pliable ‘asthenosphere’ underneath.”
The lithosphere is the rigid outer part of the earth, consisting of the crust and upper mantle, while the asthenosphere lies just below the lithosphere and is hotter and more fluid than the lithosphere.
“Effectively, ‘geo-electric sounding from space’, this result is a first for space exploration,” he continues.
“These new results are important for understanding plate tectonics, the theory of which argues that Earth’s lithosphere consists of rigid plates that glide on the hotter and less rigid asthenosphere that serves as a lubricant, enabling plate motion.”
Swarm is ESA's first Earth observation constellation of satellites.
The three identical satellites are launched together on one rocket.
Two satellites orbit almost side-by-side at the same altitude – initially at about 460 km, descending to around 300 km over the lifetime of the mission.
The third satellite is in a higher orbit of 530 km and at a slightly different inclination.
The satellites’ orbits drift, resulting in the upper satellite crossing the path of the lower two at an angle of 90° in the third year of operations. The different orbits along with satellites’ various instruments optimise the sampling in space and time, distinguishing between the effects of different sources and strengths of magnetism.
Roger Haagmans, ESA’s Swarm mission scientist, explained, “It’s astonishing that the team has been able to use just two years’ worth of measurements from Swarm to determine the magnetic tidal effect from the ocean and to see how conductivity changes in the lithosphere and upper mantle.
“Their work shows that down to about 350 km below the surface, the degree to which material conducts electric currents is related to composition.
“In addition, their analysis shows a clear dependence on the tectonic setting of the ocean plate. These new results also indicate that, in the future, we could get a full 3D view of conductivity below the ocean.”
Rune Floberghagen, ESA’s Swarm mission manager, added, “We have very few ways of probing deep into the structure of our planet, but Swarm is making extremely valuable contributions to understanding Earth’s interior, which then adds to our knowledge of how Earth works as a whole system.”
The words “mass surveillance”
usually bring to mind wiretaps, security cameras, and the NSA hoovering
unfathomable quantities of cellphone metadata and Internet activity.
Few pause to consider the physical aspect of that last type of data
collection: The government taps hundreds of cables that snake across the
ocean floor, carrying data around the world.
NSA-Tapped Undersea Cables, North Pacific Ocean, 2016
Artist Trevor Paglen
reveals some of those cables in a recent series, offering a visual
reminder of how vulnerable your data is, and how easily it is accessed.
“Once you start looking into the infrastructure, it becomes obvious very
quickly that 99 percent of the world’s information goes through little
tubes under the ocean,” Paglen says.
“Those are very juicy targets for
someone who wants to surveil the world.”
South America (SAM-1) NSA/GCHQ-Tapped Undersea Cable Atlantic Ocean, 2015
Security and surveillance fascinates Paglen, who has spent 10 years
photographing everything from so-called “black sites” to spy satellites.
He was a cinematographer for Laura Poitras’s fascinating film Citizenfour, which documents Edward Snowden‘s
NSA leaks as he made them.
During filming, Paglen visited NSA
whistleblower Bill Binney, who suggested the artist look into Internet
infrastructure.
Under the Beach (Tumon Bay, Guam)
Among the many things Snowden disclosed was the fact the NSA and
others tap these undersea cables.
Paglen spent two years studying the
leaked data, cross-checking it with information gleaned from telecom
documents, maritime charts, and topographical maps.
He also searched FCC
filings and other regulatory documents, correlating information with
the NSA documents.
It required a bit of detective work to sort it all
out, because the agency often uses codewords.
Documentation of NSA-Tapped Fiber Optic Cable Landing Site, Marseille, France, 2015
Once he had a sense of where these cables came ashore, Paglen had to
photograph them.
That meant learning scuba diving.
He took a class in
Berlin in the spring of 2015, flew to Florida for a certification
course, and was diving off the coast of Miami Beach the next day.
He
found the cable within minutes, exactly where his research indicated he
would.
Japan-US Cable System NSA/GCHQ-Tapped Undersea Cable Pacific Ocean, 2016
He photographed 10 cables off the coast of Florida, Hawaii, and Guam
during more than 30 dives for the ongoing project, which includes
large-format photos of where those cables come ashore.
From tapped fiberoptic cables at the bottom of the sea to football
field-sized antennas in deep space, the architecture of state
surveillance is as ubiquitous as it is invisible.
In this talk, artist
Trevor Paglen shares more than a decade's worth of images, research, and
stories about how to "see" the top-secret infrastructures that are so
emblematic of our historical moment.
He also creates
collages of maps and documents linking those cables to NSA surveillance,
providing a multi-media overview of government snooping.
“Much of the
way we understand the world is through images,” Paglen says.
“That’s
what I think good art does—it teaches you how to see the historical
moment that you live in.”
this writer was unable to vet the following
video as part of Earhart’s final flight, but it’s definitely footage of
Amelia and her navigator, Fred Noonan.
Many notable names of the 20th century have faded with the passage of
time.
Not so with aviatrix Amelia Earhart.
The pioneering female pilot
disappeared while flying over the Pacific Ocean in 1937, but people
still wonder what happened to her.
In fact, the Amelia Earhart mystery
is generating global buzz right now, and the world can thank Ric
Gillespie and Thomas King of The International Group for Historic
Aircraft Recovery’s Amelia Earhart Project for that.
On October 1, 2016, Nature World News made the announcement
that the International Group for Historic Aircraft Recovery has
recovered and is touting conclusive evidence that proves where and
possibly how Amelia Earhart and her flight navigator, Fred Noonan,
perished nearly 80 years ago.
Although no real evidence was ever presented that could prove or
disprove it, the U.S. government declared the official cause of
Earhart’s and Noonan’s deaths to be an airplane crash.
In theory, a
plane crash into unknown Pacific waters makes sense.
She had, after all,
crashed while piloting a plane at least twice before.
In reality, the
demise of Amelia Earhart and her trusty navigator may be a far more
grisly tale.
According to The International Group for Historic Aircraft Recovery,
or TIGHAR, Amelia knew she was running out of fuel and could not find
her planned destination of Howland Island, so she landed her plane on a
relatively flat coral reef on the western edge of an atoll then known as
Gardner Island. She used the last of her fuel to send distress calls
for several nights.
A week after Earhart’s final radio transmission, the
U.S. Navy sent a fleet of search planes to find Amelia.
By then,
Earhart’s Lockheed Electra had been swept off the tiny reef and into
very deep water, so no wreckage was seen from above.
Search pilot Lt.
John O. Lambrecht did report seeing “signs of recent habitation” on the
beach, but he assumed there were natives living on the island and did
not send a rescue team.
Finding Amelia with Hard Facts and Sound Science :
Powerpoint presentation given by TIGHAR Executive Director Ric Gillespie
at The Collider in Asheville, NC on August 5, 2106
What in the world happened to Amelia Earhart?
As the official story goes, Earhart’s Lockheed Electra 10E “flying
laboratory” was equipped with aviation gear that was state of the art
for the time. Biography.com
notes that although Amelia was a competent pilot, she was not a very
good navigator.
She flew more by instinct than by instruments, which may
or may not have contributed to her disappearance on June 2, 1937.
Other
factors that came into play that fateful night were the overcast skies
that blocked Noonan’s ability to navigate by the stars and the fact that
the charts used by Noonan and Earhart were outdated and placed 6,500
feet long, 1,600 feet wide Howland Island, which was their destination,
at least five miles from its actual location.
Amelia’s plane circled the
region, looking for Howland Island and its tiny landing strip as they
radioed a U.S. Coast Guard vessel called the Itasca with the following
message.
In the days following Amelia’s disappearance, at least 100 people
around the planet reported hearing distress calls that originated from
Earhart’s radio, reports The Vintage News.
Among those who described calls were a shortwave operator in Texas who
said that Amelia claimed to have made a partial water landing.
Another
radio listener reported hearing Earhart say she was injured, but that
her navigator was in worse shape than she.
Anecdotal evidence is
fascinating, but not enough to prove that Earhart and Noonan survived
their aviation mishap long enough to fire up the radio and send distress
calls.
Things that can prove the doomed duo survived a crash and died some
time later are the “hard facts and sound science” presented by Ric Gillespie
at The Collider in Asheville, North Carolina, on August 5 of this year.
Nikumaroro with the GeoGarage platform (Linz nautical chart)
According to Gillespie, Earhart landed her Lockheed Electra on the
western reef slope of the South Pacific coral atoll of Nikumaroro, some
1,800 nautical miles southwest of Hawaii, 700 nautical miles south of
Samoa and 1,000 nautical miles north of Fiji.
As Gillespie describes it,
Nikumaroro atoll is in “the middle of nowhere.”
Nikumaroro with the GeoGarage platform (NGA nautical chart)
And the middle of nowhere is precisely where a 19 inch by 23 inch
rectangle of aluminum was found by TIGHAR researchers in 1991.
Since
that time, TIGHAR researchers have unearthed several other bits of
conclusive evidence on Nikumaroro, including a pot of freckle cream, the
heel of a woman’s shoe that matches contemporary photos of Earhart and
several small bones.
Scientists surmise that the rest of Earhart’s and
Noonan’s bones may yet be discovered in old crab burrows.
This excerpt form the Discovery Channel documentary Finding Amelia explains TIGHAR's theory about how how Earhart landed on the reef at Gardner Island (Nikumaroro)
Scab patch as proof that Amelia landed on Nikumaroro atoll.
When the aluminum slab was first discovered, some pooh-poohed it as
not matching Earhart’s Elektra airplane.
In 1996, the metal was tested
by an independent lab and was found to be essentially identical to the
24ST Al-clad aluminum used as the skin of Earhart’s plane, NR16020.
Recently, the TIGHAR team found a Miami Herald photograph that
clearly shows the same piece used as a “scab patch” to cover a broken
window on the plane that became a part of the Amelia Earhart mystery
more than seven decades ago.
Gillespie notes that “the patch was as
unique to her particular aircraft as a fingerprint is to an individual
and that the aluminum matches that fingerprint in many respects.”
Video summary of NAI'A's 2015 expedition to Nikumaroro in the Phoenix Islands in support of TIGHAR's search for Amelia Earhart.
Between 2001 and 2010, Gillespie and the TIGHAR team visited
Nikumaroro Island several times, finding artifacts and evidence of
long-ago meals, leading scientists to conclude that Earhart may have
survived for several months before dying of malnutrition or illness.
Whatever the cause of her death, the brave aviatrix who flew through the
Pacific sunset and into the history books perished shortly before her
40th birthday.
Martin Waldseemüller's 1516 Carta Marina sought to present the most up–to–date conception of the world at that time.
Equal in size to his 1507 map, the Carta Marina is markedly superior to the earlier map in artistic detail, possibly reflecting the hand of the artist Albrecht Dürer (1471–1528).
It incorporates greatly expanded and corrected geographical information.
The Carta Marina could be considered the first printed nautical map of the entire world.
However, in part because of the controversies surrounding his earlier naming of the Western Hemisphere “America,” Waldseemüller omits the word from the Carta Marina, and indicates that North America is joined with Asia.


