Saturday, October 3, 2020

Nantes plan (1698)

Plan (1698) collected by Loïc Menanteau (geographer Univ. Nantes)

"There hadn't been many transformations since medieval times".
It is "a very little-known watercolour manuscript plan of Nantes dating from 1698, according to Loïc Ménanteau, the history-mad Nantes native.
That is to say, before the transformations of the city in the 18th century".
This document is of immense interest "because of its precision".
It shows perfectly the configuration of the city and its confluence site, the islands and the sandy banks, such as the Saulzaie.
The site of the confluence and the estuary bottom of Nantes appears clearly at a time when there had not been many transformations since medieval times.
What interested me most, perhaps through professional distortion (researcher in geography, editor's note), was the very precise representation for the time of the outline of the islands, the sandbanks, including the one where the Feydeau housing estate was later built, from 1740 onwards".

 SHOM map overlaid on Google Maps imagery with the GeoGarage platform

You can also discover the mouths of rivers, such as the Chézine, Erdre and Sèvre Rivers in Nantes, and the Loire crossing line with all the bridges.
You can see on the plan the traces of the designer's grid pattern, which shows his desire for precision. This publication delighted many people in Nantes by sharing it on his Facebook.
The plan shows many other types of interesting points: the medieval enclosure and its moat (dry or wet), the 16th century fortifications to protect the Marchix suburb, the convents and other constructions outside the enclosure (extra-muros).

 plan Cacault (1766)
sources : Nantes archives

Add to this the medieval fortified enclosure with its moat and, to the north-west, the fortifications built in 1562-1598 to protect the Faubourg du Marchix, churches and convents.

Friday, October 2, 2020

And all who sail in … it? The language row over 'female' ships

 The Royal Navy says it has no plans to change its tradition of referring to its ships as ‘she’.
Photograph: SSPL/Getty

From The Guardian by Carline Davies

The Royal Navy is committed to the tradition, but academics say it could betray a patriarchal view

Anachronistic and patronising, or benign nautical tradition? The appropriateness of referring to ships as “she” has been challenged by the Scottish Maritime Museum’s decision this week to adopt gender-neutral signage for its vessels.

The move has provoked debate over when, if ever, it is acceptable to use the feminine pronoun for inanimate things.

Ask a grown-up: why are boats called she?

It’s not just ships.
Cars are often personified as female.
How many male owners enjoy “taking her for a spin?” One well-known haulage company, Eddie Stobart, gives its trucks female names.

Planets, forces and countries, rendered as Mother Earth, Mother Nature, and the Motherland, are symbols of the life-giving, and life-sustaining.
We no longer have feminised weather systems, but from the 1950s violent destructive hurricanes bore only female names until campaigners forced meteorologists to alternate with male names in the 1970s.

Ella Tennant, from Keele University’s Language Centre, said referring to ships as “she” is an example of how language shapes the way we see the world.
There is “power and authority” in labelling, she says, and once that label is attached, “we have our own assumptions and preconceptions of what it is when we see that object”.
Advertisement

From a feminist language perspective, she adds, labelling ships, countries, and other inanimate things as female could be interpreted as “perpetuating the patriarchal view”, and as “slightly derogatory and patronising”.

Unlike some languages, English is not gendered.
But, Tennant argues, gender is often arbitrarily used, and cognitive research suggests that language and the way people use it has a profound influence on the way we see the world.

Some argue it is merely an expression affection by sailors who see their vessel as a maternal protector.
These include the retired naval chief Admiral Lord West who, on Radio 4’s Today programme, denounced the move as “an insult to a generation of sailors” who merely saw their ship as a mother.

Another theory lies in the idea of goddesses and mother figures playing a protective role.
Whatever the origin, it has a long tradition: the earliest known example appears to date from 1375, according to the Oxford English Dictionary.

Otto Jespersen, a Danish linguist described as a foremost authority on English grammar, argues “he” or “she” may be may be used “in order to show a certain kind of sympathy with or affection for the thing, which is thereby, as it were, raised above the inanimate sphere”.

Jespersen describes, in Essentials of English Grammar (1933), how “railway-men will speak of the locomotive or train, and the motor owners of their car, as she”.

HMS Queen Elizabeth returns to Portsmouth from sea trials.
Photograph: AB Conor Culwick/PA

David Mann, director of the Scottish Maritime Museum, said the decision to drop “she” for “it” was taken after two signs were vandalised.
“The debate around gender and ships is wide-ranging, pitting tradition against the modern world.
But I think that we have to move with the times,” he said.

Lloyds List, the 285-year-old daily maritime bible, abandoned “she” for “it” almost 20 years ago.
Richard Meade, its editor, said the decision was made to bring the paper “in line with most other reputable international business titles and referring to ships as she seemed anachronistic”.

“I get the maritime tradition.
In the days of a wooden ship, or an old steam liner, there was a certain amount of romanticism, and these ships had personality.
But the modern-day container carrier is about 400 metres long and carries 22,000 steel boxes on board, and I challenge anybody to look at the rusting hulk of one of those and assign a gender to it,” he said.

A Royal Navy spokesman said: “The navy has a long tradition of referring to its ships as ‘she’ and will continue to do so.”

The debate has found little sway with the royal family, it seems.
Princess Anne, naming a new Hull-based fishing trawler this week, smashed the traditional bottle of champagne against it as she said: “I name this ship Kirkella.
And may God bless her and all who sail in her.”

Lissy Lovett, editor of the online feminist magazine, The F-Word, said: “At a time when transphobic rhetoric is being repeated in mainstream newspapers …people in Northern Ireland still don’t have access to safe, free abortions and when the majority of people living in poverty around the world are women, I just can’t see this as that big a deal.”

The Women’s Equality party said a particular concern was the failure to recognise the achievements of women in the naming of buildings.

“A recent example is the scandal regarding the naming of a cultural and learning hub in Tunbridge Wells.
Instead of respectfully naming the hub ‘Amelia Scott’ in remembrance of the brilliant Amelia Scott, who was a social reformer and campaigner for women’s suffrage, the building was simply named ‘Amelia’.

“You wouldn’t name a building ‘Karl’ after Karl Marx, or ‘Winston’ after Winston Churchill.
So why omit ‘Scott’ from Amelia Scott if not to undermine her significance instead of celebrating it?”

Links :

Thursday, October 1, 2020

Arctic shipwreck 'frozen in time' astounds archaeologists

To investigate the lower decks of the H.M.S. Terror, a Parks Canada archaeologist inserts a miniature underwater drone through a skylight.
Screenshot Courtesy Parks Canada, Underwater Archaeology Team

From National Geographic by Roff Smith

Researchers make haunting discoveries while peering deep inside H.M.S.
Terror, one of two ships lost during the ill-fated Franklin expedition.

The wreck of H.M.S. Terror, one of the long lost ships from Sir John Franklin’s 1845 expedition to find the Northwest Passage, is astonishingly well preserved, say Parks Canada archaeologists, who recently used small remotely-operated vehicles (ROVs) to peer deep inside the historic vessel’s interior.

“The ship is amazingly intact,” says Ryan Harris, the lead archaeologist on the project.
“You look at it and find it hard to believe this is a 170-year-old shipwreck.
You just don’t see this kind of thing very often.”

Discovered in 2016 in icy waters off King William Island in Canada’s far north, the shipwreck hadn’t been thoroughly studied until now.
Taking advantage of unusually calm seas and good underwater visibility, a team from Parks Canada, in partnership with Inuit, earlier this month made a series of seven dives on the fabled wreck.
Working swiftly in the frigid water, divers inserted miniature ROVs through openings in the main hatchway and skylights in the crew’s cabins, officers’ mess, and captain’s stateroom.
(Here's the mysterious clue that led to the discovery of the H.M.S. Terror.)
Lost and found
Deep in the Canadian Arctic, Franklin’s ships were trapped in sea ice for 19 months.
Survivors set out on foot but were never heard from again.
Archaeologists hope the sunken ships, located in 2014 and 2016, will yield answers.


“We were able to explore 20 cabins and compartments, going from room to room,” says Harris.
“The doors were all eerily wide open.”

What they saw astonished and delighted them: dinner plates and glasses still on shelves, beds and desks in order, scientific instruments in their cases—and hints that journals, charts, and perhaps even early photographs may be preserved under drifts of sediment that cover much of the interior.

“Those blankets of sediment, together with the cold water and darkness, create a near perfect anaerobic environment that’s ideal for preserving delicate organics such as textiles or paper,” says Harris.
“There is a very high probability of finding clothing or documents, some of them possibly even still legible.
Rolled or folded charts in the captain’s map cupboard, for example, could well have survived.”

The H.M.S. Terror and Erebus were state-of-the-art naval vessels in 1845, when the Franklin expedition embarked from Britain.
Photograph by Illustrated London News, Getty

The only area below decks the team was unable to access was the captain’s sleeping quarters.
Apparently the last person to leave closed the door.
“Intriguingly, it was the only closed door on the ship,” says Harris.
“I’d love to know what’s in there.”

Just as tantalizing is the possibility that there could be pictures of the expedition awaiting discovery.
It’s known that the expedition had a daguerreotype apparatus, and assuming it was used, the glass plates could still be aboard.
“And if there are, it’s also possible to develop them,” says Harris.
“It’s been done with finds at other shipwrecks.
The techniques are there.”

Glass bottles in the officers' mess remain intact.
The vessel appears to have settled gently to the bottom.
Screenshot Courtesy Parks Canada, Underwater Archaeology Team

Plates remain on shelves, as if ready for the next meal.
Silt covers much of the…
Photograph Courtesy Parks Canada, Underwater Archaeology Team

A great mystery

The fate of the Franklin expedition has been one of history’s great mysteries.
(See relics from the lost expedition.)

What’s known is that Sir John Franklin set sail in May 1845 with a crew of 133 men and orders to discover the Northwest Passage—a goal that had eluded explorers for centuries.

Then as now, geopolitics was a driving force in Arctic exploration, with the Royal Navy wanting to secure the fabled shortcut to the Pacific ahead of the Russians, who had maritime aspirations of their own.
With this in mind no expense was spared.

Photograph By Universal History Archive, Universal Images Group/Getty

The ill-fated expedition was led by British naval hero and Arctic explorer Sir John Franklin.

Franklin was given command of two state-of-the-art ships, Erebus and Terror, both equipped with stout, iron-sheathed hulls and steam engines, as well as the finest scientific equipment and enough food and supplies for three years in the high Arctic.
It was one of the best equipped and best prepared expeditions ever to leave Britain’s shores.

After brief stops in Scotland’s Orkney Islands and Greenland, the two ships set off for Arctic Canada in hopes of picking their way through its labyrinth of straits and bays and islands and eventually reaching the Pacific Ocean.
The last European eyes to see the ships were the crews of two whaling vessels who encountered Erebus and Terror in late July 1845, on the crossing from Greenland to Canada’s remote Baffin Island.
After that they were never seen or heard from again.

As years passed with no word of the expedition, search parties were sent out.
Over time the discovery of skeletons and discarded equipment—as well as disturbing evidence of cannibalism—made clear that the expedition had met with disaster.
But how and why has remained a mystery.

A brief note found under a cairn gives a bit of the story.
Dated April 1848 and signed by Francis Crozier—captain of the Terror, who by then had taken command of the expedition—it stated that the ships had been locked in ice for a year and a half, that 24 of the men were already dead—including Franklin—and that Crozier and the other survivors planned to attempt to walk overland to a remote fur-trading outpost hundreds of miles away on the Canadian mainland.
None of them ever arrived.

What caused such a well-equipped expedition to go so badly wrong remains a mystery.
But in recent years the two biggest pieces of the puzzle—the ships themselves—were discovered: Erebus in 2014, lying in 36 feet of water off King William Island, and Terror two years later, found in a bay about 45 miles away, in 80 feet of water and largely intact.

H.M.S. Terror, one of two ships from the doomed Franklin expedition, was discovered in 2016 off King William Island in the Canadian Arctic.
The small expedition boat seen here sank along with the Terror and rests on the seafloor a short distance from the ship.
photo : Thierry Boyer, Parks Canada

Why the ships ended up so far apart, which one went down first, and why and how the ships sank are questions archaeologists hope to answer.

“There’s no obvious reason for Terror to have sunk,” says Ryan.
“It wasn’t crushed by ice, and there’s no breach in the hull.
Yet it appears to have sunk swiftly and suddenly and settled gently to the bottom.
What happened?”

Teasing out the answers won’t be easy, even with such a bounty of artifacts.
There are plans to excavate both wrecks, but it will be a slow process requiring years.

“Diving up here is extremely difficult,” says Ryan.
“The water is extremely cold, making it impossible to stay down for very long, and the diving season is short—a few weeks if you’re lucky, a few days if you’re not.”

HMS Terror and Erebus | Franklin Expedition (Nova Ghost Documentary)

Even so, this season’s work on Terror has already provided some tantalizing clues that will help researchers develop a chronology of the disaster.

“We noticed the ship’s propeller still in place,” says Ryan.
“We know that it had a mechanism to lift it out of the water during winter so that it wouldn’t be damaged by the ice.
So, the fact that it’s deployed suggests it was probably spring or summer when the ship sank.
So, too, does the fact that none of the skylights were boarded up, as they would have been to protect them against the winter snows.”

No doubt there are a lot more answers lying beneath the sediment in those cabins, says Ryan.
“One way or another, I feel confident we’ll get to the bottom of the story.”

Links :

Wednesday, September 30, 2020

Mapping shallow seafloors

Velasco Reef in the Republic of Palau
NASA Earth Observatory images by Joshua Stevens, using Landsat data from the U.S. Geological Survey and data from the Shallow Bathymetry Everywhere project. 

 Velasco reef with the GeoGarage platform (NGA nautical raster chart)

From NASA by Andi Thomas, with Mike Carlowicz.

The waters along the world’s coasts and islands are incredibly important to human activities, yet they are not always well mapped.
Coastal waters are often turbulent and murky, as the sand, mud, and sediment on the bottom is constantly in motion.
Unless there are regularly dredged channels, it can be difficult and dangerous for ships to travel in shallow water.
Making accurate and up-to-date depth charts is time-consuming and expensive, and doing so on a global scale is a monumental task.

By combining satellite measurements with ship-based sonar data, a team of researchers is now working to fill the gaps in our seafloor maps.
They are using data from NASA’s Ice, Cloud, and land Elevation Satellite 2 (ICESat-2) to accurately measure the depths (bathymetry) of shallow coastal waters, where surveying ships have historically been unable to travel due to safety, expense, or remoteness.

The images above show Velasco Reef in the Republic of Palau.
The left, natural-color image of the South Pacific reef was acquired by Landsat 8 in 2020; the right image is a digital elevation model created with ICESat-2 data.
The map was developed as part of a demonstration study led by remote sensing scientists Lori Magruder of the University of Texas at Austin and Chris Parrish of Oregon State University.
They partnered with the Coral Reef Research Foundation in Palau to fuse existing sonar data with their ICESat-2 dataset.

Mapping shallow, nearshore areas can be slow and potentially dangerous. Conventional field methods may involve a surveyor standing in shallow water, taking measurements at specific intervals, while at the mercy of waves and currents.
Meanwhile, boat-based sonar surveys are inefficient in shallow waters and subject to the dangers of waves, rocks, and reefs.
In addition, the National Oceanic and Atmospheric Administration (NOAA) has established Navigable Area Limit Lines (NALL), which define the shoreward limit of their boat-based surveys. The NALL is set at water depths of 3.5 meters (11 feet), and NOAA advises caution to captains maneuvering in shallow areas within the NALL because they are not often mapped, if at all. Sometimes the NALL limit can extend significant distances from shore.

These challenges result in many nearshore coastal waters being largely unmapped.
The area is nicknamed “the white ribbon” because it appears as white space hugging coasts, shoals, and atolls on bathymetric maps.
It essentially represents no data.

“The near-coastal area from 0 to 10 meters in depth is notoriously hard to map because a lot of the acoustic sensors that are used in bathymetry do not capture the shallower depths accurately,” said Magruder.
“Near-shore measurements provide a window into the coastal dynamics and processes that are really important.”


  The maps above show the NALL regions around Velasco Reef and the current water depths as measured by Magruder and Parrish’s team. This use of ICESat-2 data could be a game-changer.


The satellite’s main instrument is the ATLAS altimeter, which sends 10,000 laser pulses per second toward Earth’s surface and detects the photons that return in order to determine the height of landmasses and features on it (such as ice sheets, forests, and glaciers).
It turns out that ICESat-2’s laser pulses can also penetrate the water column in shallow areas and return measurements from the seafloor.

The main mission of ICESat-2 is to map sea ice thickness and ice sheet elevation, as well as the height and density of temperate and tropical forests.
Scientists and engineers thought it might be possible to measure ocean bathymetry, but they were not sure until Adrian Borsa, a geodesist at the University of California, San Diego, noticed in 2018 that ICESAT-2 data was picking up seafloor signals around Bikini Atoll in the South Pacific.

This finding provoked Parrish and Magruder to make a concentrated effort to use the satellite for near-shore mapping.
Because it can observe across the entire globe, ICESat-2 provides broader spatial coverage than sonar-mapping ships.
The satellite also collects data from the same location every 91 days, allowing for repeat mapping of areas that previously took great effort to map even once.


Beyond Velasco Reef, researchers are using the novel dataset to map near-shore habitats off of Western Australia and around the Gilbert Islands, French Polynesia, Turks and Caicos, and the Bahamas.
The methods are even being used to map the shores of Lake Tahoe, California.
With a complete and continuous look at near-shore bathymetry, researchers can aid efforts to monitor endangered coral reefs and coastal mangroves, sediment transport after disaster events, carbon storage capacity, water clarity, invasive species, and several other aspects of coastal dynamics.

Tuesday, September 29, 2020

Towards free and open weather data for all from ECMWF

Forecasts of precipitation and mean sea level pressure are just one example of the hundreds of ECMWF charts that will be made available.

From The Parliament Mag by Umberto Modigliani, ECMWF’s Deputy Director of Forecasts, responsible, with the Department Director, for the 24/7 production of forecasts and for liaison with users.

The European Centre for Medium-Range Weather Forecasts (ECMWF) is moving towards open data, writes Umberto Modigliani.

Early October will see the European Centre for Medium-Range Weather Forecasts (ECMWF) take a major step towards making hundreds of its forecast maps free and available to all.
The changes are part of wider moves across Europe to make public sector data free and open, to encourage innovation and to support a thriving, data-based digital economy.

Charts will cover the whole world, all types of weather situations including extreme events, and, very importantly, will also include probability-based information, providing guidance on forecast confidence.

Up till now, full access to these forecast charts was restricted to the national meteorological and hydrological services of ECMWF’s Member and Co-operating States, World Meteorological Organisation members and commercial customers.
Access was subject to a range of bespoke licences and often incurred charges.

Forecasts of precipitation and mean sea level pressure are just one example of the hundreds of ECMWF charts that will be made available.

Forecast charts will be free and open, so users can share, redistribute and adapt the information as they require, even for commercial applications, as long as they acknowledge ECMWF as the source.

Andy Morse, Professor of Climate Impacts at the University of Liverpool, commented: "The potential uses and benefits these products bring for a range of users and sectors is vast and particularly key in less economically developed countries. Now that remote internet access is widespread through modern mobile phone networks; the availability of this information is likely to be a game changer for many small enterprises. In my experience, people in these most remote parts of the world are hungry for such information."

The changes also mean a move to an open data policy for historical information in ECMWF’s huge repository, which contains billions of meteorological fields including recent and past forecasts.
It represents the largest archive of such data in the world.
“The societal benefits associated with free and open data are big. We are aware that the move comes with its financial challenges, but the benefits outweigh those challenges” Rolf Brennerfelt, Chair of ECMWF Policy Advisory Committee
Under the EU Open Data Directive, EU Member States will be required to make as much information available for re-use as possible.
Weather forecasts are considered as ‘high value’ data, the re-use of which is associated with particularly important benefits for society and the economy.

The EU Copernicus Earth observation programme, several elements of which are implemented by ECMWF, has operated a policy of free, open data since its inception.
With many thousands of users, the programme offers a host of examples of the benefits that open data can bring.

At the start of the COVID-19 pandemic, a group of Italian epidemiologists used atmospheric pollution data from the EU Copernicus Atmospheric Monitoring Service (CAMS) to investigate links between the level of pollution in a given area, and the rate and seriousness of COVID infection.
The Copernicus Climate Change Service (C3S) has developed an application that allows health authorities and epidemiology centres to explore whether temperature and humidity affect the spread of the coronavirus.

With hundreds of petabytes of data, ECMWF’s vast repository is the epitome of the term ‘big data’.
It offers immense opportunities for machine learning, where a computer uses data to ‘learn’ relationships between different variables.
If there are sufficient data for training, machine learning can be used to develop numerical tools that can mimic complex systems.
In fact, researchers are coupling these ECMWF data and machine learning to investigate the development of a ‘digital twin’ of the Earth system.
Wider applications such as anticipating weather effects on financial markets can also be envisaged.

Rolf Brennerfelt, Chair of ECMWF Policy Advisory Committee, commented: “ECMWF Member States have been keen for the Centre’s data to be open and free for a while.

The societal benefits associated with free and open data are big.
We are aware that the move comes with its financial challenges, but the benefits outweigh those challenges.

We are in a period of transition, and this first batch of data being made freely available is a very good start and illustrates well our commitment to this principle.”

This phased move towards free and open data aims to support creativity and innovation in the field of scientific research as well as weather applications, and should enable more necessary and critical scientific, social and economic advances.

Links :

How does climate change affect the ocean?

A polar bear and her cub on sea ice in the Arctic north of Svalbard
(Image © Larissa Beumer / Greenpeace)

From China Dialogue by David Adam

The ocean has cushioned the blow of global heating, but at a cost to the stability of climate systems and marine life

As climate change tightens its grip, the effects are being felt across the planet.
The global ocean plays a key role and has so far soaked up most of the carbon dioxide and excess heat human activities have produced.
But it is also vulnerable.
Already some significant changes are underway, and the climate disruption to our seas looks set to worsen.

1. Rising temperatures

About 90% of the excess heat trapped by atmospheric greenhouse gases is eventually soaked up by the world’s oceans.
Because oceans are so big, the temperature change to the seawater can seem small – the sea surface layer has warmed by just over 0.5C in the last century.
That’s still enough to cause significant disruption, and the warming is accelerating.

Things expand as they warm, becoming less dense and taking up more space.
The oceans are no different.
Indeed, between 1993-2010, thermal expansion is thought to have raised sea levels by an average of 1.1 millimetres a year, accounting for much of the overall rise we have seen.
The total observed rise in sea level for the 1993-2010 period was an average of 3.2mm every year, with contributions from various other sources, including water stored on land, in forms such as snow.

(Graphic: Manuel Bortoletti / China Dialogue Ocean)

Warmer water also influences the atmosphere above it.
Increased sea surface temperatures are associated with making hurricanes and tropical cyclones more powerful, potentially increasing the number of the most severe category 4 or 5 storms that strike islands and coastal areas.
Warmer water can also dissolve less carbon dioxide, which means more will stay in the atmosphere to accelerate global warming.

Just like on land, rising temperatures in the oceans generate damaging heatwaves.
They occur when unusual weather conditions or water currents cause above-average water temperatures for at least five consecutive days.
But they can last for months or even years.
A marine heatwave called “The Blob” hung around the northern Pacific from 2013-2015 and killed a million seabirds on the west coast of the United States.

2. Acidification

As carbon dioxide dissolves in seawater, it reacts to form carbonic acid: a fairly weak acid, but enough to alter the pH of seawater, which is naturally alkaline.
Since the industrial revolution, dissolved carbon dioxide is estimated to have lowered the average pH of the top layer of the oceans by 0.1 pH units, from about 8.2 to 8.1 (7 is neutral).

That change doesn’t sound much, but because pH is measured on a logarithmic scale, it actually represents a nearly 30% increase in acidity.
This has some significant knock-on effects for seawater chemistry and the ecosystems that rely on it.

 
(Graphic: Manuel Bortoletti / China Dialogue Ocean)

The increase in acidity is particularly bad news for shellfish and other forms of sea life that use the mineral calcium carbonate to form their shells and exoskeletons.
More acidic water can hold less of this mineral, so there’s less available for so-called calcifying organisms such as oysters, clams, sea urchins, shallow water corals, deep sea corals and calcareous plankton.
Worse, the change in chemistry encourages existing carbonate structures to dissolve.

Coral is particularly vulnerable.
Experiments on a small patch of Australia’s Great Barrier Reef show that artificially reducing the seawater carbon dioxide level, so restoring pH to pre-industrial levels, boosted coral calcification by 7%.
Then, when the scientists raised the amount of carbon dioxide and so decreased ocean pH to the level expected by the end of this century, calcification dropped by a third.

3. Melting ice

As climate change continues, many scientists believe it is inevitable that massive ice sheets in Greenland and Antarctica will collapse and melt entirely, eventually pouring enough water into the oceans to raise global sea levels by several metres.
It will take time – hundreds, perhaps thousands of years – but the melting is accelerating.
The UN’s climate body now projects that, under a low-emissions scenario, average sea level will rise between 61cm and 1.1m by the end of the century.

By 2050, rising seas could push peak high tides above land currently home to at least 300 million people, mostly in Asia.

 
Villagers in the Sundarbans work to repair a damaged dike after seawater flooded an adjacent paddy field.
This low-lying delta region straddles the India-Bangladesh border.
Home to an estimated 4.5 million people, it is particularly vulnerable to rising sea levels.
(Image © Peter Caton / Greenpeace)

Coastal ecosystems will be affected too.
Beach and dune environments face more severe and frequent flooding and erosion, while sensitive freshwater habitats including mudflats and marshes – needed for bird species to breed – will be swamped with seawater.

Sea ice, which forms when seawater freezes each polar winter, is also melting and thinning more and more each summer.
Melting of this ice doesn’t significantly contribute to sea levels, but it does pose big problems for creatures that rely on it for their habitat.
Most notably, polar bears need sea ice to hunt seals, and studies show many of the 25,000 bears estimated to remain in the Arctic are struggling.
One colony of animals around the Southern Beaufort Sea, in northeastern Alaska and Canada, was found to have declined by 40% between 2001 and 2010.

4. Changes in ocean currents

Ocean currents are vulnerable to the effects of climate change.
At present, those currents act as massive global conveyor belts: as winds push through the atmosphere from the warm equator to the colder poles, they drag surface water with them.
Cooled by the chilly polar air, this water becomes denser, and so sinks to the deep ocean, where it is pushed back towards the equator (becoming warmer, less dense and rising as it goes) by the next batch of denser water coming from above.
Round and round the cycles go, transporting and mixing nutrients as they swirl along.

 
(Graphic: Manuel Bortoletti / China Dialogue Ocean)

Melting ice interferes with this system.
Huge amounts of fresh water pouring in at the poles lowers the density of the seawater, making it slower to sink.
Without the same driving downward force, the whole global cycle can weaken.
In 2018, scientists suggested that the major current in the Atlantic Ocean had slowed by about 15%.
And some studies predict that could worsen to more than 30% by 2100.

Based on what has happened in the past, scientists say slower ocean currents can bring significant changes in the Earth’s atmosphere, and so to the weather.
Winters in Europe could be much colder (an idea taken to extremes in the film The Day After Tomorrow).
Meanwhile, the waters of the South Atlantic could become warmer, and because sea surface temperature influences wind and rainfall, this could disrupt monsoon cycles that are vital for crops across Asia and South America.

5. Deoxygenation

Ocean creatures rely on oxygen dissolved in seawater, just as we breathe it from the atmosphere.
But climate change is gradually draining oxygen from the seas: about 1-2% is thought to have been lost from 1960 to 2010, and that could rise to 4% by 2100.

There are several reasons.
Warmer water can hold less of the gas, while disruption to ocean currents limits the amount of oxygen transported from the surface to the depths.

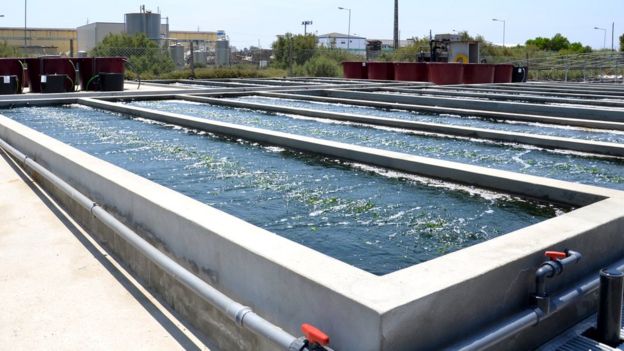
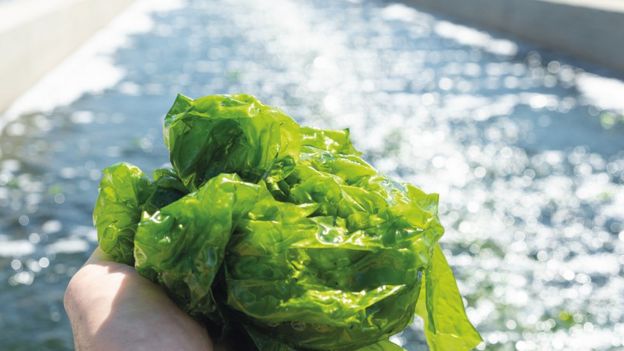
A growing problem occurs when the fertiliser and other nutrients added to agricultural soils drain into rivers and eventually get dumped into coastal waters.
Boosted by the unexpected supply of food, algae can grow and proliferate rapidly to form massive floating blooms – sometimes called green (or red) tides.
These can be problematic, for example by releasing chemicals toxic to fish.
And when the algae die and sink, the microbes that work to decompose the blooms in the depths soak up oxygen from the surrounding water.

Gdansk beach in northern Poland was closed to tourists due to a toxic algal bloom in the summer of 2018 (Image: Wojciech Strozyk / Alamy)

In severe cases, dissolved oxygen levels can fall so low that parts of the deep ocean become barren.
A 2008 global survey found at least 405 of these dead zones, up from 49 in the 1960s.
Perhaps most affected is the Baltic Sea.
Despite efforts to limit agricultural run-off from surrounding countries, the Baltic still has a massive dead zone of about 70,000 square kilometres – about the size of Ireland.

6. Marine food chain collapse

Already under pressure from overfishing and pollution, marine life – from large fish down to cyanobacteria – is also affected by climate change.
As seas warm and currents shift, some sea life can simply move, for example towards the cooler water of the poles.
These shifts in distribution have knock-on effects for species that feed on them: from people trying to catch tuna, to fish looking for zooplankton.
Under stress from shifting resources, species are especially vulnerable if they are already weakened by acidification and oxygen depletion.

Changes to interconnected and complex systems of food webs are hard to predict.
Fisheries in some areas might actually get a boost as valuable new species are driven into their nets.
But, overall, the impact is likely to be bad.
A study last year suggested that warmer waters had reduced the total amount of fish that can be caught in a sustainable way by 4% since the 1930s.
The worst-affected sea was the Sea of Japan, with a 35% reduction in fishery size due to warming.
The East China Sea saw a drop of 8%.

 
(Graphic: Manuel Bortoletti / China Dialogue Ocean)

Future drops in fish catches would threaten the food security of a large fraction of the world’s growing population.
According to the UN, fish provide more than 3.1 billion people with at least 20% of their animal protein.
It’s an important source of fatty acids and micronutrients too.
Fish currently supply 17% of all the protein consumed in the world, and demand is expected to continue to increase as incomes rise in the developing world.

Links :

Monday, September 28, 2020

Seaweed: The food and fuel of the future?

The cold water around the Faroe Islands is good for seaweed cultivation

From BBC by Adrienne Murray


Sunshine has given way to wind and rain, as the motorboat chugs through a fjord in the Faroe Islands.

"Its a bit windy here," says Olavur Gregarsen.
"We'll see how far we can get to the harvesting boat."

We soon reach a sheltered spot where steep mountains are looking down on hundreds of buoys bobbing in the sea.

"They are holding up a horizontal line," explains Mr Gregarsen, the managing director of Ocean Rainforest, a seaweed producer.
"At every metre another line hangs down, and that's where the seaweed grows."

Breaking waves

Anchored to the sea floor, the cultivation rig consists of 50,000m (164,000ft) of underwater lattice-like ropes, designed to withstand rough sea conditions.

"The main structure is 10m down.
That way we avoid the largest breaking waves," he says.

Despite the Danish territory's remote North Atlantic location, Mr Gregarsen says the deep, nutrient-rich, waters are well suited for growing seaweed, with a stable temperature of between 6C and 11C.


Ocean Rainforest plans to double production
Image Adrienne Murray

His firm is among a wave of seaweed farms that have sprung up in Europe and North America, spurred by a growing demand from the food industry and others.

"You have a biomass that can be used for food and feed, and replacing fossil-based products like packaging material from plastic," he says.

Mechanisation

Seaweeds are fast-growing algae.
They utilise energy from sunlight, and take up nutrients and carbon dioxide from the seawater.
Scientists suggest seaweed could help fight climate change and offset carbon emissions.

Ocean Rainforest recently won funding from the US Department of Energy to build a similar system in California, where there's interest in developing industrialised seaweed production for future biofuels.

Aboard the harvesting boat the skipper controls a mechanical arm that lifts lines from the water.
The seaweed is chopped free, filling up containers.
It's quick but messy work.
The lines are then left to regrow.
This year around 200 tonnes will be harvested.

Ocean Rainforest recently won funding from the US Department of Energy
Image Adrienne Murray

But the company is scaling up, and plans to double its capacity this year.
It isn't making money just yet, but expects to soon, Mr Gregarsen tells me.
"We can see how we can mechanise this, how we can make this a really large-scale efficient activity," he says.
"There are not many companies that do this as a profitable business, if any."

Cosmetics and medicines

Seaweed needs to be processed quickly.
At a small plant in the Faroese village of Kaldbak, machines clean the harvest.
Some is dried and supplied to food manufacturers.
The rest is fermented and shipped to animal feed producers.

Seaweed is used to make food additives, textiles and fuel
Image Adrienne Murray

Most farmed seaweed is consumed in food, but extracts are used in a wide variety of products.
Whether it is toothpaste, cosmetics, medicines or pet food, these often contain hydrocolloids derived from seaweed, which have gelling or thickening properties.

And more products are coming, with other firms working on textiles and plastic alternatives, including biodegradable packaging, water capsules, and drinking straws.

Seaweed production has boomed.
Between 2005 and 2015 volumes doubled, surpassing 30 million tonnes annually, reports the UN's Food and Agriculture Organization.
It is a business worth more than $6bn (£5bn) worldwide.

Yet only a fraction of cultivation happens outside Asia, where farming is a long-established, but mostly labour-intensive activity.

'A lot of effort'

"The labour cost is really high in Europe, so that's one major part of it," explains Annette Bruhn, who is a senior scientist at Aarhus University in Denmark.
"A lot of effort needs to be put into mechanisation and upscaling."

To make farming economical, she says "the yield needs to go up and the cost needs to go down".

But farming systems aren't easily replicated.
"Different areas in different waters, all require modifications.
There's not one solution that can be expected to fit all," says Ms Bruhn.

Seaweed uses carbon dioxide from the sea
Image Harald Bjorgvin

However, she is hopeful, and says there are "many areas where you can have breakthroughs".

That is what innovators like Sintef are trying to do.
The Norwegian scientific research group is working on new technologies to streamline farming.
"Now most of the seaweed is used for food, but in the future we want to use it for fish feed, fertilisers, biogas.
We need large volumes and we need to produce much faster," says research scientist Silje Forbord.

Dry lab

Prototype machines such as the "seaweed spinner" automatically wrap spools of seedling-carrying threads onto lines, ready for deployment at sea.

Another concept, SPoke (Standardized Production of Kelp), consists of circular farm modules where seaweed grows from lines radiating outwards.
It is designed so a robot can move along the wheel-like spokes - either attaching threads carrying juvenile seaweed or harvesting it.

"We've built one arm with a robot going back and forth.
That has been tested in a dry lab," explains Ms Forbord, but more investment will be needed.

 Land-based seaweed cultivation
No additives or fertilisers are used
Image Algaplus

In a series of ponds and tanks in northern Portugal, AlgaPlus is cultivating seaweed inland.

"It's a much more controlled environment," says managing director Helena Abreu, who thinks there are more advantages compared to farming offshore.
"We maintain the temperature and everything inside the tanks," she says.
"You have year-round production."

Ms Abreu co-founded the firm after spending five years as a marine biologist in the Azores.
Small, high-value seaweeds are produced for food companies, cosmetics makers and high-end restaurants.

Innovation

Seawater from a coastal lagoon flows into fish ponds.
It is then pumped through a filtration system into tanks growing seaweed.
There's also a hatchery breeding the seedlings.

"We had to innovate from scratch," she says.
These waters are rich in nitrogen, which the algae take up, mimicking nature.
"We don't need to use any additives, no fertiliser.
We use water from the fish to grow our seaweed," she says.

AlgaPlus produces small, high-value seaweeds
Image Algaplus 

Ms Abreu doesn't think availability of land is a limiting factor.
Former salt works and fish farms could be repurposed, she says, pointing out there are hectares of availability in Portugal, France, Italy, Greece and Turkey.

Onshore seaweed farming takes place in Canada and South Africa too.
Micro-algae are also grown in tank systems.

But there are other challenges.
"The main bottleneck is energy cost. Working with tanks you need the pumping and the aeration to keep the water moving," says Ms Abreu.

The firm can't survive on sales alone just yet.
But Ms Abreu is convinced that the seaweed market will continue to grow.
"It's a huge trend," she says.
"Every year there's more and more companies. There are newcomers in all steps of the value chain."

Links :

Sunday, September 27, 2020

A year along the geostationary orbit

A year through the distant eyes of meteorological satellite Himawari-8 – a hypnotic stream of Earth's beauty, fragility and disasters.
Animation of satellite irradiation scan measurements, scientific data by meteorological satellite Himawari-8 courtesy of JMA/BoM/NCI.
Timecodes for meteorological/astronomical events (approximate, list to be completed):
March 9th 2016 Total Solar Eclipse: 4:44
June 2016 Kamchatka Wildfires: 7:26-8:02 (visible as large amounts of smoke emitted from a point in western Kamchatka, eventually filling a large ocean area) - also: June solstice/polar day north pole
July 2016 Super Typhoon Nepartak: 8:37-8:49
Aug 2016 Typhoon Lionrock: 10:43-11:09
Sep 2016 Super Typhoon Meranti: 11:14-11:24
Dec 2016 December solstice/polar day south pole: from 13:25
Attribution note on the data, which the images in this film are based on:
Satellite observations were originally processed by the Bureau of Meteorology from the geostationary meteorological satellite Himawari-8 operated by the Japan Meteorological Agency. Access to this dataset was provided by the National Computational Infrastructure (NCI), which is supported by the Australian Government.