Shipping workers recorded the tide levels beginning in 1854 at St. George's Dock in Liverpool, England, creating valuable records for future scientists.Heritage Images/Getty Images
From NPR by Lauren Sommer
Off the coast of England, there's a tiny, wind-swept island with the remains of a lifeboat rescue station from the mid-1800s.
The workers who once ran the station on Hilbre Island did something that, unbeknownst to them, has become crucial for understanding the future of a hotter climate: They recorded the tides.
The data, scrawled in long, handwritten ledgers, is just one example of the tens of thousands of pages of tidal measurements stored in archives around the world.
Now, scientists and historians are racing to digitize them in an effort to understand how fast oceans are rising.
The aging notebooks establish a historical baseline to compare with today's changing world.
Sea level rise is accelerating around the globe, likely to displace millions of people who live in coastal communities.
Forecasts show between 3 and 6 feet of rise by the end of the century, or potentially more, depending on how much heat-trapping pollution humans emit.
Knowing exactly how much inundation to expect and how fast it's happening in each city can be tricky.
Sea levels rise at different rates in different places due to the movement of the Earth's crust and ocean currents.
Long-term historical data, diligently tallied when the shipping industry was king, provide a window into these geologic processes and help improve the complex computer models scientists use to forecast the future.
Those forecasts are crucial for helping cities prepare, whether it's building infrastructure to protect themselves or moving people out of harm's way.
Still, the vast majority of these historical records come from Europe and the U.S., leaving a glaring data gap in the Southern Hemisphere.
That has researchers scouring archives of the Global South, including the ledgers of former colonial powers.
"If we really know what happened in the past, it can really help us to help people with better projections," says Thomas Frederikse, climate scientist at NASA's Jet Propulsion Laboratory.
"Even one single record can really help us out in understanding what's going on."
"Srawl-y" historical records
The tidal logs gathered at Hilbre Island, just off the coast of Liverpool, weren't just a snapshot of the daily high and low tides.
Beginning in the mid-1800s, water heights were logged every 15 minutes, producing granular timelines of the ebb and flow.
Nearby, workers at the port of Liverpool kept the same detailed records beginning in the 1850s.
"You needed tide gauge records to know when it was safe to enter and exit the ports" says Andy Matthews, data scientist at the Permanent Service for Mean Sea Level, an organization that gathers ocean data worldwide and is also home to archival tidal records.
Tidal heights were recorded every 15 minutes, like in this ledger from Hilbre Island in 1903. Scientists are hoping volunteers will help digitize the data.
Andrew Matthews
The data collection was often done with automatic tide recorders, which used a float, sitting on the surface of the water, that relayed information to a recorder.
Dock workers or other maritime staff would then transcribe the numbers into huge tables.
"You can see some of them have very intricate handwriting and others are pretty scrawl-y," Matthews says.
"There's one record where at one point there's a little hand-scrolled note that says: no data this week because the tide gauge operator was off sick."
Matthews and his colleagues have scanned more than 16,000 images of the tidal ledgers.
But the data are still locked on the pages, because they haven't been extracted and digitized.
Using computers to read the data with character recognition can be hit-or-miss, based on the old handwriting.
So, Matthews
posted the documents on Zooniverse, where anyone can help transcribe the information, in the hope that volunteers will chip in from home.
"The world is going crazy out there but you can just focus on this sheet of numbers and type them and it lets you take your mind off that for a while," he says.
Sea level rise is localGlobal sea levels have
already risen about 8 inches since 1900 on average, but in some locations, the water has risen substantially higher.
"One of the really difficult things of sea level rise is that it happens everywhere on a different pace," Frederikse says.
"Sea level rise is not rising everywhere with the same speed. Like for example, the U.S. East Coast has seen a lot of sea level rise.
Since the Industrial Revolution, melting glaciers have caused a large part of the rise, but there are other causes scientists have had to tease out.
Massive ice sheets on Greenland and Antarctica are also melting at an increasingly rapid pace.
Oceans are warming, which causes the water itself to expand and take up more space. Around the 1960s and 70s, humans actually built so many dams that the rate of sea level rise slowed, because
reservoirs held water back and prevented it from reaching the oceans.
Even after scientists calculate how much water comes from all those sources, the Earth's oceans don't fill evenly like giant bathtub.
The planet's crust is slowly moving, essentially re-forming the shape of the bathtub itself. Heavy objects on land, like ice sheets, make depressions in the Earth. Then, when they melt, the crust slowly rebounds, a lot like what happens to a couch cushion when someone gets up.
During the last ice age, Greenland and Canada were heavily loaded with ice, so the crust there is still slowly rebounding after it melted away.
As it rises, the southern part of the North American tectonic plate is sinking, like the opposite end of a seesaw.
As a result, the East Coast, especially around the mid-Atlantic, has the fastest-rising sea levels in the country.
Ocean conditions like currents also dramatically affect sea level rise in any given place.
The water on one side of a current can be many inches higher than the other side.
The old tide gauge at Hilbre Island's lifeboat station.
Joanne Williams
For all those reasons, every coastal city faces a different level of risk. Having historical tidal records from many different locations helps scientists understand how these local conditions work. Once digitized, the records can be quickly added to the historical ocean data set that scientists use in climate computer models.
"If we don't have that information, it's easy to be like a few feet off if we don't have local records of sea level," Frederikse says.
"And it's decisions we have to make now. If you build a neighborhood in a floodplain and then you miscalculate the risk, then the people who live there in 50 years might pay the price."
Gap in the Southern HemisphereAs historical tidal records have been uncovered and digitized from Europe and the U.S., a glaring lack of data exists for the rest of the globe.
"The Southern Hemisphere — it's not really well covered," says Capt. Ariel Troisi, technical secretary of Argentina's Naval Hydrographic Service.
Troisi says it's a common problem across many forms of climate data, whether it's
temperature records or weather stations.
His department is currently working on recovering tidal records that began in 1905 at the port of Buenos Aires, taken to support shipping operations.
To rescue even older records, researchers are looking in the archives of former colonial powers.
As countries like France, Great Britain and Germany took control of other countries and extracted their resources, many gathered detailed maritime records.
Some assisted with geographic mapping, while others helped with port or shipping infrastructure projects.
In France, the country's national hydrographic and oceanographic service, known as
SHOM, has
digitized records from dozens of overseas ports where they once held power, ranging from West Africa to Vietnam.
"There are so many projects that are initiated right now to rescue these data, because with time, these documents can be lost again and again," says Alexa Latapy, a historical reconstruction expert at SHOM.
In some locations, the work involves piecing together records across the various governments that held power.
In Cameroon, doctoral student Yannick Fossi Fotsi has found tidal records from Germany, which was in power in the late 1800s.
After that, France took control until Cameroon won independence in 1960.
Tidal data like this 1930 chart provides a valuable baseline for understanding how fast oceans are rising around the globe today.
Andrew Matthews
While there are other short-term historical tidal records for the African continent, only one other multi-decade tidal record exists in Senegal, which Fossi Fotsi says makes it challenging for scientists to refine their global predictions for sea level rise.
"This can't be done only with stations in Europe, America and Asia, without stations in Africa," Fossi Fotsi says. "It's very important."
He's also hoping the historical records will lead to better information for Cameroon itself.
The country's economic capital, Douala, is extremely susceptible to sea level rise.
The coastal city, home to millions, is located in an estuary on the Atlantic Ocean and was
hit by a damaging flood last year.
Says Fossi Fotsi: "The effects of climate change are going to have an enormous impact on the coast and will have a huge effect in terms of coastal vulnerability."


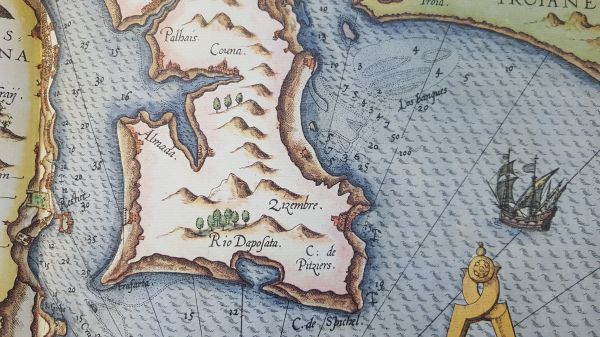
 Waghenaer's Chart No. 17.
 First imageFirst image of the newly calved Brunt Ice Shelf from Sentinel 2!
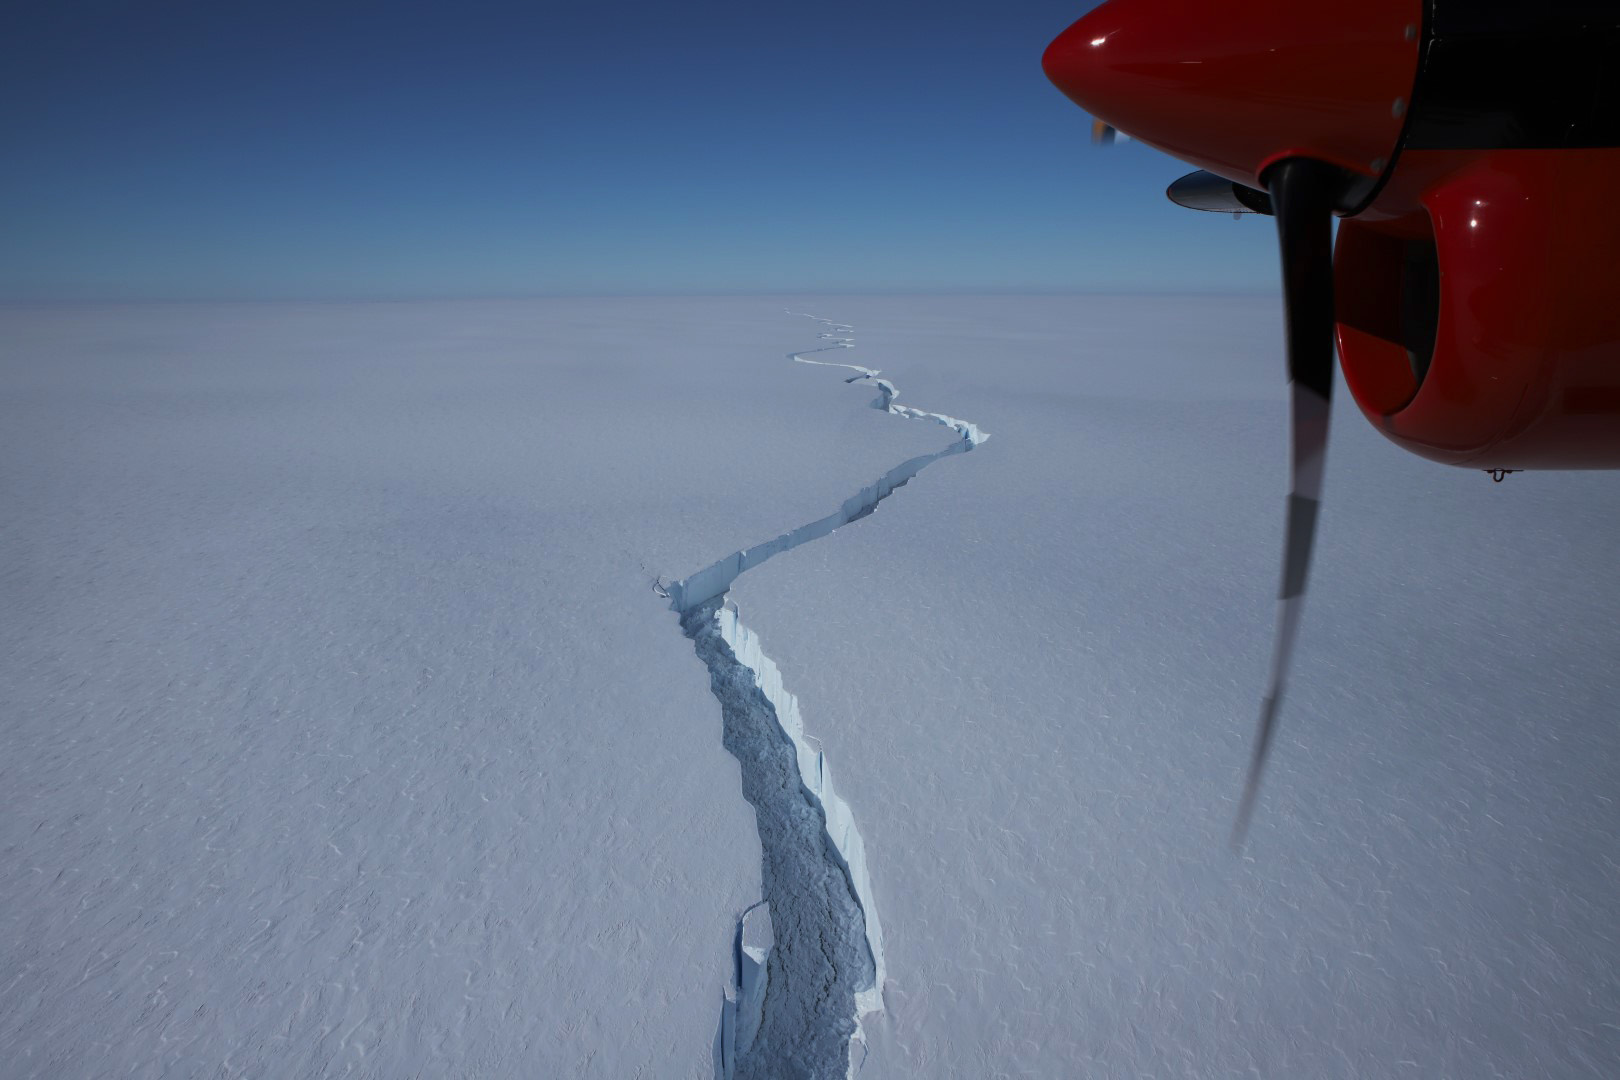
 North Rift crack photographed by Halley team in January 2021
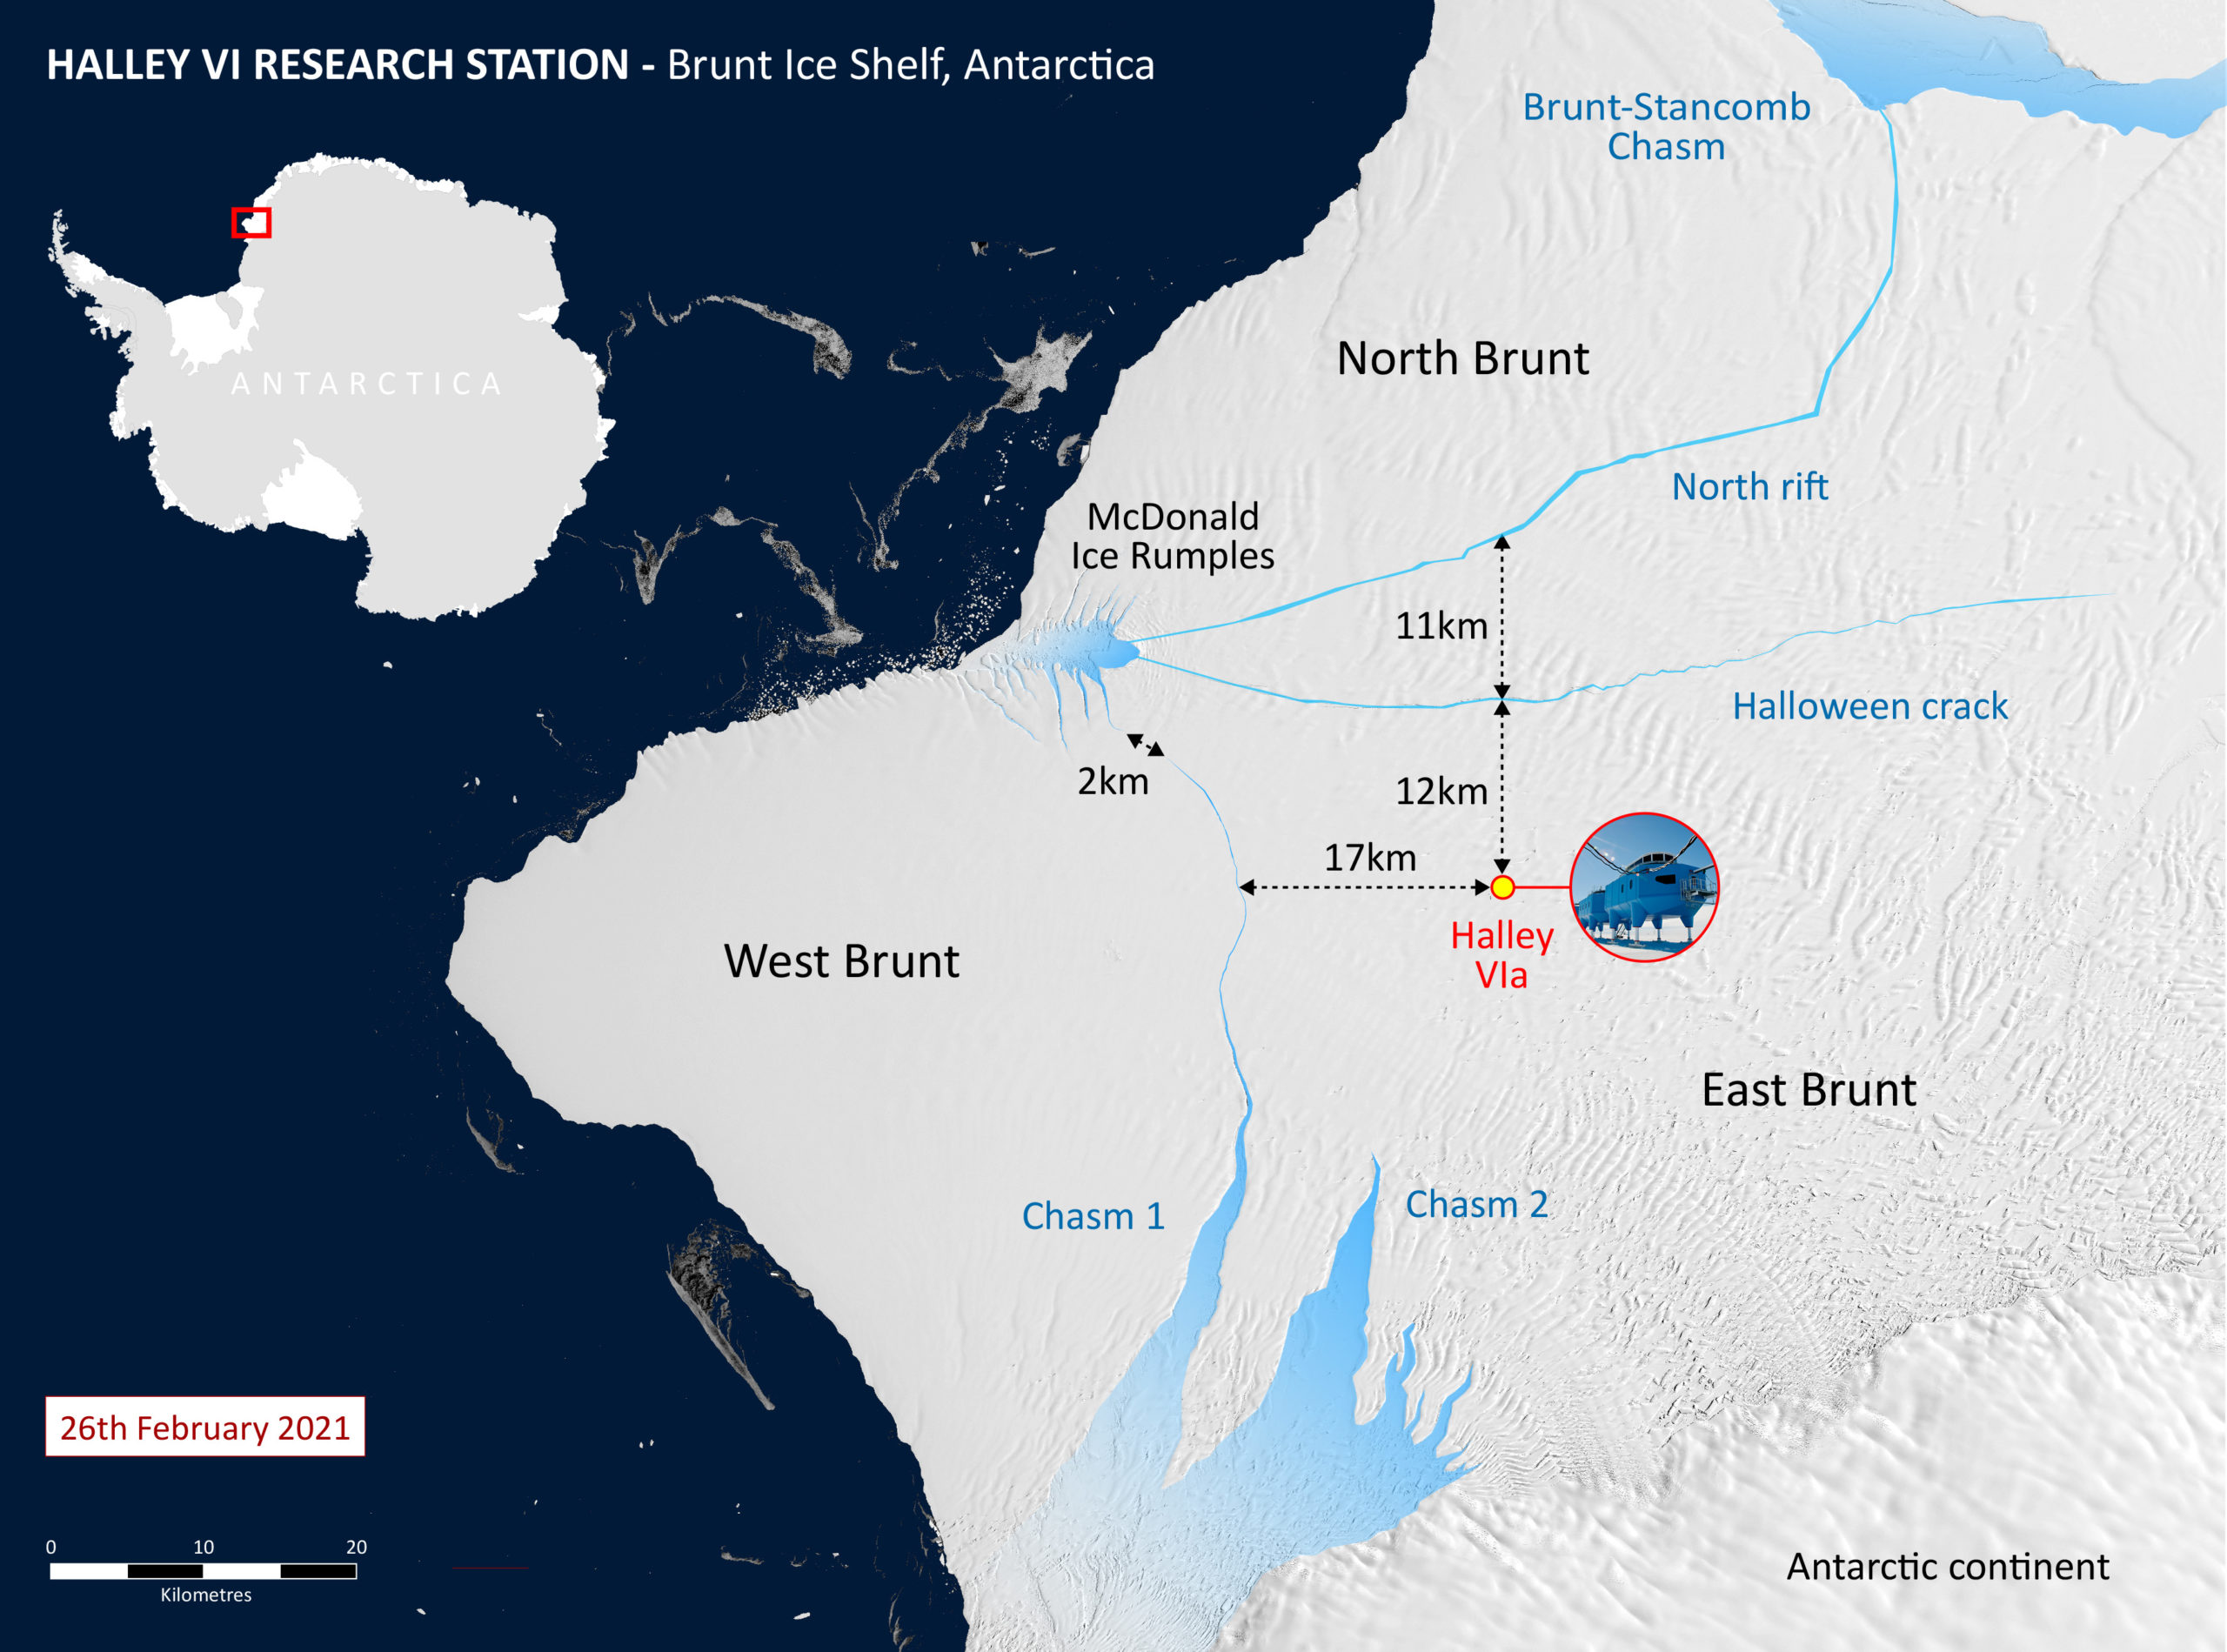
 Map of Brunt ice shelf and Halley Research Station