Saturday, May 5, 2018

Exploring and protecting the Antarctic


The Antarctic is one of the least explored places on the planet.
For the first time ever a marine biologist has ventured to unexplored parts of the seabed in a submarine.
Her discoveries have shocked the scientific community and could pave the way for the biggest no-fishing zone in the world

Friday, May 4, 2018

US NOAA layer update in the GeoGarage platform

4 nautical raster charts updated

This is the longest straight path you could travel on water without hitting land : not sure...


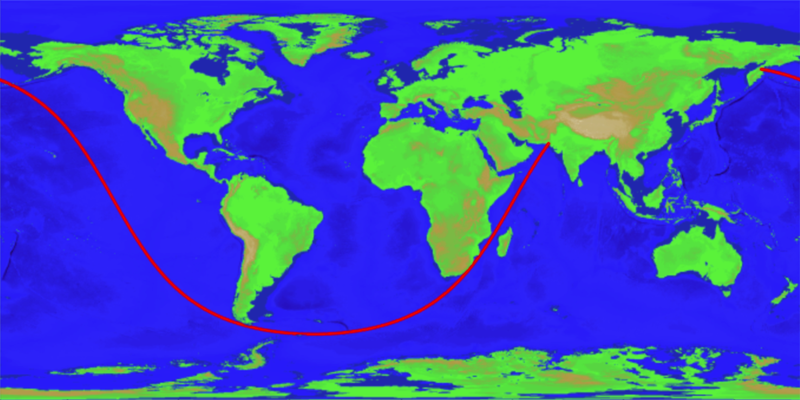
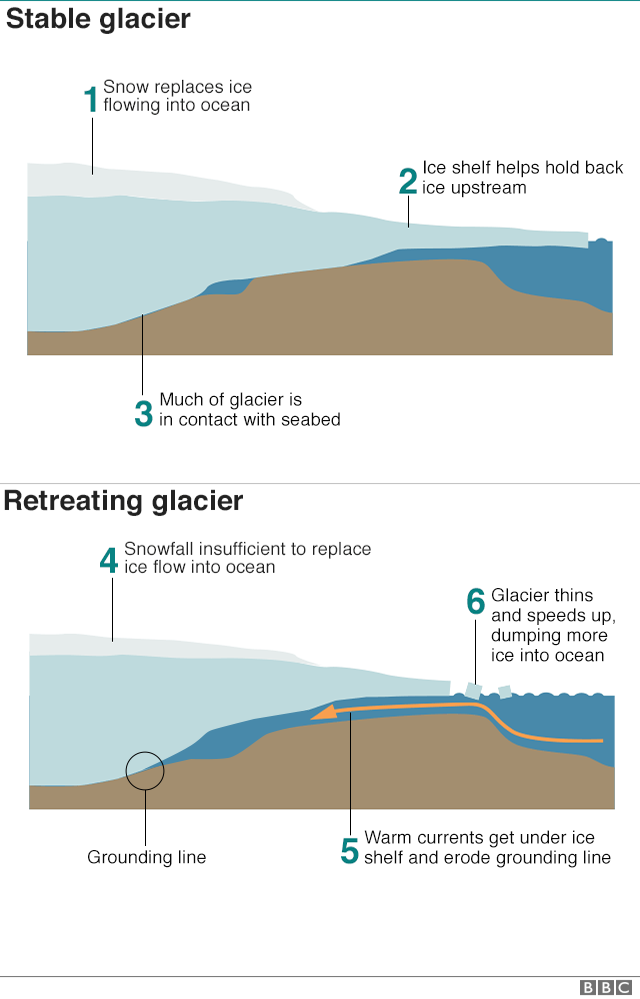
The longest sailable straight line path (shortest distance GC) on Earth.
Image: Chabukswar & Mukherjee, 2018

see also GCmap

From Gizmodo by George Dvorsky

Back in 2012, a Reddit user posted a map claiming to show the longest straight line that could be traversed across the ocean without hitting land.
Intrigued, a pair of computer scientists have developed an algorithm that corroborates the route, while also demonstrating the longest straight line that can be taken on land.

The researchers, Rohan Chabukswar from United Technologies Research Center Ireland, and Kushal Mukherjee from IBM Research India, created the algorithm in response to a map posted by reddit user user kepleronlyknows, who goes by Patrick Anderson in real life.
His map showed a long, 20,000 mile route extending from Pakistan through the southern tips of Africa and South America and finally ending in an epic trans-Pacific journey to Siberia.
On a traditional 2D map, the path looks nothing like a straight line; but remember, the Earth is a sphere.

 Researchers confirm that the longest straight line
on Earth by sea without hitting land begins in Pakistan and ends at Russia.
 Rohan Chabukswar, Kushal Mukherjee | arXiv

Anderson didn’t provide any evidence for the map, or an explanation for how the route was calculated.
In light of this, Chabukswar and Mukherjee embarked upon a project to figure out if the straight line route was indeed the longest, and to see if it was possible for a computer algorithm to solve the problem, both for straight line passages on water without hitting land or an ice sheet, and for a continuous straight line passage on land without hitting a major body of water.
Their ensuing analysis was posted to the pre-print arXiv server earlier this month, and has yet to go through peer review.

One obvious way to calculate the straight lines would be through a so-called “brute force” method, requiring a computer to measure the length of every stretch of ocean.
To that end, Chabukswar and Mukherjee acquired a map from NOAA showing the Earth’s surface at a very reasonable resolution of one mile (1.8 km).
Anything above sea level was considered land, and everything below water—an obvious limitation, but it’s the best data the researchers could acquire.
More problematically, however, the high degree of resolution provided required a computer to parse through a mind-boggling number of routes.

“There would be 233,280,000 great circles to consider to find the global optimum, and each great circle would have 21,600 individual points to process—a staggering 5,038,848,000,000 points to verify,” the researchers wrote in their study.
Let’s read that number aloud for full impact: That’s five trillion, 38 billion, 848 million points.

Chabukswar and Mukherjee did not have the computing power for such an operation, nor the time, so they turned to an optimization scheme called “branch-and-bound.”
Computer scientists use branch-and-bound algorithms as a way to solve optimization problems, and it lowers the overall amount of search time by breaking up tasks into smaller chunks, or subsets.
The optimization happens as each subset is analyzed, and pruned when it doesn’t meet the search criteria.
As the branches and sub-branches are iteratively eliminated, so too is the amount of data that requires analysis.

Armed with this technique and a regular laptop computer, Chabukswar and Mukherjee calculated the sea route in just 10 minutes.
And fascinatingly, their algorithm came to the same answer as the one shown in Anderson’s map, showing a straight line that extends from Pakistan to Russia along a path that runs for 19,939 miles (32,089.7 km).

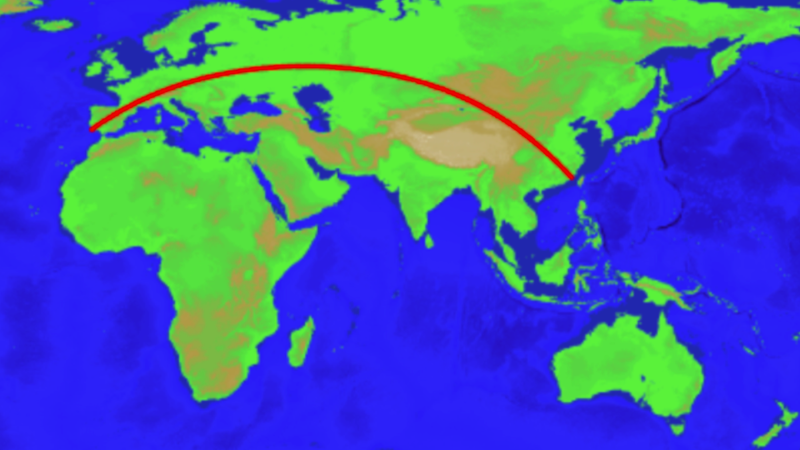
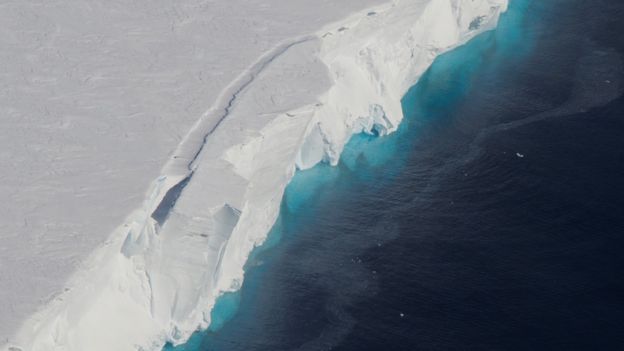
Longest driveable straight line path on Earth.
Image: Chabukswar & Mukherjee, 2018

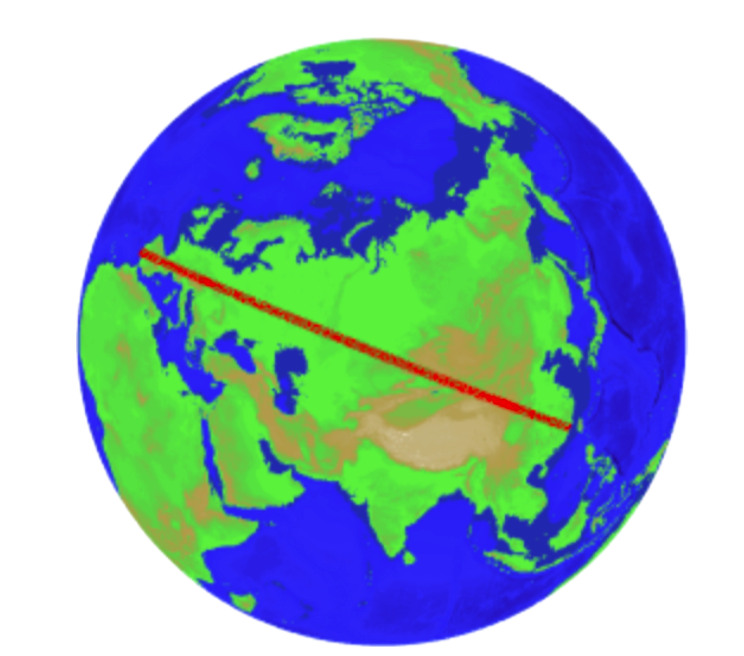
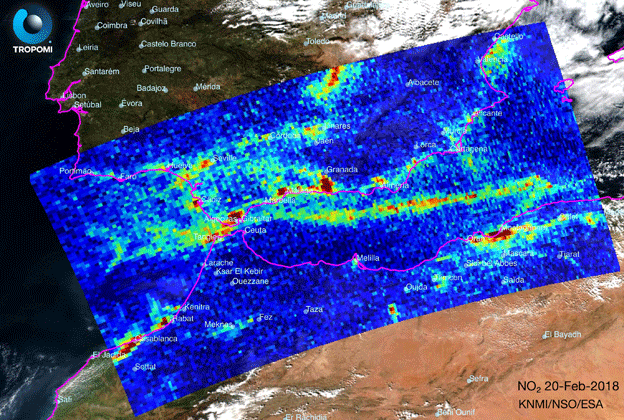
This view with a perspective directly above the path reveals a straight line.
Image: Chabukswar & Mukherjee, 2018

The researchers also calculated the longest possible straight line on land without hitting a major body of water, such as a lake.
The path, which took the computer 45 minutes to calculate, begins near Jinjiang, China, and cuts a swath through Mongolia, Kazakhstan and Russia.
The line continues through Poland, the Czech Republic, Germany, Austria, Liechtenstein, Switzerland, France, Spain, and finally ending near Sagres in Portugal.
That’s a total of 15 countries!
It’s not as long as the longest sailable path, but it still covers an impressive distance totaling 6,985 miles (11,241 km).

Chabukswar and Mukherjee call it a “driveable” path, but that’s highly unlikely given the many obstructions, such as mountains and forests, that are sure to be in the way.
Also, the land path intersects many rivers, which the researchers excluded as a variable.
Some major detours would likely be required to locate bridges, and to avoid some dangerous or challenging terrains.

On a similar note, the sea path, while a straight line, is probably not the safest or most ideal route given that it skirts treacherous Antarctic waters.
What’s more, the most expeditious sea route from Pakistan to Siberia would involve a trip through Indonesian waters, and the Philippine Sea.
As the researchers conclude in their study:
“The problem was approached as a purely mathematical exercise,” the researchers write.
“The authors do not recommend sailing or driving along the found paths.”

--------------------------------------------------------------------------------------------------------------------------

Comments from GeoGarage editor :

In the "Longest straight line paths on water or land on the Earth" document from Rohan Chabukswar and Kushal Mukherjee, the thrust of this paper is that they did a search of the possibilities to prove the original assertion, rather than just calculate it.
Their assumptions might also have been slightly different, given that they were using a dataset of heights with respect to sea level, rather than coastlines.

With the limits of the used dataset, the results show some issue in matter of lands crossing.

"The path originating in Sonmiani, Las Bela, Balochistan, Pakistan (25◦16′30′′ N, 66◦40′0′′), threading the needle between Africa and Madagascar, between Antarctica and Tiera del Fuego in South America (see above figures), and ending in Karaginsky District, Kamchatka Krai, Russia (58◦36′34′′ N, 162◦14′0′′ E)
The path covers an astounding total angular distance of 288◦35′23′′, for a distance of 32 089.7 kilometers.
This path is visually the same one as found by kepleronlyknows, thus proving his assertion"

In some previous articles from GeoGarage blog -see Links below- cited by the analysis, we also criticized the route given by kepleronlyknows, for the start and end points given the longest straight path you could travel on water without hitting land.

In practice, intermediate points along a Great Circle (GC) track are determined
and GC approximations are set by sailing a series of Rhumb Line (RL) tracks with constant courses.
View of the composite GC route (with 1731 wpts, length 10Nm)
on a Mercator map with OpenCPN software.

So another Great Circle (GC) composite route -with the start and end positions provided by Rohan/Kushal- has been created in kmz format to be viewed in Google Earth with 1731 waypoints with different bearings separated by 10 Nm .
The total length of the GC route is 17316.5 Nm.

 Start point (in red Rohan/Kushal)

 End point (in red Rohan/Kushal)
by the way, the end point of the red route is 3.45 Nm inside the lands. 
So the corrected length is 17,313 Nm

 The issue is that :
the Red route (Rohan/Kushal) crosses 2 islands :
the Fenimore rock in the Aleutian Island chain (US Alaska), probably not on ETOPO1 shoreline...

... and also Anjouan island in the Comoros
(see yellow GE coastline)

see Rohan/Kushal route in Google Earth :
kmz file to open in GE

The path fits the brief—the longest continuous line across the earth’s waters—but you may want to think twice before firing up your rudderless boat.
Unfortunately, an autonomous boat probably won’t be sailing the newly verified path anytime soon.
In fact, the researchers don’t recommend that anyone sail or drive these paths since the algorithm analysis does not ensure safe conditions along these tracks.
The authors note, a little pointedly: “The problem was approached as a purely mathematical exercise." (ref : Ellipsoid model, geoid model or any other, see Figure of the Earth)

So the game to find the longest straight path you could travel on water without hitting land is still open...

Links :

Thursday, May 3, 2018

How to lie with maps

Cover art from 'How to Lie With Maps'
 by Mark Monmonier, third edition 
University of Chicago Press © University of Chicago Press

From Financial Time by Alan Smith

The internet has profoundly shaped cartography, but has not made it more honest 

At the height of the 1820s boom in South American bonds, Gregor MacGregor, a veteran of Simón Bolívar’s campaigns against Spanish rule on the continent, arrived in London to sell bonds in the thriving Central American republic of Poyais.
Inevitably, a map appeared — which the Poyais-bound passengers on London’s first emigrant ships to the country must have clutched excitedly on the long journey to their new home.
Upon arrival, the fledgling country’s newest citizens found just one problem — Poyais itself didn’t exist.
Hundreds of settlers who had exchanged their life savings for a fresh start in the new world had unwittingly become victims of one of the most sophisticated confidence tricks in history.
Marooned in an uninhabited mosquito-infested swamp, most would pay with their lives.

 Detail from a map of Mosquitia and the Territory of Poyais

It’s easy to see how people were duped.
The handsome “Map of Mosquitia and the Territory of Poyais” tapped into our innate trust of maps.
If the map says so, then it must be true.
In fact all maps lie, even good ones, says professor Mark Monmonier, author of the classic book How to Lie With Maps.


A third edition has just been published more than two decades after the second, an intervening period in which the world wide web has profoundly reshaped the public perception and usage of maps.
A call with Mr Monmonier in his upstate New York home reveals a passion for maps undimmed by time.
Now 75, he still teaches cartographic design classes at Syracuse University’s Maxwell School.
A 2014 self-published autobiography details his journey from a 1969 PhD — one of the first doctoral dissertations to involve digital mapping — through decades of researching, teaching, writing and consulting on cartography and “spatial thinking”.
As we talk, it soon becomes clear that it is the actual impact of maps — particularly on culture, politics and science — that interests Mr Monmonier most.

 A map of Atlantis 'in its prime' from the Theosophical Publishing House of London (1896)
 
His attention-grabbing book titles (From Squaw Tit to Whorehouse Meadow: How Maps Name, Claim, and Inflame) are a clue that he wants to share his understanding of that impact far and wide. He hopes to debunk many of the myths associated with maps.
For example, the widely reported death of printed maps: “They haven’t died — they have just become more specialised.”
And unlike some map purists, he describes Google Maps as “an enormously valuable tool” both in itself, and as a platform for a variety of different mash-ups that allow people to put their own data on it.
He is even relatively lenient on Google Maps’ notorious use of the Mercator projection (which exaggerates area away from the equator, making Greenland appear as large as South America).
“It does not distort angles. This mathematical property, called conformality, allows only a minimal, largely unnoticeable distortion of local shapes and distances on individual [map] tiles at the more detailed zoom levels [Google Maps’ primary role]”.

 Graphic showing how two different map projections distort reality
© University of Chicago Press

Mr Monmonier is a technology enthusiast up to a point.
But if there is one area that continues to cause him concern, it’s the general ability of readers to know what a good map looks like.
The goal of How to Lie With Maps is to introduce a healthy scepticism in the way that we read and create maps.
“I’m not as optimistic as I’d like to be [about the state of map literacy] . . . people are not concerned about understanding technology as long as it seems to work”.
He cites the example of choropleth maps — those that use different shades of lightness and darkness to represent intensity — as easy to create, but also easy to get wrong.
But while uninformed errors might lead to regrettable mistakes, Mr Monmonier is keen to point out that maps lie open to deliberate manipulation: “Machiavellian bias can easily manipulate the message of a choropleth map . . . the white lies of map generalisation might also mask the real lies of the political propagandist”.
He talks about maps where readers are “very easily impressed by large areal units that may have relatively few people.
So when they look at a national map of the US where we have some states with relatively low populations — Montana, Wyoming and Idaho — they obviously create a much greater impact than, say, Massachusetts [which is smaller but has a greater population]”.


This seems like the right time to bring up a particular map now hanging in the White House.
Last year, Trey Yingst of the One America News Network tweeted a picture of a county-level map of the 2016 US presidential election heading into the West Wing.
It shows America predominantly Republican red with just small pockets of Democrat blue. Monmonier suggests the map “plays to the mindset of our president.
The fact is that Trump lost the popular vote by millions of votes — but the map doesn’t show this.
It needs to be balanced by another map”.
The cartographer Kenneth Field has done just that.
Using the same results data, he used dots to represent voters instead of continuous shaded areas to represent voting regions.
The difference is profound — Field’s results map looks a lot less red.
It is a stark example of the influence a cartographer can exert over a naive map reader.

Uses of maps for political propaganda are not new: How to Lie With Maps includes a German map from 1940 that portrays the UK as the aggressor in world war two.
More recently, observers have noted how China has adopted a new map projection that no longer requires distant disputed waters and islands of the South China Sea to be framed in an inset.

 'A Study in Empires' from from Facts in Review 2, no. 5 [February 5, 1940]

Mr Monmonier’s book also cites maps produced by the media as being particularly prone to “cartographic glitches”.
So, perhaps somewhat riskily, I finish our discussion by asking him for his thoughts on maps produced by the FT.
He promises to review and respond by email.
After a nervous wait, the professor’s opinion arrives “Excellent maps . . . I shared them with my map design class on Friday”.
With academic credibility conferred, I decide that now might be the time for us to step readers through the FT’s map design process.

Links :

Wednesday, May 2, 2018

Thwaites Glacier: Biggest ever Antarctic field campaign

The calving front of Thwaites Ice Shelf photographed from the IceBridge research plane.
The water acts as a blue filter for ice visible below the water's surface.
Thwaites Glacier flows into Pine Island Bay, in West Antarctica.
Credit: NASA / Jim Yungel 

From BBC by Jonathan Amos

It is going to be one of the biggest projects ever undertaken in Antarctica.

UK and US scientists will lead a five-year effort to examine the stability of the mighty Thwaites Glacier.

Thwaites glacier with the GeoGarage platform (NGA chart)

This ice stream in the west of the continent is comparable in size to Britain.
It is melting and is currently in rapid retreat, accounting for around 4% of global sea-level rise - an amount that has doubled since the mid-1990s.
Researchers want to know if Thwaites could collapse.
Were it to do so, its lost ice would push up the oceans by 80cm or more.


Timelapse satellite images of Thwaites Glacier melting

Some computer models have suggested such an outcome is inevitable if conditions continue as they are - albeit on a timescale of centuries.
But these simulations need to be anchored in many more real-world observations, which will now be acquired thanks to the joint initiative announced on Monday.

"There is still a question in my view as to whether Thwaites has actually entered an irreversible retreat," said Prof David Vaughan, the director of science at the British Antarctic Survey.
"It assumes the melt rates we see today continue into the future and that's not guaranteed.
Thwaites is clearly on the verge of an irreversible retreat, but to be sure we need 10 years more data," he told BBC News.

The UK's Natural Environment Research Council and the US National Science Foundation are going to deploy about 100 scientists to Thwaites on a series of expeditions.


Copyright NERC, Ben Gilliland

The International Thwaites Glacier Collaboration (ITGC) is the two nations' biggest cooperative venture on the White Continent for more than 70 years - since the end of a mapping project on the Antarctic Peninsula in the late 1940s.
Grants for research totalling £20m have been awarded.
Once the costs of transport and resupply to this remotest of regions is factored in, the total value of the ITGC will probably top £40m.


Thwaites is a marine-terminating glacier.
Snows fall on land and these compact into ice that then flows out to sea.
When in balance the quantity of snow at the glacier's head matches the ice lost to the ocean at its front through the calving of icebergs.
But Thwaites is out of balance.
It has speeded up and is currently flowing at over 4km per year.
It is also thinning at a rate of almost 40cm a year.
"When we look at the historical satellite record we can see that this thinning started after 2000, spreading inland at a rate of 10-12km/year at its fastest," explained Dr Anna Hogg from Leeds University.
"So on Thwaites Glacier, the increase in ice speed has coincided with a period of rapid ice thinning, and grounding line retreat, which suggests that the observed changes may have been caused by warm ocean water reaching the glacier and accelerating ice melt."


Map showing rates of grounding-line migration and their coincidence with ocean conditions around Antarctica between 2010 and 2016.
(Credit: Hannes Konrad et al, University of Leeds.)

The grounding line refers to the zone where the glacier enters the sea and lifts up to form a buoyant platform of ice.
If warm ocean bottom-waters are able to get under this shelf, the grounding line can be eroded and the glacier forced backwards even if local air temperatures are sub-zero.
Key to this process in the case of Thwaites is that a large portion of the ice stream sits below sea level, with the rock bed sloping back towards the continent.

 Image of Thwaites Glacier shot during a reconnaissance flight in West Antarctica.
(Photo courtesy of the National Science Foundation)

This can produce what scientists refer to as "marine ice sheet instability" - an inherently unstable architecture, which, once knocked, can go into an irreversible decline.
"The other process we're concerned about is something called marine ice cliff instability," said Dr Ted Scambos, the principal coordinating investigator on the US side of the project from the National Snow and Ice Data Center.
"This is where a tall cliff that might form at the front of the glacier begins to calve - begins to break away - in a runaway fashion.
It hasn't been seen yet in this part of Antarctica; it might be present in some parts of the Antarctic Peninsula, but around Greenland seems to be a path to a very rapid retreat of the ice front."

 The floating front of the glacier is hundreds of metres thick
photo : EMPICS

The ITGC aims to determine how all of this will play out for Thwaites.
Its scientists will map the ice stream's every behaviour.
They will monitor the way ocean water moves beneath the floating shelf, and drill sediments from under and just in front of the glacier to find out what it did during past warming events on Earth.

The work will involve multiple instruments and techniques, including the use of autonomous vehicles.
The yellow submarine known as Boaty McBoatface is expected to explore the cavity under the buoyant sections of Thwaites.

Seals will also be assisting the research.
Prof Karen Heywood from the University of East Anglia, working in tandem with St Andrews University, will be attaching sensors to the heads of the animals.
She told BBC News: "The seals dive in the course of their normal life and every time they come to the surface to breathe, the data are transmitted back home.
The seals monitor their own environment - where they went, how deep they dived, and how warm the water was they were diving in.
At the end of the year, they moult and the tag falls off, so they don't have to live with it forever."

Prof Vaughan said that while the UK and America were leading the project, he thought other countries would want to get involved.
"Funding from NERC and NSF has set this train in motion, but I fully expect other nations now to join their carriages."

Links :

Tuesday, May 1, 2018

Dockwise Vanguard


The loading took place in Geoje, South Korea and during the loading, the deck of the Dockwise Vanguard was submerged to receive the cargo.
The Goliat is the largest cargo loaded on the Dockwise, the largest vessel of her type ever built, and able to carry cargoes up 110,000 tonnes. 

The Armada Intrepid, which is owned by the Malaysian company Bumi Armada, is an FPSO (Floating Production, Storage and Offloading) vessel.
It has been successfully transported (dry transport).

Monday, April 30, 2018

Sentinel tracks ships' dirty emissions from orbit

The first images from Sentinel-5P. 
Although it will be a few months before the satellite is ready for service, these first results are expected to show just how this new Copernicus mission is set to be a game changer for monitoring air quality.
With air pollution putting the health of millions of people at risk, it is important to understand exactly what is in the air so that accurate forecasts can be issued, and, ultimately, appropriate mitigation policies put in place.
(ESA)

From BBC by Jonathan Amos & David Shukman

The new EU satellite tasked with tracking dirty air has demonstrated how it will become a powerful tool to monitor emissions from shipping.
Sentinel-5P was launched in October last year and this week completed its in-orbit commissioning phase.

But already it is clear the satellite's data will be transformative.
This latest image reveals the trail of nitrogen dioxide left in the air as ships move in and out of the Mediterranean Sea.
The "highway" that the vessels use to navigate the Strait of Gibraltar is easily discerned by S5P's Tropomi instrument.
"You really see a straight line because all these ships follow approximately the same route," explained Pepijn Veefkind, Tropomi's principal investigator from the Dutch met office (KNMI).
"In this case, we also looked into how many big ships there are in the region [at the time], and there's really not that many - around 20 or so, we estimate - but each one is putting out a lot of NO₂."

Shipping lane: The Tropomi instrument detects a suite of gases including nitrogen dioxide

Nitrogen dioxide is a product of the combustion of fuels, in this instance from the burning of marine diesel.
But it is also possible to see in the picture the emissions hanging over major urban areas on land that come from cars, trucks and a number of industrial activities.
NO₂ will be a major contributor to the poorer air quality people living in those areas experience.

First images of climate satellite Tropomi: a bird's-eye view of the world's hotspots of nitrogen dioxide (NO2) emissions.
The images were all taken in one day.

Sentinel-5P is the next big step because of its greater sensitivity and sharper view of the atmosphere.
"Shipping lanes are something we've seen on previous missions but only after we've averaged a lot of data; so, over a month or a year. But with Tropomi we see these shipping lanes with a single image," Dr Veefkind told BBC News.
"The resolution we got from our previous instruments was about 20km by 20km. Now, we've gone down to 7km by 3.5km, and we are thinking of going to even smaller pixels."

"Bottom up" accounting: Estimate of CO2 emissions from ships in 2016

Eyes in the sky

Far beyond the horizon, steaming through the remote High Seas, the great fleets of global shipping have for years been too distant to be observed.

Only in port can anyone catch sight of the plumes of dark smoke rising from the vessels' engines.
But added together, the greenhouse gases from the world's 50,000 ships make this industry the world's sixth largest emitter, and most of it is unseen.
This has long fuelled suspicions among environmental campaigners.

Exempt from the Kyoto Protocol and then the Paris Agreement, shipping acquired a reputation as a sector that dodged its responsibilities on climate change.
That's why the landmark deal earlier this month for a cut in emissions of 50% by 2050 received so much attention.
But it also raised a host of questions about policing: who would keep watch, and how?

Europe's Sentinel programme is part of the answer.
Suddenly, at just the right time, the world's shipping lanes are in full view.

S5P's availability is timely.
The shipping sector has just signalled its intention to make big reductions in its emissions over the next 30 years, in particular of the greenhouse gas carbon dioxide.

 Early comparison between CAMS current operational products (left) and first Sentinel-5P data products (right).
The snapshots presented here show the carbon monoxide distribution (average mixing ratio, in ppb), an important atmospheric pollutant and tracer of combustion sources, on two consecutive days. (Credit: CAMS data from ECMWF, Sentinel-5P data courtesy of SRON/NSO/ESA [Borsdorff, Landgraff et al., Geophys. Res. Let., 2018])

At the moment, those emissions are calculated in a "bottom-up" fashion.
By knowing the size of the global fleet, where it moves, the ships' specifications and how much fuel they are likely consuming - it is possible to estimate how much CO₂, or indeed NO₂, is being pumped into the atmosphere from exhausts.

But this all involves quite a few assumptions, and so the models need to be audited by some top-down analysis as well - which is where satellites come in.
S5P-Tropomi does not see CO₂, although its NO₂ observations can act as a tracer in the sense that wherever nitrogen dioxide turns up on shipping lanes, there will be CO₂ present, too.

 Sentinel5P infographic (ESA)

But the best solution would be a dedicated carbon-monitoring satellite.
This is why the EU has asked its technical agent on space matters, the European Space Agency, to design a Sentinel specific to the task.
Dubbed Sentinel 7 by many people, because that is the next available number in the series, this future mission should fly in the 2020s.
The aim is to be able track CO₂ down through the atmosphere on a scale of around 3km by 3km, but over a wide area.
That would make Sentinel 7 a forceful partner for Sentinel 5.

Links :

Sunday, April 29, 2018

The secret on the ocean floor : deep-sea mining

This historic film shows techniques used to conduct deep ocean mining of the sea floor, which were pioneered in the 1960s.
The potential for this type of mining (particularly of manganese nodules) was never fully realized.
Ironically, the program did end up providing the cover for the USNS Hughes Glomar Explorer (T-AG-193), a deep-sea drillship platform built for the United States Central Intelligence Agency Special Activities Division secret operation Project Azorian to recover the sunken Soviet submarine K-129, lost in April 1968.
Hughes Glomar Explorer (HGE), as the ship was called at the time, was built between 1973 and 1974, by Sun Shipbuilding and Drydock Co. for more than US$350 million at the direction of Howard Hughes for use by his company, Global Marine Development Inc.
This is equivalent to $1.67 billion in present-day terms.
She set sail on 20 June 1974. Hughes told the media that the ship's purpose was to extract manganese nodules from the ocean floor.
This marine geology cover story became surprisingly influential, spurring many others to examine the idea.
But in sworn testimony in United States district court proceedings and in appearances before government agencies, Global Marine executives and others associated with Hughes Glomar Explorer project unanimously maintained that the ship could not be used in any economically viable ocean mineral operation.

-> see BBC article by David Shukman