Saturday, May 28, 2022

Surfing a record 86-foot wave took guts. Measuring it took 18 months.


From WP by Noah Smith


Pro surfer Sebastian Steudtner was on his board, bobbing in the waters off Nazaré, Portugal, when he saw a lone monster approaching, steadily growing as it rumbled closer.
He nodded toward his Jet Ski driver and held the tow rope tightly.
“I knew it,” Steudtner, 37, remembers thinking.
“Get me this wave now.”

As the driver, Alemão Maresias, took a looping route into the wave, Steudtner could see the lighthouse, town and beach.
He was about 60 yards behind the peak when he released the rope.
He could hear his surfboard chattering and the wind roaring across his ears.
 

Sebastian Steudtner (GER) set a new GUINNESS WORLD RECORDS™ title for the largest wave surfed (unlimited) - male.
As part of the Red Bull Big Wave Awards, the WSL has verified Sebastian Steudtner's 2021 Big Wave Award-winning ride as 86 feet (26.21 meters), which was caught at Praia do Norte in Nazaré, Portugal on October 29, 2020.
 
“I’ll never forget what I saw when I started to drop behind the peak and saw the entire wave,” he said. “I started to accelerate like crazy. I had tears from the wind speed and was just holding on with everything I had — not doing anything funny, just hanging on.
“You don’t feel the size,” he added.
“You feel the power. I felt the most power of any wave I’ve surfed at Nazaré.”

That memorable ride was in October 2020, and it took a full 18 months for the German surfer to learn just how big the wave actually was that day.
The World Surf League and a team of scientists, along with Guinness World Records, revealed Tuesday that Steudtner’s wave measured 86 feet tall, making it the largest ever surfed.
 
courtesy of L'Equipe
 
 
2021 Men's Biggest Tow Sebastian Steudtner at Nazare on October 29, 2020.
Video from Jorge Leal.
 
The record eclipses Brazilian Rodrigo Koxa’s previous mark, set in 2017 at Nazaré, a wave that measured 80 feet.

For Steudtner, going from the pounding waves off Portugal’s Silver Coast to the record books involved a complicated, exhaustive measurement process.
Traditionally, measuring wave heights in the surfing community has been fraught, a kind of guesswork bolstered by a surfer’s experience, with the unit of measurement often being the human body (“head-high”).
The surfing community also has a notable, fundamental schism in determining wave heights.
The Hawaiian scale involves an estimate from behind the wave, which produces a much smaller number than a crest-to-trough measurement from the front.
 
Sebastian Steudtner, a 37-year-old surfer from Germany, rode a giant wave in October 2020 in Nazaré, Portugal.After 18 months of detailed analysis, he learned the wave measured 86 feet, making it the largest ever surfed. (Jorge Leal/World Surf League)

Despite technological advances, the process for accurately measuring big waves still involves scientific rigor and creativity.
Experts pore over photographs, trying to determine the most reliable measurement reference point.
“You want the largest ruler possible in the image and to validate its size,” said Adam Fincham, a University of Southern California associate professor of engineering who specializes in geophysical fluid dynamics and led the analysis of Steudtner’s wave.

While Jet Skis — which are used to tow surfers into the world’s biggest waves — are the gold standard because their size is known and does not change, they are usually not present during key moments of a surfer’s ride.
An entire body is also less useful, according to Fincham, because surfers will bend their knees or otherwise change their height during a ride.

The standard Fincham and his colleagues from Scripps Institution of Oceanography at the University of California San Diego and the Kelly Slater Wave Company settled on this year was Steudtner’s lower leg, from his heel to his kneecap.

“That distance does not change since you can’t bend your lower leg,” Fincham said.

Sebastian Steudtner has made a name for himself chasing big waves.
 
“It’s like freedom,” he says of life on the water.
(Boris Streubel/Getty Images)

The team asked Steudtner to measure that length, which effectively gave them a ruler for the image of the surfer’s ride.

The experts must study the image closely, accounting for distortions that might misrepresent the wave’s size. Different angles and camera lenses could muddle the process.

To account for how to correct the images, Fincham traveled to Nazaré and stood at the locations where photos and videos of Steudtner’s ride were captured, calculating the camera angles and the distance of the camera to the wave face.
He also interviewed the two photographers whose imagery was used to analyze the wave, learning more about the equipment they used and how they leveled their cameras.

With this information in hand, the analysis team used 3D modeling software to geometrically correct the photos and convert pixels to inches.
Using the lower leg standard, they could begin to measure the wave from trough to crest.

Since he began analyzing waves a few years ago, Fincham said, the science has evolved with a better understanding of camera parameters.
He also said using the lower leg as a reference point is a step forward, though he noted that not all surfers keep their front leg as perpendicular as Steudtner.

Asked about his assessment of the accuracy of their work, Fincham said, “That’s a difficult question,” and noted his team arrived at a number for which there was consensus.
“When you look for a record ... you need a number. You can’t say, ‘It was just about that,’ ” he said. “We’re comfortable with it.”

Sebastian Steudtner made headlines for a wave he surfed in Nazaré, Portugal, in January 2018.
But he said his record-breaking ride from 2020 was more powerful. (Octavio Passos/Getty Images)

While some might still think of surfing as a carefree activity, Fincham said he and his team kept the stakes of big wave riding in mind during their work.
“These guys are risking their lives, and you have to respect that and take it very seriously,” he said. 
“We really want to do the best job we can so they have some confidence in it, and we owe it to them to do our best job.”

While Steudtner’s ride is now authenticated by Guinness World Records, there are others who’ve claimed to have surfed even bigger waves.
Even Steudtner has ridden waves that some have estimated to have topped 100 feet.

But sometimes the photos and videos don’t support the claims, and other times surf officials and their teams of scientists study the evidence and find something lacking.

Given the difficulty of accurately measuring a wave’s size, the World Surf League limits the time-intensive process to rides that are honored at the annual Red Bull Big Wave Awards.
Steudtner’s big wave was eligible for review because he won the Biggest Tow Award in 2021.
“No one’s saying this is the biggest wave ever surfed in the world,” Fincham said. 
“It certainly might be, but this is the biggest certified wave. There may have been a bigger wave surfed; there’s just no photo of it.”

While Steudtner is proud to have the record, he does not see it as the most important part of his story.
“Being from Germany and Austria, I wasn’t meant to be a surfer. Anything that you can dream up and set your sight on, if you never give up and pursue it, you can reach it,” he said.

When next season approaches, he said, he will be ready for an even bigger bomb, though record-chasing is not what drives him.
“It sets me free,” he said of life on the water. “It’s like freedom.”

Friday, May 27, 2022

Tonga eruption discoveries defy expectations

[Image: NIWA-Nippon Foundation TESMaP]

From NIWA by Jessica Rowley

New findings from the record-breaking Tongan volcanic eruption are “surprising and unexpected”, say scientists from New Zealand’s National Institute for Water and Atmospheric Research (NIWA). 
 

NIWA’s research vessel, RV Tangaroa, has returned from a month-long expedition as part of the Nippon Foundation-funded Tonga Eruption Seabed Mapping Project (TESMaP), where scientists were studying the effects of January’s eruption of Hunga Tonga–Hunga Ha'apai (HT – HH).

Due to the power of the explosion, researchers expected to find dramatic changes to the volcano, but instead found it largely intact. 

The research is also supported by The Nippon Foundation-GEBCO Seabed 2030 Project which aims to map the world’s ocean floor by 2030.
 
Scientists on board RV Tangaroa operate the multibeam echosounder revealing the impact of January’s eruption. [Photo: NIWA-Nippon Foundation TESMaP / Rebekah Parsons-King]
 
NIWA mapped 22,000 square kilometres of the surrounding seafloor, which showed changes covering an area of 8,000 square kilometres.
NIWA scientists recorded up to seven cubic kilometres of displaced material – the equivalent of 5 Wellington Harbours or 3 million Olympic-sized swimming pools – but there is likely more yet to be seen.
Tonga’s domestic internet cable that was broken and cut off communication is buried under 30 metres of ash and sediment. 
 

The voyage leader, NIWA marine geologist Kevin Mackay, says that he was completely taken aback by what they first saw.
“With an explosion that violent – the biggest ever recorded – you would expect that the whole volcano would have been obliterated, but it wasn’t. While the volcano appeared intact, the seafloor showed some dramatic effects from the eruption. There is fine sandy mud and deep ash ripples as far as 50 kilometres away from the volcano, with gouged valleys and huge piles of sediment.” 
 The team also studied impacts on the ecosystem.
 
Sea life caught by underwater cameras on a seamount 80km from the volcano.
[Photo: NIWA-Nippon Foundation TESMaP]
 
The volcano is devoid of biology, but remarkably there are features as close as 15 kilometres away that still have abundant and diverse populations of fish and other animals.
Scientists speculate that they escaped impact by being out of the eruption flow’s pathway, or far enough away to avoid thick ash fall. 
 
Underwater footage showing sediment covering the flanks of the volcano.
[Photo: NIWA-Nippon Foundation TESMaP]
 
NIWA marine biologist Dr Malcolm Clark says that having healthy life close by is a positive sign.
“Although the seafloor on the volcano is largely barren, surrounding seamounts have pockets of normal biodiversity, such as corals, sponges, starfish, and mussels, indicating the resilience of such marine ecosystems and giving some hope for recovery. More work needs to be done before we can be confident of how the ecosystem will respond, but these surviving animal communities indicate what kind of life may repopulate HT-HH. The sites sampled during the voyage give us a baseline for monitoring recovery in the future.”

NIWA also tested the water column for physical and chemical characteristics, including temperature, nutrients, and oxygen concentration.
 
Researchers collect water samples from the CTD.
[Photo: NIWA-Nippon Foundation TESMaP / Rebekah Parsons-King]
 
Preliminary data shows that the water column is still recovering, and some airborne ash is yet to completely settle on the seafloor.
There is also evidence that the volcano may still be erupting, with a dense ash layer found in the upper water column near the volcano.

NIWA biogeochemist Dr Sarah Seabrook says the persistence of ash they saw in the water column has a myriad of impacts on the ocean ecosystem.


Researchers use seafloor sediment samples to understand the impact of the eruption.
[Photo: NIWA-Nippon Foundation TESMaP / Rebekah Parsons-King]
“In the immediate aftermath of an eruption, volcanic ash fertilises microscopic ocean algae thanks to the ash’s concentration of nutrients and trace metals - in this case, there was a bloom of life so big that we could see it from space."
“However, the unexpected persistence of the ash in the water column is creating prolonged impacts. For example, spikes in volcanic ash were coupled to the appearance of oxygen minimum zones – where oxygen levels in the water are at their lowest - which could have implications for important services provided by the ocean, such as food production and carbon sequestration.”

Scientists also collected hundreds of samples during their mission, including seabed cores, various corals and 250 kilograms of rock, some of which were newly formed from the eruption. 
 
Deploying the towed camera system to gather live images of the seafloor.
[Photo: NIWA-Nippon Foundation TESMaP / Rebekah Parsons-King]
 
The TESMaP project provides a unique opportunity to study the effects of an undersea volcano, which has huge implications for nations and ecosystems that live near these natural wonders.

Fisheries are a vital part of Tonga’s economy and subsistence, with species such as snapper and tuna being key to the region. There has been a reduction in some of Tonga's fleet, with many boats damaged in the tsunami which followed the eruption. Rebuilding the fleet is the highest priority and it will be a while before it is fully understood how fisheries have been impacted. 


The mission has also given important insight into the fate of the broken domestic internet cable, with strong indications that this will need to be fully replaced.

Tonga’s Deputy Secretary for Lands and Natural Resources Taaniela Kula says this work is vital for the recovery of Tonga.
“The eruption sent shockwaves around the world, but the effects were felt most keenly in Tonga. It was a miracle to lose so few lives (God rest their souls), but our streets, crops, air, and waters were devastated."
“We, along with other nations on the Pacific Ring of Fire, know only too well how at mercy we are to nature. By studying an unprecedented event like this in such detail, we will gain invaluable knowledge and experience so we can recover quickly and be prepared for the next time something like this happens.”

The Nippon Foundation’s Executive Director Mitsuyuki Unno mirrored Mr Kula’s words.
“The eruption of Tonga’s underwater volcano is not ‘fire on the opposite shore’ but is also of great relevance to us living in Japan. We enjoy the ocean’s rich blessings but are faced with the risk of natural disasters that come with being an island nation on the Pacific Rim.
“This project is being conducted in the hope that understanding the effects of the volcanic eruption will contribute to the recovery of Tonga, where the sea is an important resource, and to the disaster preparedness of many countries, including Japan.”

The second part of the TESMaP mission will see the caldera mapped by an uncrewed surface vessel (USV), which was built by SEA-KIT International and is currently being transported from the UK.


The caldera was unable to be surveyed during NIWA’s voyage because of safety reasons.

CEO of SEA-KIT Mr Ben Simpson says their vessel will fill in the final pieces of the puzzle.
“Our USV Maxlimer will map the current shape of the caldera and measure environmental conditions of the water above it, which are things we don’t yet know. Maxlimer will be controlled remotely from Essex in the UK, which is 16,000km away! The unmanned vessel will also use an innovative winch and sensor deployment capability to map any new volcanic activity. This is a truly global effort to get the full picture of a globally significant event, and we’re delighted to play our part in it”.

The unmanned part of the research mission to study the caldera is expected to be completed in mid-July.

A remote underwater glider used to gather data from the water column surrounding the underwater volcano.
[Photo: NIWA-Nippon Foundation TESMaP / Rebekah Parsons-King]

Thursday, May 26, 2022

Why it is misleading to claim that maps prove ships are stuck near China?


All tracked vessel traffic on the seas around East Asia
A representation of various kinds of marine craft and assets off the Chinese coast.
All of the graphics in this article are screen captures, that were captured within a few minutes of each other.
Social media commentators claim that the are ships somehow allegedly “stuck” off China.
Source: Marinetraffic.com
 
From MarPro & Shipping Australia

If you’re a regular consumer of shipping-related social media, you’ve probably recently seen a few maps showing the coast of China with a mass of small dots representing ships.
Social media posters claim that the ships are stuck there because of the COVID lockdowns in China.
They often also claim so that ships are being held up for more nefarious reasons.
We won’t discuss these other reasons, they’re just nonsense as far as we can tell.
We will focus on the shipping side of things.

Look, there are clearly supply chain issues caused by the COVID lockdowns.
But there aren’t hordes and hordes and hordes of ships stuck on the Chinese coast.
For a given definition of “normal,” the situation is, well, pretty normal.

What’s going on?

You’ve probably seen something like this.
It’s a map of eastern Asia, and, specifically, what is floating on the seas around Asia.

What you’re looking at here is a graphical representation of various floating things (ships mostly) on the sea off east Asia.
The positions of the floating objects were live and current at the time of writing.

Various social media commentators of various kinds incorrectly claim that these maps show ships somehow “stuck” off the Chinese coast, usually they claim it is because of Chinese COVID-control policies and / or there are allegations that some kind of nefarious activity is going on.

Let’s really think about what we’re looking at.

Everything that floats

Floating on the sea are a variety of things.
These floating things include ships.

And also tugs.
And yachts.
And fishing vessels.
And buoys.
And a wide variety of other things that float.

A great many of these things have tracking devices on them, which anyone with a tracker can pick up.
So what you’re looking at is the digital representation of a great many things that are afloat.

Let’s look at the geography.
Well, clearly, we’re looking at the sea space around China, and South Korea, and Japan.
North eastern Asia is the centre of world manufacturing.
North east Asia is also a relatively prosperous part of the world and it has a huge population.

Manufacturing+population+income = high volumes of ships.

High volumes of ships = high volumes of other watercraft (tugs etc) and floating nav aids.

So what we’re looking at are huge volumes of tracked, floating watercraft in a region of the world that is known for, and quite logically would have, huge volumes of tracked, floating watercraft.

OK.
So if we get rid of the non-freight carrying watercraft, the map looks like this:

Freight Carrying vessel traffic on the seas around East Asia
 
Graphic: sea-freight traffic on the seas of east Asia.
Source: Marinetraffic.com


Although it is a bit less intense, the map is still heavily marked.
But that should be expected in a heavily trafficked sea area.
It’s also a huge sea-area.
From the top of North Korea (as pictured on the map above) south to Manila, the Philippines, is about 3,050 km (1,900 miles) or so.

Comparators: the Med and the Gulf

Let’s have a look at some comparators, namely the Mediterranean and the Gulf of Mexico.

Europe and East Atlantic
 
Comparator: Europe / Mediterranean.
Portugal to Crete is about 3,000km.
Graphic: Marinetraffic.com


Gulf of Mexico
 
Pictured the Gulf of Mexico.
From Matamoros (Mexico, on the Mexico / US border) to a point just east of Puerto Rico is about 3,000km.
Graphic: Marinetraffic.com

So both spaces have a lot less traffic than North Asia.
But this is expected.
And both graphics show that having large volumes of freight carrying ships in a given area isn’t exactly unusual.

We can see this better if we zoom in.
We’ll now look at the space around the two top container ports by volume, namely, Shanghai and, for comparison purposes, Singapore.

Shanghai
 
Pictured: a close up of the traffic at Shanghai, China.
Note the scale (10km or 5mi) bottom left.
Graphic: Marinetraffic.com


Singapore
 
Pictured: a close up of the traffic in the seas around Singapore, south east Asia.
Note the scale (10km or 5mi) bottom left.
Graphic: Marinetraffic.com


So, once again, what are we looking at?
Green shapes indicate cargo ships of various kinds that are not tankers.
Red indicates tankers.

By now you have probably noticed that the icons representing ships have different shapes.
A key thing to note is that, in all the maps above, the round circles represent ships that are not moving.
The arrow-like shapes indicate ships that are moving and the direction that they are moving in.
As you can see there’s a lot of stationary ships at both Shanghai and Singapore.

The fact that some ships are stationary and others are moving is another key reason why many of the maps you see on social media are misleading.
One of the reasons we’re using the Marinetraffic.com maps is that, unlike many of the maps you see on social media, this system distinguishes between stationary and moving ships.
Many of the social media maps just show icons that, it is alleged, represent the positions of ships.
Even if that claim is in fact true, it’s highly misleading if you don’t know whether the ships are moving or not.

A superficial eyeballing of the two graphics would tend to suggest that there are maybe about as many stationary ships at Shanghai as moving ships and that possibly, in Singapore, the stationary ships outnumber the moving ships.
Maybe.

Regardless of the exact count, it is clear that stationary ships do not massively outnumber the moving ships at Shanghai and that there is a similar situation at Singapore.
If ships were getting “stuck” off China because of a lockdown in China then we would expect to see a massive number of stationary ships compared to ships underway at Shanghai.
In contrast, Singapore would likely show what it does now: large numbers of stationary and moving ships.

But we see more or less the same situation at both ports.
That would tend to indicate that ships are not getting stuck off the coast of China.
The comparator, Singapore, would also tend to show that having large numbers of ships stationary off the coast is not something that is confined to China.
It could be argued that the Singapore situation suggests (depending on port) that having large numbers of ships stationary off the coast can be regarded as “normal”.

So the various social media commentators’ general allegations that there is a supply chain crisis because ships are somehow getting stuck off the coast of China would be appear to be unfounded by evidence.

Details are lost… or revealed… depending upon scale

A final problem with the graphics presented by many of the social media commentators is that you can’t really see what’s going on because the graphics cover such a huge sea area.
A lot of the detail is obscured.
In the first graphic presented at the top of this article, the scale is about 500km and we can’t even see Shanghai, which has disappeared under horde of icons.
Even at the 10km scale there are icons-on-top-of-icons.

Let’s (metaphorically) squint a bit and see what we can see at the 1km scale.
Once again, green represents freight ships (not tankers) while red icons represent tankers.

Shanghai


Singapore
 
Pictured: freight traffic at Singapore, near the airport, 1km scale.
Source: Marinetraffic.com

As can be seen, close to one, specific, part of Shanghai, there are are lot of vessels that are underway (arrow-shaped markers).
So, on maps that don’t distinguish between stationary ships and moving ships, it will simply look like there’s a lot of ships nearby a port.
But it would be completely wrong for a viewer of the map to jump to the conclusion that there are ships stuck by the port merely because there are lots of ship-icons there.
The 1km-image showing (above) showing the space off Shanghai airport is a good example.
There are about 54 ships underway, of which about six are stationary.

Meanwhile, in the second of the 1km-image maps, which show an area close to one, specific, part of Singapore, there are a lot of vessels that are stationary.
It is impossible to see this level of detail unless you really zoom in, which is yet another reason why the maps you may see on social media are misleading.

The two close-up maps are also misleading by themselves.
Different close up maps of different parts of the areas around Shanghai and Singapore will show different situations.
With a bit of searching it would be easy to find lots of stationary ships around Shanghai and lots of ships underway around Singapore.
The fact is, ports may well have a lot of ships nearby that are underway and a lot of ships that are stationary.

There’s a few reasons for this.
The first is because of the fundamental nature of ports: they’re places where ships go to load and unload cargo so, logically, some ships will be stationary and some underway.

Ports also have “anchorage” areas around them where ships go and wait for various reasons.
Waiting to go into their turn at berth is one reason.
Another, is that in places like Singapore, it may be a physically sheltered area with little adverse weather at the equator.
Ships can safely wait there until they’re needed to carry cargo.

What type of cargo ship, exactly?


Another point to note is that, if you click on the icons, it may tell you what type of vessel it is.
A lot of the icons around Shanghai represent river-shipping cargo ships.
China has massive (long, wide and deep) navigable rivers, particularly the Huang He (Yellow River) in the north, the Yangtze River in the centre, and the Zhu Jiang (Pearl River) in the south.
These rivers enable vast movements of river cargo ships, so many of the icons that will be seen in the rivers, the river mouths and near the coast of China on ship tracking systems are river cargo vessels.
They may be small but there are so many of them.

The two close-up images also show that there’s a lot of detail that can be missed as the icons pile on top of each other when you are looking at a bigger scale / from further out.

Conclusion


Anyone trying to interpret meaning from graphics like these above needs to know a little bit about shipping, operational matters, patterns of trade, and patterns of ship movements around ports to understand why a set of ships may be stationary, or underway, and to draw reasonable inferences from the graphics.

So there is a two-fold conclusion:
  • be sceptical of maps with lots of dots that purport to show some kind of supply chain crisis;
  • you really can’t believe everything you see or read on social media!

Links : 

Wednesday, May 25, 2022

‘Deep-sea gold rush’ for rare metals could cause irreversible harm

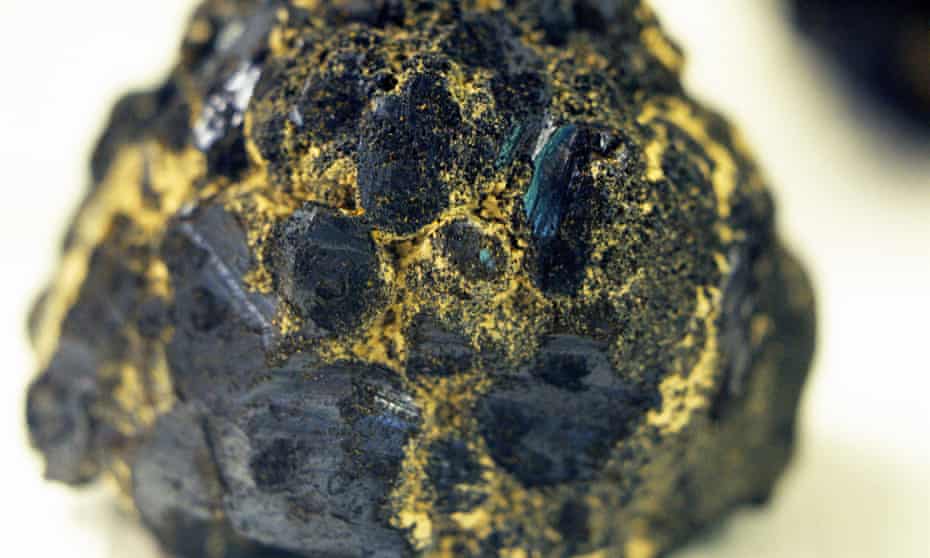
Manganese nodule from deep sea.
Photograph: blickwinkel/Alamy

From The Guardian by Rupert Neate

Mining companies are planning to profit from the new industry, but environmental campaigners warn of disastrous consequences

In a windowless conference room in Canary Wharf, dozens of mining executives, bankers and government officials are being promised unique insights into how to profit from “the deep-sea gold rush”.

The hoped-for gold rush lies thousands of miles away on the bed of the Pacific Ocean, where trillions of potato-sized nodules of rare earth elements vital to power the next generation of electric cars have been discovered 4,000m below the surface.

Mining companies are hoping that global rules to allow industrial scale deep-sea mining to collect the haul could be set in place as early as July 2023.

However, environmental campaigners warned that mining for the metals would be “dangerous”, “reckless” and cause “irreversible harm” to little-known ecosystems.
One estimate suggests that 90% of the deep-sea species that researchers encounter are new to science.

Louisa Casson, a Greenpeace campaigner, criticised the industry for running the conference and banks for considering investing in the “dangerous and unnecessary” projects to “make a quick profit”.

“This destructive new industry wants to rip up an ecosystem we are only just starting to understand,” she said.
“[They are] aiming to make a quick profit while our oceans and the billions of people relying on them bear the costs.”

The nodules in the Clarion-Clipperton Zone between Hawaii and Mexico were first discovered by the crew of HMS Challenger in 1875, but only recent developments in underwater robotics have made large-scale mining of the metals possible.

The UN-affiliated organisation that oversees the controversial new industry has granted licenses for companies to explore the area, but full-scale mining has yet to start.
That could soon change, however, as the tiny Pacific island nation of Nauru has triggered a “two-year rule”, giving the International Seabed Authority (ISA) two years to implement regulations governing the industry.
That set a deadline for a roadmap to be adopted by 9 July 2023.

“Deep-sea gold rush is a gamechanger,” read adverts for the Deep Sea Mining Summit 2022 at the Hilton London hotel in the capital’s Canary Wharf district, for which delegates paid £1,195 for the two-day event this week.
“After years of negotiations and false starts, deep-sea mining is close to a breakthrough.

“As we move into an era of mining the deep-ocean floor, the world’s most remote environment, mining companies are working on overcoming the perceived challenges and developing island nations are watching with interest.
As the demand for base metals and minerals surges ever beyond what our land is able to provide, new technological and technical developments are helping to drive forward this new industry.”

Daniel Wilde, economic adviser on oceans for the Commonwealth Secretariat, which represents Nauru and many of the other small island states keen to start seabed mining, told the conference that he expected the ISA to agree a payment regime that would hand mining companies a post-tax profit of 17.5%.

However, he warned the audience that “the two-year deadline does seem quite tight, [and] if it’s not agreed there are questions about what happens next”.

Ebbe Hartz, a geologist at Aker BP, a Norwegian oil exploration company part-owned by BP, said mining for seabed metals could eventually overtake drilling for oil.
“But the problem is going to be finding [the metals], and we don’t have a lot of data.”

Hartz said machine-learning data collection would be key to the success of seabed mining, and would ensure “we don’t need to make all the errors we made with hydrocarbons”.

Eleanor Martin, a partner at law firm Norton Rose Fulbright who advises banks on financing offshore projects, said global banks were “very eager” to invest in deep-sea mining projects as they project the cost of lithium and cobalt needed for electric car batteries will continue to spiral upwards.
“To build the number of [electric] cars we will need, we will need much more of these metals.”

“Banks are sitting on pots of green money,” she said in reference to money designated for projects aimed at tackling the climate crisis.
“But they need to know that mining projects are green and sustainable.”

Katherine Reece Thomas, an associate law professor and director of public international law at City, University of London, warned the industry that it needed to do more to win over public opinion before planning to start mining the oceans.

“There is an impossible conflict between those who say we can’t possibly do this, to others who say we need to take this stuff in order to tackle climate change on earth,” she said.

Jessica Battle, who runs the WWF’s No Deep Seabed Mining campaign, said: “Deep-seabed mining is highly risky and will cause irreversible harm to the ocean, to its life and its ability to help mitigate climate change.
Investing in such a highly unsustainable industry at a time when we need to reduce our footprint on the natural world is irresponsible.

“Any short-term incentives offered are far outweighed by the long-term benefits of a healthy ocean and so WWF and others are calling for a global moratorium on deep seabed mining.
Alternative solutions already exist – innovation, recycling and repair can satisfy industries’ need for raw materials without opening the seafloor to mining.”

Casson, from Greenpeace, said: “There is absolutely no need to mine the deep oceans and cause further harm to our planet.
We’ve been pleased to see the biggest players in the electric car and technology sectors, including Microsoft, Google, Volvo, BMW and Samsung, all call out the greenwash of the deep-sea mining companies and commit not to use deep-sea mined minerals in their products.

“This nascent industry should stop before it even begins.
We need to transition towards a more circular economy, in which we waste less and reuse more, instead of trying to destroy one of our planet’s last great wildernesses at the bottom of our oceans in the name of profit.”
 
Links :

Tuesday, May 24, 2022

International satellite to track impacts of small ocean currents


NASA and CNES (French Space Agency) are collaborating to make the first global survey of Earth's surface fresh water and study fine-scale ocean currents with a new mission called SWOT, or Surface Water and Ocean Topography. 
SWOT will collect data on the height of Earth’s salt and fresh water – including oceans, lakes, and rivers – enabling researchers to track the location of water over time, which will help measure the effects of climate change.
SWOT is expected to launch from Vandenberg Space Force Base in central California in November 2022.
SWOT is a collaboration between NASA and the French space agency Centre National d’Etudes Spatial (CNES), with contributions from the Canadian Space Agency (CSA) and United Kingdom Space Agency (UK Space Agency).

From NASA

The Surface Water and Ocean Topography mission will explore how the ocean absorbs atmospheric heat and carbon, moderating global temperatures and climate change.


Though climate change is driving sea level rise over time, researchers also believe that differences in surface height from place to place in the ocean can affect Earth’s climate.
These highs and lows are associated with currents and eddies, swirling rivers in the ocean, that influence how it absorbs atmospheric heat and carbon.

Enter the Surface Water and Ocean Topography (SWOT) mission, a joint effort of NASA and French space agency Centre National d’Études Spatiales (CNES), with contributions from the Canadian Space Agency (CSA) and the United Kingdom Space Agency.
Launching in November 2022, SWOT will collect data on ocean heights to study currents and eddies up to five times smaller than have been previously detectable.
It will also gather detailed information on freshwater lakes and rivers.

Observing the ocean at relatively small scales will help scientists assess its role in moderating climate change.
The planet’s largest storehouse of atmospheric heat and carbon, the ocean has absorbed more than 90% of the heat trapped by human-caused greenhouse gas emissions.

Much of the continued uptake of that heat – and the excess carbon dioxide and methane that produced it – is thought to occur around currents and eddies less than 60 miles (100 kilometers) across.
These flows are small relative to currents such as the Gulf Stream and the California Current, but researchers estimate that in the aggregate they transfer up to half the heat and carbon from surface waters to the ocean’s depths.

Better understanding this phenomenon may be key to determining whether there’s a ceiling to the ocean’s ability to absorb heat and carbon from human activities.

“What is the turning point at which the ocean starts releasing huge amounts of heat back into the atmosphere and accelerating global warming, rather than limiting it?” said Nadya Vinogradova Shiffer, SWOT’s program scientist at NASA Headquarters in Washington.
“SWOT can help answer one of the most critical climate questions of our time.”

Thinking Small


Existing satellites can’t detect smaller-scale currents and eddies, limiting research into how those features interact with each other and with larger-scale flows.

“That’s a place where we will learn a lot from having better observations of the small scales,” said J. Thomas Farrar, a SWOT oceanography science lead with Woods Hole Oceanographic Institution in Falmouth, Massachusetts.

In addition to helping researchers study the climate impacts of small currents, SWOT’s ability to “see” smaller areas of Earth’s surface will allow it to collect more precise data along coastlines, where rising ocean levels and the flow of currents can have immediate impacts on land ecosystems and human activity.

Higher seas, for example, can cause storm surges to penetrate farther inland.
Also, currents intensified by sea level rise may increase saltwater intrusion into deltas, estuaries, and wetlands, as well as groundwater supplies.

“In the open ocean, the whole phenomenon of drawing down heat and carbon will affect humanity for years to come,” said Lee-Lueng Fu, the SWOT project scientist at NASA’s Jet Propulsion Laboratory in Southern California.
“But in coastal waters, the effects of currents and sea height are felt over days and weeks. They affect human lives directly.”

So how will measuring ocean height lead to better knowledge of currents and eddies?

Researchers use height differences between points – known as the slope – to calculate the motion of currents.
The math accounts for the force of Earth’s gravity, which pulls water from high to low, and the planet’s rotation, which, in the Northern Hemisphere, bends the flow clockwise around high points and counterclockwise around low points.
The effect is the opposite in the south.

Systems of currents hundreds of miles wide flow around broad expanses of the ocean.
Along the way, smaller currents and eddies spin off and interact with one another.
When they come together, they drive water from the surface downward to colder depths, taking along heat and carbon from the atmosphere.
When those smaller currents and eddies flow apart, water from those colder depths rises to the surface, ready to absorb heat and carbon again.

This vertical movement of heat and carbon also occurs at eddies themselves.
In the Northern Hemisphere, clockwise eddies generate downward flows, while counterclockwise eddies create upward flows.
The reverse occurs in the Southern Hemisphere.

Filling in the Gaps

By measuring ocean heights down to 0.16-inch (0.4-centimeter) increments, as well as their slopes, SWOT’s two Ka-band Radar Interferometer (KaRIn) antennas will help researchers discern currents and eddies as small as 12 miles (20 kilometers) across.

SWOT will also employ a nadir altimeter, an older technology that can identify currents and eddies down to about 60 miles (100 kilometers) wide.
Where the nadir altimeter will point straight down and take data in one dimension, the KaRIn antennas will tilt.
This will enable the KaRIn antennas to scan the surface in two dimensions and, working in tandem, collect data with greater precision than the nadir altimeter alone.

“Currently, to get a two-dimensional view from a one-dimensional line, we take all of our one-dimensional lines and estimate what’s happening between them,” said Rosemary Morrow, a SWOT oceanography science lead at Laboratoire d’Études en Géophysique et Océanographie Spatiales in Toulouse, France.
“SWOT will directly observe what’s in the gaps.”

More About the Mission

SWOT is being jointly developed by NASA and CNES, with contributions from the CSA and the UK Space Agency.
JPL, which is managed for NASA by Caltech in Pasadena, California, leads the U.S.
component of the project.
For the flight system payload, NASA is providing the KaRIn instrument, a GPS science receiver, a laser retroreflector, a two-beam microwave radiometer, and NASA instrument operations.
CNES is providing the Doppler Orbitography and Radioposition Integrated by Satellite (DORIS) system, nadir altimeter, the KaRIn RF subsystem (with support from the UK Space Agency), the platform, and ground control segment.
CSA is providing the KaRIn high-power transmitter assembly.
NASA is providing the launch vehicle and associated launch services.

To learn more about the mission, visit:
https://swot.jpl.nasa.gov/
 
Links :

Monday, May 23, 2022

Safe Passage

NGA’s Safety of Navigation mission provides critical guidance to mariners and pilots

From NGA by Jim Hodges

While in the Navy, Ray Chartier, Jr. was the officer of the deck leading a submarine through undersea canyons using only instruments, training, and paper charts.
He was also the officer of the deck navigating an aircraft carrier to the Persian Gulf and back to the United States with faith in digital and paper charts to guide the ship through challenging areas of the world.
“I didn’t know where those charts came from,” Chartier said.
“I didn’t really care as long as they were accurate, I could do my mission, and I could get back home.”

Overseeing the National Geospatial-Intelligence Agency’s (NGA) Safety of Navigation (SoN) mission as its Senior GEOINT Authority, Chartier cares passionately now.
While most know NGA for imagery and mapping, few know SoN is also a core mission for the agency.
Mariners and pilots invest trust in NGA’s SoN products to help them make decisions—sometimes life-or-death ones—but few understand their origin.

The SoN mission is charged with ensuring the Department of Defense’s 13,000-plus aircraft and the U.S.
government’s 16,500-plus ships, submarines, and other vessels have the geo-referenced data and charts necessary to operate safely around the globe.
The mission has received more resources and attention in recent years following the grounding of the USS Guardian, a mine countermeasures vessel, in January 2013 on Tubbataha Reef off the Philippine coast.
The after-action report cited inaccurate digital navigation charts as contributing to command errors in the incident.

In 2017, Chartier led a team in developing a 10-year Safety of Navigation Strategy that offers insight into mission products and a way to streamline their creation.
“Not only is it the first strategy that’s ever been written for Safety of Nav, we also have performance metrics in our oversight with the Pentagon,” Chartier said of biannual combat support agency readiness reports.
“We’ve shared [the strategy] with our customers, and they’re holding us accountable and we’re holding ourselves accountable to produce what we need to meet the requirements.”

Those requirements include meeting the global needs of customers and embracing digital while continuing to ensure the accuracy of SoN data and charts.
The strategy pushes data-centricity to enhance timeliness and increase productivity.

 NGA’s Safety of Navigation Strategy, October 2017.
(Image credit: NGA)


What is SoN?

Perhaps the best way to understand SoN is through examples of its products in action.

When a devastating earthquake struck Haiti in 2010, military and civilian agencies galvanized relief efforts.
But before sending supplies and repair equipment, their delivery needed security assurance.

Capt. Brian Connon assessed Port au Prince and other Haitian harbors aboard the USNS Henson, an oceanographic survey ship, one of the service’s six charged with a daunting mission: measure the world’s oceans and harbors and verify existing charts, some of which date back to primitive sonar instruments and the practice of sounding bottoms with lead and line.
Only about 15 percent of the world’s oceans are mapped to modern standards, according to Connon.
“We were surveying anchorages in Haiti, and the hospital ship (USNS Comfort) was coming in,” said Connon, who now commands NGA’s 300-person Maritime Safety Office, one of three SoN components at NGA.
“The anchorage [Comfort] was supposed to go to actually had several containers on the bottom that had been knocked off a pier by the earthquake and sunk,” Connon continued.
The anchorage was cleared and once Comfort was able to arrive safely, its crew treated 1,000 Haitians and performed 850 operations.

The Maritime Safety Office used the Navy-collected data and generated safe, up-to-date charts within a week for Haiti relief operations.

Overhead, NGA’s Aeronautical Navigation Office assessed the capability of regional airstrips to receive relief supplies by helicopter and plane.
Data and charts that included airfield vectors, potential vertical obstructions such as cellphone towers, and instrument flight procedures were verified and certified.

“Some of the safety data had changed. There were areas that had flooded and others that had shifted because of the earthquake,” said Air Force Col. Timothy McDonald, who is well qualified to head NGA’s Aeronautical Navigation Office.
While in the Navy for 10 years, he flew S-3 Vikings off aircraft carriers.
After switching to the Air Force, he flew the U-2 high-altitude reconnaissance airplane.

Within days, relief supplies were arriving in Haiti by air.

While those missions were event-generated, the third leg of NGA’s SoN responsibility, the Office of Geomatics, performs one of the world’s most important tasks daily.
It provides data to ensure the accuracy of the World Geodetic System (WGS-84), the foundation of geospatial referencing.

“Anyone who uses GPS is depending upon our products,” said Richard Salmon, Senior GEOINT Authority for NGA’s Office of Geomatics, which combines aspects of photogrammetry, elevation, geometry, geophysics, GPS, and mathematics into an engineering discipline.
“When you’re driving around in your car … when you’re [flying] in a commercial aircraft … when you’re on a smartphone, our data is supporting that activity.”

How SoN Works

To perform NGA’s SoN mission, the Maritime and Aeronautical offices cull data from monthly reports delivered by 100-plus nation-partners as well as by domestic agencies such as the Federal Aviation Administration (FAA) and the National Oceanic and Atmospheric Administration.
The Office of Geomatics contributes specialized surveys and other technical products, such as reports based on its Earth Gravitational Model—which acknowledges that gravity varies around the globe and, thus, requires data adjustment—and World Magnetic Model, which chronicles migration of the Magnetic North Pole toward Siberia at about 65 kilometers a year.

Industry partners contract with NGA to generate products issued under SoN auspices and with SoN review and certification.
Formats generally adhere to international and community-driven standards.

SoN staff analyzes incoming data and extracts that which it considers new and relevant to the mission.
It issues reports—most of them every 28 days, others ad hoc—of changes and additions to existing data, publications, and charts.

Accuracy is paramount.
Without it, the trust that Chartier invested while at sea and that McDonald had when piloting planes could not exist.
And that trust has many levels, beginning with determining the quality and validity of the sources that provide data.

All data is geo-referenced, catalogued, and preserved—ready for retrieval in case of incident investigations.

Events such as the Maersk Alabama piracy in 2009 off the coast of Somalia generate additional data.
Though the SoN customer base is the military and federal government, the mission offers commercial ships as many as 800 event messages a month, including incidents such as a craft lost at sea, a man overboard, iceberg travel, and pirate activity.
In October, the message system led the USS Ashland to rescue a disabled sailboat in waters off Japan after the hobby mariners were lost at sea for months.

NGA’s SoN leaders meet quarterly with combatant commands and other stakeholders to determine upcoming needs, and there are standard reviews of frequently visited ports and airfields.
Ad hoc requests are handled through special priorities.
For example, when the USS Oscar Austin, a guided missile destroyer, was dispatched to Klaipeda, Lithuania, in July 2014, Cmdr.
Brian Diebold, the ship’s skipper, declined to enter the harbor and tie up at a new pier until he had official charts from NGA to guide him.

Those charts, normally generated in three to four months, were provided in two days using high-resolution imagery and existing information to verify Lithuanian government data.


CO-LABS Colorado in 2015 recognized the Cooperative Institute for Research in Environmental Sciences and the geomagnetism group of NOAA’s National Centers for Environmental Information in Boulder for a newly updated representation of Earth’s magnetic field—the World Magnetic Model—used daily by millions of people for military, mobile phone, and other navigation needs.
(Video credit: CO-LABS Colorado)

What’s Ahead

NGA’s SoN offices acknowledge some of their tools are antiquated.
Part of the timing of the 10-year SoN strategy is federal budget-driven.
“The strategy should influence the next three [Program Objective Memorandum] cycles for funding,” Chartier said of an early step in the budget process.

The strategy emphasizes new, modern means of collecting and analyzing data and disseminating results.
Paper, for example, is downgraded in priority.
Automation and digitization are the tools of tomorrow.

“As the world changes, there are ways in which we can get information quicker than in a paper chart or an old standard publication,” Chartier said.
“We also can get that information digitally to your system so you can make better informed decisions, faster.”

For instance, SoN would like to see its data overlaid with other operationally relevant data on the Electronic Chart Display and Information System on a ship’s bridge.
Technology at both ends of the delivery process is stalling the effort for now.

The Aeronautical Navigation Office needs to become more digitally enhanced to meet paperless cockpit advances such as those of the Air Force Air Mobility Command, and the performance-based navigation aims of the FAA concept of operations.

To meet its goals, NGA’s SoN offices need modernized IT infrastructure to collect, organize, analyze, and deliver data digitally.
Likewise, customers need to update their systems to receive data in new and faster ways.
And a culture change needs to happen.

“The old way is not going to get us to the new way,” Chartier said.
“We have to update infrastructure and tradecraft.”

The Maritime Safety Office is already working toward the new way, hiring graduates of maritime academies that bring blue-water experience and the latest Geospatial Information System knowledge to the job.

“It’s going to take a large muscle movement from industry, other agencies, other governments, and us to be able to meet (paperless goals),” McDonald said.
“It’s really taking up a large part of our efforts, staying ahead and making sure we get there to meet the warfighter needs for less paper.”

Salmon said the Office of Geomatics is developing a new system for collecting magnetic data in anticipation of the end of life for Europe’s Swarm satellites in the early 2020s.
Swarm, a European Space Agency constellation, measures the Earth’s geomagnetic field.

The SoN mission pushes new goals, but with caution.

“We can’t trade quality for automation and speed for higher production capacity,” Chartier said.
“At the end of the day, it’s got to be safe for navigation and trusted.”

Sunday, May 22, 2022

Follow the 'Yellow Brick Road' to geologic features of Liliʻuokalani Ridge Seamounts | Nautilus Live


What may look like a "yellow brick road" to the mythical city of Atlantis is really an example of ancient active volcanic geology!
Our Corps of Exploration have witnessed incredibly unique and fascinating geological formations while diving on the Liliʻuokalani Ridge within Papahānaumokuakea Marine National Monument.
At the summit of Nootka Seamount, the team spotted a "dried lake bed" formation, now IDed as a fractured flow of hyaloclastite rock (a volcanic rock formed in high-energy eruptions where many rock fragments settle to the seabed).
The unique 90-degree fractures are likely related to heating and cooling stress from multiple eruptions at this baked margin.
Throughout the seamount chain, the team also sampled basalts coated with ferromanganese (iron-manganese) crusts from across different depths and oxygen saturations as well as an interesting-looking pumice rock that almost resembled a sponge.
Our exploration of this never-before-surveyed area is helping researchers take a deeper look at life on and within the rocky slopes of these deep, ancient seamounts.
Scientists are studying the microbial communities residing within the ferromanganese crusts found over rock surfaces and how the characteristics of the crusts vary from region to region in ocean basins as well the microorganisms that live on and within them.
These studies will help provide baseline information on the living communities of seamounts which can inform management and conservation measures.
 
 
“I feel like I’m looking at the road to Atlantis,” a crew member aboard the Exploration Vessel Nautilus murmurs partway into a clip of the team’s undersea exploration. 
“Are you kidding? This is crazy.”

Perhaps the scientist, one of the Corps of Exploration team studying the Liliʻuokalani Ridge in the Pacific Ocean, could be so metaphorical because he’d already partially identified what the structure really was.
 
Localization with the GeoGarage platform (UKHO nautical raster chart)
 
After describing the underwater feature as a “dried lake bed,” a post on the Nautilus’ site gives more context.
What may look like a “yellow brick road” to the mythical city of Atlantis is really an example of ancient active volcanic geology.

The crew posted a video to the official Nautilus YouTube channel earlier this week, pictured below. There are also clips of the crew collecting rock samples and commenting on nearby sea life.

Last month, CNET reports the team found some beautiful, otherworldlyspecies during their submarine excursions.
The “unidentified gelatinous creature” gave the team a thrill, with one team member exclaiming “Very charismatic. Yay!” during a clip of the voyage.

It’s pretty heartwarming to see marine scientists get excited over new discoveries, but it’s also sad to know there are so many things we don’t know about the ocean given how fast we’re destroying it.
Coral reefs are bleaching again, animals are living in plastic wastelands and scientists say a potential mass extinction is on the way.

The Nautilus team can’t be everywhere all at once, nor can other oceanic researchers.
What kinds of sea life will they leave uncatalogued because it died before they got a chance to study it?