Saturday, March 6, 2010

Sat-nav systems under growing threats


Technology that depends on satellite-navigation signals (GPS/Glonass/Compass) is increasingly threatened by :

  • attack from widely available equipment : while "jamming" sat-nav equipment with noise signals is on the rise, more sophisticated methods allow hackers even to program what receivers display (see BBC News / Financial Times / NZ Master Mariners articles)
  • solar activity rising : GPS systems are particularly sensitive to major electric activity in the ionosphere, which interferes with satellite signals. The Northern Lights (or Aurora Borealis) could be messing with GPS satellite navigation systems when the satellite signal passes through the phenomena (see Telegraph article). The Sun is on its way to another solar maximum, which could generate large and unpredictable sat-nav errors (see BBC News other article)
Some more reasons to not rely too heavily on an GPS chart plotter which can be inaccurate sometimes (see the recent story occured in Australia : "Fatal yacht crash inquiry blames GPS")

Friday, March 5, 2010

Safety warning for ECDIS with ENC settings

This is an issue that could affect vessels cruising over the world.

Serious navigational dangers could arise from electronic bridge systems including the Electronic Navigation Charts (ENC) and Electronic Chart and Display Information Systems (ECDIS) without adoption of a particular use.

There are particular issues involved with some dangerous shoals encoded in a certain way that may not display on the navigational aids unless the option to display 'ALL SOUNDINGS' has been selected.
There could also be related problems with safety contour and safety depth alarms not working without selection of this setting.
The dangers arising from shoals are particularly pertinent to superyachts, which often venture into shallower water than the commercial fleet.

The UK Hydrographic Organization has issued a Radio Navigation Warning (RNW) repeated in several NAVAREAS ("by no means all") as follows regarding the problem :

NAVAREA I : message#037/10 (151800 UTC FEB 10)

Mariners are advised that ECDIS may not display some isolated shoal depths when operating in "base or standard display" mode.
Route planning and monitoring alarms for these shoal depths may not always be activated. To ensure safe navigation and to confirm that a planned route is clear of such dangers, mariners should visually inspect the planned route and any deviations from it using ECDIS configured to display "all data".
The automated voyage planning check function should not be solely relied upon.
The International Hydrographic Organization (IHO) is leading technical action to resolve this matter. Further information will be made available through Notices to Mariners.

This example of display inconsistency shows that interaction between chart and software inside the ECDIS could lead to unpredictable display on panning and zooming. And as a final result, this difficulty can create for the mariner confusion, frustation and lack of confidence in Electronic Charting.

Link :
  • NOAA warns mariners of serious display issue with ECDIS

Thursday, March 4, 2010

PlanetSolar World Tour 2011

The world's largest solar boat has been unveiled this week at the Knierim Yacht Club in Kiel in Germany. PlanetSolar, a 31m long, 15m wide and 60 ton catamaran has been designed to reach a top speed of around 15 knots, and can hold up to 50 passengers.
Power entirely by up to 500 square metres of photovoltaic solar panels composed by 38,000 photovoltaic cells which have an efficiency of at least 22%.

The boat has been designed for a global circumnavigation planned for 2011.
This extraordinary technological but also human challenge is driven by Swiss skipper Raphaël Domjan and French skipper Gérard d'Aboville, the first person to successfully row across the Atlantic Ocean in 1980.

The project will help to motivate engineers and scientists to develop innovative technologies, inspire people around the world, and show that the impossible can become possible.

Links :

How to save your navigation plan (gpx export)

Following the post 'How to prepare your navigation plan', you want now to export the created waypoints and routes on some usb memory stick.

To export the file, just click on the 'Save the gpx file' button at the bottom right corner of the map :
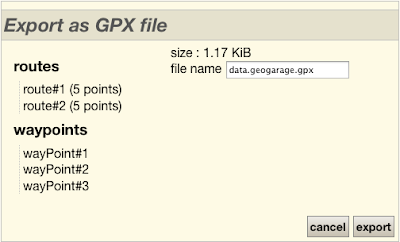
Then click on the 'export' in the window which appears on the screen :

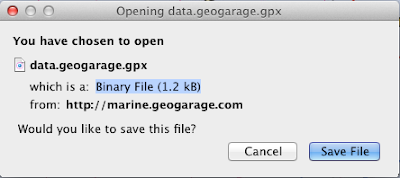
and confirm your save :


Then go the the Downloads folder of your PC or Mac to locate the file :

data.geogarage.gpx

and if necessary, save it in a usb memory stick

Notes :
  • this 'data.geogarage.gpx' file is in gpx format and usable by most of the navigation software of the market
  • this file as an xml file is editable by any text editor : example

Wednesday, March 3, 2010

Sail and surf


East Coast of Australia, July 2009 :


Saltonay, a 43-foot catamaran from Sydney skippered by Ian Sloan went to Goldcoast marinas, large urban area south of Brisbane.
-> see place on Marine GeoGarage

Following a gale, the waves in the harbor entrance (called Southport Seaway) were about 2 meters high!
After a night of waiting, the skipper and 2 crew decided to go ...

How to prepare your navigation plan

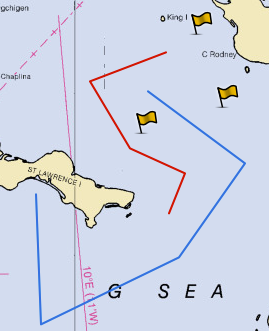
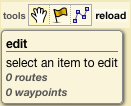
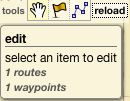
In the GeoGarage tools (at the top left corner of the map), select :
  • the flag logo in order to create waypoints on the map
  • the broken line in order to create routes

Then click on the map :

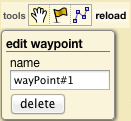
  • to create some waypoints : the Edit window proposes you to enter the name of the waypoint

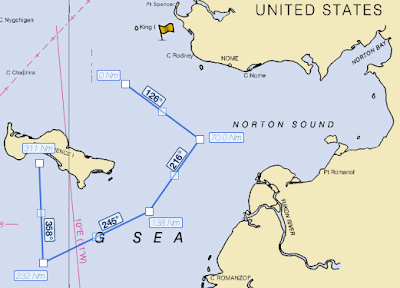
  • to create some route :

Notes :
  • don't forget to click twice to end the creation of the route
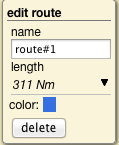
  • the Edit window proposes you to enter the name of the route (by default 'route#1' : you can rename it selecting 'route#1' and entering a new name with the keyboard)

  • you can also change the color of the line clicking on the blue square
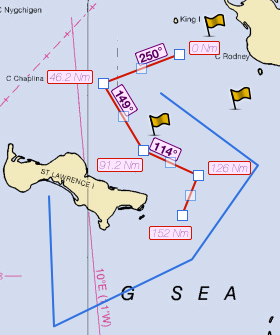
  • the total length of the route is displayed (ex.: 311 Nm) : the route also shows the cumulative distance from the start for each waypoint and the bearing between each waypoint
  • and you can of course choose to delete the whole route
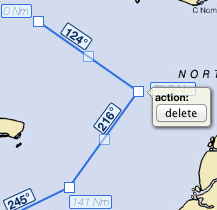
  • you can also choose to edit some of the waypoints belonging to the route, to delete it or to move it with the mouse (releasing the button of the mouse when the new position of the waypoint is correct)

Then when your navigation plan is ready, click on the 'reload button' to see all your data :

In our example, we have now 1 route and 1 waypoint.
If you have several waypoints or several routes, the Edition window displays all the list :

To select a specific waypoint or route :
  • click on the name in the 'Edition' window
  • or click on the object directly on the map

Tuesday, March 2, 2010

Xynthia, back to the future


As forecasting models improve, forecasters are able to issue more accurate and timely storm warnings and advisories.

Ex.: Weather forecast from wunderground.com,
February 26, 2010 (2 days before the passage)

"A large 1000 mb low pressure system named "Xynthia" is over the eastern Atlantic, and is expected to rapidly intensify Saturday morning into a meteorological 'bomb' that will bring high winds and flooding rains to Portugal, northern Spain, and western France. The models are coming into better agreement now, and have shifted their position for the storm's maximum intensity eastwards. France is now in the bullseye, and the storm is predicted to be at maximum intensity on Sunday morning when it will be positioned over northwestern France. The storm's powerful cold front will sweep ashore south of the low, bringing sustained winds of 50 - 60 mph (80 - 95 km/hr) to the coast of France's Bay of Biscay, with gusts over hurricane force (120 km/hr). The central pressure at that time will range from 966 mb to 972 mb, according to two of our top computer models, the ECMWF and GFS."

How to use Marine GeoGarage : quick overview

Online nautical maps of the world, regularly updated

  • Marine GeoGarage is a website that will allow you to look at the NOAA charts. It will open in a new window that you can then maximize to get the best view. Also, if you sign up with the site (free), then you will be able to save waypoints and routes.
  • When you open the site, if you first see a satellite view, then zoom into your favorite area by clicking on the map several times and then click on the “Map Content” box in the upper right hand corner of the chart to drop down the menu. Under the “NOAA” box, there is a slider. By moving that slider to the left, the background map will start to show through. The background map you see depends of the little drop down box under “background” at the top of the “Map Content” box. “Hybrid” is a good choice. Click on “Map Content” again to close the box. It is interesting to compare the shoal areas on the chart with the view in the satellite view.
  • In the lower left-hand corner of the chart, you will see a lat/lon box giving the lat/lon of the mouse cursor.
  • In the upper-left hand corner of the chart you will find the typical navigational tools of a Google Map. You can zoom in and out and move in four directions. You can also zoom with the thumbwheel of your mouse.
  • To the right of the navigational tools, there is a tool box. The “hand” lets you move the map around, the “flag” lets you set a waypoint and the “lines and boxes” lets you make a route. Just click on the one you want.
  • In the lower right-hand corner, there is a small map. If you grap the shaded box in the middle by clicking and holding your cursor, the can move the box all around the chart quickly.
  • Once you play around with the site, it becomes very easy to use.

Monday, March 1, 2010

Press release : Marine GeoGarage, nautical charts web portal

Updated : May 12, 2010

Marine GeoGarage
ushers in a new era of nautical mapping services with the launch of its marine charts portal, built on Cloud Computing technology.

http://marine.geogarage.com/routes

The web site is the world's first online nautical map service allowing to display maps coming from different international Hydrographic Services.

Today the catalogue of charts regroups all the public raster charts from NOAA (US), DHN (Brazil), Linz (New Zealand).
Marine GeoGarage's web interface also gives site visitors viewing access to all private charts from UKHO (UK), CHS (Canada), SHN (Argentina) accessible via some monthly 'Chart Premium' subscription (9.9 €/month)
Today more than 3000 electronic charts are available in the GeoGarage servers; additional providers' layers are in preparation.

The big advantage is that all the layers are kept updated regularly so the user is sure to visualize recent documents.

But the web site is not only a seamless chart viewer overlaying charts at different scales on aerial and satellite imagery from Google Maps.
It also allows the user to plot waypoints and to prepare some navigation routes which can be saved in his account after free registering and uploaded to GPS (in gpx format or directly to Garmin GPS via its Communicator web plugin)

Xynthia storm violently hits French Atlantic coast

Sailing boats out of the La Rochelle harbor

Saturday, Xynthia touched Portugal and Spain before crossing the French coast.

In Britanny and much of the Atlantic coast, these winds, coupled with very strong tidal factors, have led to a rise in sea level over a meter.

Links :

Xynthia formed "when the cold winds of altitude, the famous jet streams very powerful, came into contact with a warm air mass situated in low layer" in the middle of the Atlantic at about 30 ° north latitude. The large temperature difference between the two air masses generated the "deepening" of a huge whirlpool, or depression, which was then evacuated to the northeast.
"These winter storms are relatively common but most of the time they are born farther north off Iceland and the British Isles and do not reach such intensity," says Patrick Galois, Meteo France Engineer.

The violence of Xynthia comes from the fact that it has been formed much farther south than usual and has mobilized a large amount of warm air.

Sunday, February 28, 2010

Survey routes design made of parallel transects


This tool allows to create parallel profiles for a specific survey area just introducing 2 geographical points
on the map (generally perpendicular to the general trend of the shore) and an uniformly-spacing distance between a selected number of profiles.

Application : optimization of bathymetric profiles in depth sounding surveys
Possibility to save the result in Olex format, kml for Google Earth display or CVS for spreadsheet and to play with a simulation tool to help to manage the reduction of costs involved in hydrography missions (calculating ETA on waypoints introducing boat speed for each leg)