From TheSandPaper
On introducing a new interactive flood mapping website,
www.NJFloodMapper.org, Lisa Auermuller, watershed coordinator for the Jacques Cousteau National Estuarine Research Reserve, acknowledged that playing with the controls and seeing the implications of an increasing sea level rise on their communities might not be something those affected by Superstorm Sandy may want to do anytime soon.
But the website and sea level rise are important for elected and appointed officials to contemplate while planning for the future.
“We have been giving communities the following figure: Plan for 1 foot of rise by 2050 and 3 foot rise by 2100. It’s not like storm surge where it comes and goes; this is what the water level will be permanently at mean high tide,” she said.
Although some still balk at the idea of climate change and sea level rise, Auermuller said climate scientists no longer quibble on that point.
“There’s no question that sea level rise is a reality along the Jersey coast,” she said.
“This is scientific fact. It’s not political, but it’s become political,” she noted.
The website has been developed over years starting with a grant JCNERR received from the National Oceanic and Atmospheric Administration in 2009 and was specifically built to be used by local and state planners when making land decisions.
“We are a science-based organization, so we are giving out the best available science so people can make better decisions – that’s the purpose of this.”
The map was developed through a partnership with the JCNERR and Rutgers Center for Remote Sensing and Spatial Analysis.
It’s Goggle Maps-based but informed by LiDAR technology, the most sensitive typographic mapping there is.
“It was built mainly as a tool for people to visualize what sea level rise impacts will be,” said Auermuller during a March 25 interview in her office on Great Bay Boulevard in Tuckerton, “and we are already seeing impacts. We’ve heard from the local communities for years that they are already seeing increased flooding rates even on full moons – not the super-high tides. We’ve heard that they are getting water up through the storm drains. Their roads are flooding more than they remember seeing. People are already seeing evidence of this. They don’t have to call it climate change or sea level rise, but people are genuinely aware that things are changing.”
Not only is the sea level rising, the land is sinking, said Auermuller.
“In New Jersey we have a double whammy; we have subsidence at the same time. Ground water withdrawal is one reason for subsidence, and the soils we build on get compacted over time, so we are exacerbating the problem over a geological time frame. Also, as water temperature is heated, it expands and makes the level higher. And then there’s the whole melting ice sheet thing that is not at all local but does play into the connectedness of the ocean.
“Things are changing; this tool helps them visualize that change.”
The NJ Flood Mapper shows the current mean high water mark (an average of all the high tides in a year) and then shows what happens as sea level rises.
“This is not storm surge,” noted Auremuller, although there is a tab on the website that shows the effects of Sandy. “It shows what will happen – up to a 6-foot rise in the future.
“I’m saying ‘will’ because many of my colleagues and many climate scientists no longer argue about whether this is happening.
“Is the sea rising? Yes, it is a physical reality.”
A graph of a tide gauge in Atlantic City dating from 1900 up to 2013 shows a 1.5-inch-per-year increase, or 1.3 feet in 100 years.
“And our climate scientists are telling us that not only is this line very linear (always going up), it’s trending towards an exponential increase. It’s not going to increase at the same rate, but it will increase exponentially.”
Another feature on the website projects past storms into the future when sea levels are higher. “For example, if you took the December ’92 storm and projected that into the future, it would show you the height of what that same storm will be in the future because sea levels will be higher.”
Auermuller said some Rutgers and research reserve staff serve on the Federal Emergency Management Agency’s Coastal Outreach Advisory team, but did not provide input to making the FEMA maps.
Their job is like public relations, getting the message of sea level rise to the public.
“If the message is too technical, you have to make that more clear. The information on this website is a way to get that information out, but we did not have a hand in developing the FEMA map information.
“The FEMA maps are not at all future-looking; they are based on past storm events, and so if people want to rebuild with the future in mind, using the FEMA maps would be the bare minimum, honestly. We think our site provides a glimpse into the future.”
Auermuller said the website is not a “crystal ball, it’s a model, but it’s based on the best available science. For planning things like community infrastructure, those facilities built for the long term – these plans can benefit from the website.”
When launching the map of the whole state, note the six tabs at the top left.
One shows how much of the coastal state is currently inudated during mean high water (average of the highest high tides over a year) and then what happens as you add 1 foot of rise here.
Roads are flooded, and if you increase the mean high tide level up to 3 feet, as projected in 2050, many communities are underwater.
“You can play with this up to 6 feet. On Long Beach Island, only the beachfront dunes are still there,” she noted. Six feet of storm surge is not the same thing. This is a constant sea level rise, and storm surge has energy behind it.
“The confidence tab lets people understand that this is based on a model. In a model you are not showing perfect science. With the sea level rise we want to be upfront to say we are pretty confident, 80 percent confident, that sea level rise will look like this; other areas have less confidence.
“The vulnerability tab has two features: the social vulnerability and the economic vulnerability. The economic vulnerability is not completed – that’s a grant we are currently working on. The social vulnerability is where you have populations that are vulnerable due to age or economic ability. People that might not be able to get out of the way without help from the community. Nursing homes are socially vulnerable, they would have to be evacuated, and people without vehicles would require public assistance like buses, and we’ve mapped those sections.”
The map can be useful during a storm, but it’s really for future planning. “If you know your most socially vulnerable populations are also in an area of the most vulnerable areas for rising sea level, then you can make decisions as a community and factor that into your master plan.
“The facilities tab is extremely helpful for community planning, and this is where we map evacuation routes, schools, police stations, hospitals and fire stations. In Tuckerton, for example, the police station is in the flood plain and is underwater at 6 feet, and the road is close to being underwater at 2 feet and completely underwater at 3 feet. On Long Beach Island, their main evacuation route is impacted at 2 feet and definitely underwater at t3 feet. One foot is likely by 2050, 3 feet by 2100 – but those numbers could be conservative.”
The flooding tab has information that has evolved since Sandy.
The current FEMA maps that flood insurance is based on are there, as well as the Advisory Base Flood Elevation maps
“The A- and V-zones are mapped, and we can also add the extent of Sandy inundation to show how far inland the water went. When people are thinking about planning, we know that Sandy is going to be a factor.
“Without putting a value judgment on this, if you look at the A- and V-zone designations – and most of Mystic and Tuckerton Beach are in the V-zone now – and then overlay Sandy, it’s really apparent that the maps may not be that far off.
“During storm surge, I heard people were seeing 3-foot waves in the back bays. If communities are looking toward the planning horizon, they can think about Sandy and visually see it.
“Our last tab is this marsh tab. And in the face of sea level rise, marshes have a few options: They are either going to be able to keep pace with the rising water and stay above the water level, or they are not and they will drown. We don’t have any sediment coming to our marshes anymore, so the idea of them being able to keep pace with sea level rise is somewhat unlikely.
“As the water comes up and our marshes are sinking because of subsidence, they are fighting a losing battle. This tab shows where there is current tidal marsh and, as you add sea level to it, where marshes have the ability to retreat. Where they are not impeded by a road or development, we can show where a community might look to buy open space to allow for marshes to migrate.”
There’s a lot more information on the site and links to other sites for the curious mind to explore.
There is a link on the website to case studies from places such as New England and Delaware on how communities have been working with their residents to think about climate change and sea level rise and plan for it: pass ordinances or account for these conditions when building a new wastewater treatment plant or other infrastructure, said Auermuller.
“I provide examples of what’s being done in other places so people don’t feel hopeless.”
Links :


 637 charts for UK
 24 charts for Argentina :
 27 charts for Belgium & Nederlands :
 14 charts for Croatia :
 6 charts for Oman :
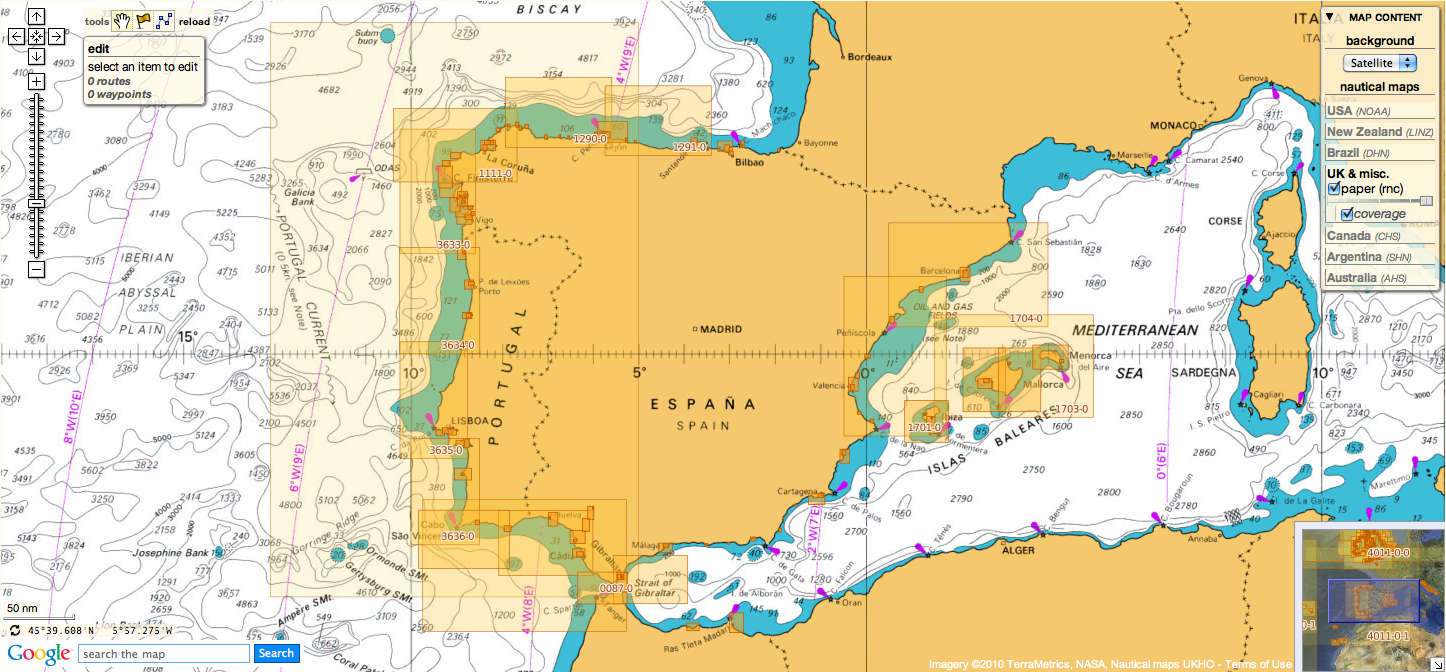


