Saturday, October 23, 2021

Image of the week : ice mesmerizing in Russia

Nothern part of Severny Island, Russia
Sentinel-2 satellite image acquired in August 2020 
 
Localization with the GeoGarage platform (NGA nautical raster chart)
 

Friday, October 22, 2021

Ancient with a dash of modern: we joined the Royal Navy to find there's little new in naval navigation


From The Register by Gareth Corfield
 
Following the Fleet Navigating Officers' course
 
 
The art of not driving your warship into the coast or the seabed is a curious blend of the ancient and the very modern, as The Regdiscovered while observing the Royal Navy's Fleet Navigating Officers' (FNO) course.
 
Safe navigation at sea is vital for all mariners and the Admiralty manual of navigation captures centuries of @RoyalNavy experience in this field.
 
Held aboard HMS Severn, "sea week" of the FNO course involves taking students fresh from classroom training and putting them on the bridge of a real live ship – and then watching them navigate through progressively harder real-life challenges.

"It's about finding where the students' capacity limit is," FNO instructor Lieutenant Commander Mark Raeburn told The Register.
Safety comes first: the Navy isn't interested in having navigators who can't keep up with the pressures and volume of information during pilotage close to shore – or near enemy minefields.

So the student navigator hopes, anyway.


RN Navigation Training Unit

Driving (all of the officers we spoke to aboard Severn referred to it as driving and not sailing or steaming) a warship, as we reported during the course itself, is a highly skilled art that depends on precisely planning what you want the ship to do – and then having a clear enough mind to modify that plan on the fly depending on what the outside world is doing.


HMS Severn's pelorus, mounted centrally on the bridge

Second Officer Will Salloway, 26, a Royal Fleet Auxiliary* student on the FNO course, told The Register: "There's a lot of planning to do in a short timeframe.
That can be quite tough, coming out with a safe plan which has everything you need in it while being able to manage the pressures… you spend three hours on bridge managing the runs, on top of that and planning you've gotta eat and sleep."

"It's probably 20 times as much planning to execution."

Bobbin' on the oggin'

The essence of the FNO course is safely taking the ship to and from an anchorage, or navigating through tricky inshore waters, while maintaining appropriate safety margins.
For a surface ship this means staying away from a not-quite-imaginary line of critical importance: the Limiting Danger Line, or LDL.
The LDL is a depth that must never be passed in case the ship runs aground.
It's calculated by adding the ship's keel depth plus the squat for her planned speed** plus a margin on top, and then drawing "do not cross" lines on the chart.

Each FNO student plans and carries out six live navigation runs in control of the Severn: three "development" passages with FNO instructors coaching them throughout and giving them feedback, and three exam runs where assessors specially embarked for the course quietly watch the students going through their paces and decide if they pass or fail.
The ship herself travelled along Britain's south coast, dipped in and out of Plymouth and then dropped south to the Channel Islands' large tides and tidal stream variations before returning to her home base at Portsmouth.


The view down HMS Severn's pelorus-mounted gyrocompass

The course concentrates on navigating a ship without GPS.
Taking away the external you-are-here service leaves the navigator aboard Severn with three manually sighted gyro-compasses*** and the heart of naval navigation, the Warship Electronic Chart Display and Information System (WECDIS, pronounced by all as "weck-diss").

Naval pilotage means planning a precise track from a position out at sea to an anchorage – or from an anchorage back out to sea, following a marked channel or passing through an area with a strong tidal stream and lots of other maritime traffic.
The navigator then keeps the ship to within yards of her planned track and turning points along the track.
On top of that, the navigator also plans wheel-over points; the spot where the wheel must be turned to a set angle so the ship precisely meets the next planned leg.
In this regard, naval pilotage planning is an exacting science.


Tidal stream predictions off St Peter Port, Guernsey

Contact with the real world's weather and tides introduces an element of "fun" as one instructor whimsically observed.

For the student navigator, fixing your position means putting two of your fellow students on the external gyro-compasses to call out bearings, a third on the surface radar and a fourth on the WECDIS console, mounted in Severn behind the central gyro-compass on the ship's pelorus.
That team then works the maths and the technology together, all in perfect harmony with the navigator's prepared passage plan.


HMS Severn's bridge radar plot.
One of the FNO students keeps an eye on nearby ships and the coast, seen as the big yellow line


Taking bearings off shore landmarks or nautical navigation marks (lighthouses and prominent buildings by day, flashing lights by night) with a gyro-compass hasn't changed much since compasses were introduced to seafaring: you look down the compass towards the mark, read off the bearing and record it.
Severn's concession to modernity is that her gyro-compasses have a modest internal telescope and illumination for night readings.


A navigation buoy marking the channel into Plymouth harbour

Yet in modern naval navigation, that ancient art of eyeballing the bearings is married to a modern computer system that constantly integrates and updates bearings to produce a live plot of where the ship ought to be.


A WECDIS screen aboard HMS Severn.

It's a curious blend of an old art with up-to-date technology that complements both: for eyes used to instantly seeing the answers to life, the universe and everything presented on a computer, the digital displays telling the bridge crew where the ship is located are curiously reassuring.
Reading bearings to navigation marks would be equally familiar to sailors from the mid-19th century.

During the course safety comes first: the captain and instructors can see a GPS-enabled WECDIS display showing precisely where the ship is, and can intervene if something unsafe is about to happen.

We've got windows – glass ones, not the operating system

Although the FNO course is usually loaded with eight students, during the week that El Reg joined the Severn we had just four: two from the surface fleet; one from submarines; and one from the Royal Fleet Auxiliary (RFA).
Severn's captain, Commander Philip Harper, mused that each student's professional naval experience brought something different to their navigational technique.

For example, submarine navigation normally takes place underwater, so submariner students on the FNO course tend to start off by gazing at the screens on the bridge instead of looking outside.


Portland speed/distance/time analogue calculator, used on the FNO course

Lieutenant Jack Crallan, a 32-year-old submariner who was a physics teacher before joining the Navy, agreed: "Biggest difference for me is being able to see things! I'm usually looking at my notebook and listening to the numbers and not looking out of the window.
But on a submarine the only information you have is bearings."

Although the process of pilotage (navigation close to shore) is inherently mathematical, the FNO students insisted you didn't need to be a numerical genius to keep the ship safe ("I got a U in A-level maths," joked one).


Royal Fleet Auxiliary navigator's notebook and quick-reference table

Lieutenant Matt Cavill, 29, who has a degree in molecular cell biology, said of the above quick-reference tables: "When someone works out a distance off track or a distance to run, that's all done off a single bearing in their notebook most likely.
When someone works out a time to regain, or a distance to regain, then they are using mental maths but it's fairly basic – some people can do speed/distance/time [on the fly], it comes relatively easily to me.
I do have a note of easy numbers, though!"

Fellow student Lt Crallan added: "There are a lot of maths tricks as well.
We tend to do something of 12 or 15 or 30 very easily; that's the sine rule.
You can do trigonometry in your head if you pick the right numbers."

Staying in clear water

On the FNO course it's not enough to leave the maths to WECDIS.
From watching the navigation runs, it was clear that whoever was navigating was expected to use the electronic plot to help them form their own mental picture of where the ship was at any given moment, not as a crutch for leaning on.

To the non-nautical observer, RN pilotage is a bewildering verbal stream of bearings, marks, yards, chains, timings, and jargon.
The WECDIS operator is constantly updating bearings on his console behind the navigator, who occasionally darts from the pelorus to a bridge window or shouts "heads" so everyone in front of him ducks while he's taking a sighting.
Outside the bridge his fellow students use loudspeakers to call bearings in – whether once, on request when two landmarks pass in transit (in line with each other) or (most often) in a regular stream.


HMS Severn's captain, Cdr Philip Harper, observes a nearby ship.
Note the "cone of shame" over the ship's master GPS-enabled WECDIS plot so the student navigator (standing behind Cdr Harper) can't cheat


Beside the navigator, in a large and comfortable chair, sits the captain – or his right-hand man, the ship's executive officer, with whom he alternates during FNO runs and debriefs.
The navigator's job is to keep the captain updated on what he's doing; RN captains are often not qualified navigators themselves.

Salloway explained: "If you're the nav of a ship, that's what it's like for real.
If your CO [commanding officer] is busy… all while you're driving a possibly inexperienced team, going into a port you're not familiar with where there could be certain risks or threats.
Being able to be in the position we're in now, a safe training environment… It's really helpful for the future."

As well as the "simple" navigation challenge, the course puts its students through a serious test of nerve in the Solent.
On a calm and sunny Friday this stretch of sea, captured between the Isle of Wight, Portsmouth and Southampton, plays host to scores of small sailing boats and powered vessels.


An RAF-liveried motor launch passes HMS Severn on the Solent in September 2021

Keeping to the planned navigation track in the Solent becomes an exercise in instinctively knowing the nautical Rules of the Road, keeping radio calls to, from and between other traffic in mind – and knowing how to navigate back on track after cutting a corner or extending a leg to safely avoid another vessel.
The students made it look effortless even as your correspondent tried and failed to follow the basic navigation plot by gazing at the WECDIS screen.

"Why am I doing this, or why would I do this in future?" mused Lt Dom Jacobs, 24, one of the FNO students.
"If you're running along an enemy coastline, blacked out, running along so you can get the main weapon into arcs so you can shoot [along] that river or feature… it gives us confidence.
It's all good things to help build capacity for when it all goes wrong – or we're at war.
Because that's what we're here for."


It's not all work and no joy aboard the Severn.
Here is the location on the Isle of Wight where Britain's Black Arrow rocket testing programme was based


It might seem from an outside glance that naval navigation would depend on technology but, putting aside the speed and spare mental capacity that WECDIS gives the navigator, it's really a very low-tech endeavour.

"You should see the specialist navigator course," remarked one of the FNO instructors during a night-time run.
"They use sextants."

Perhaps if there's a next time...

The Register thanks the Royal Navy, in particular: Commander Philip Harper, CO of HMS Severn; the warm and welcoming ship's company of HMS Severn; and the ever-patient students and directing staff of the Fleet Navigating Officer's Course.

Bootnotes

*The Royal Fleet Auxiliary is the nominally civilian arm of Britain's Naval Service, the military arm being the RN itself.
The RFA runs the Ministry of Defence's fleet of tankers and naval supply vessels that feed, rearm and refuel the Navy at sea.
**When a boat or ship propels herself through water, her stern sinks lower than the rest of the hull depending how fast she's going.
This can be precisely calculated and the Royal Navy has tables for all of its ships giving the squat at known speeds.
***Severn has a sextant hanging on her bridge.
Your correspondent managed to clonk his head on it, mercifully while everyone else was looking the other way.
 
Links :

Thursday, October 21, 2021

Alaska to Greenland via the Northwest Passage

US CGC Healy


From NOAA by Lt. Patrick Debroisse


In August and September 2021, the U.S. Coast Guard Cutter Healy transited through the Northwest Passage, from Alaska to Greenland. This voyage provided members of the University of New Hampshire’s Center for Coastal and Ocean Mapping/Joint Hydrographic Center (CCOM/JHC) the opportunity to collect data, helping to fill gaps in current hydrographic coverage in the passage and in the U.S. Exclusive Economic Zone (EEZ). Data in the Arctic where sea ice impedes ships is sparse. This is concerning as the Arctic nations, especially the United States, Canada, and Greenland evaluate both extended continental shelf claims and the potential for shipping routes through the Northwest Passage.

 
U.S. Coast Guard Cutter Healy’s track from Seward, Alaska to Nuuk, Greenland.
(Credit: Paul Johnson, CCOM/JHC)

A unique data collection platform

Healy is a unique asset to the scientists aboard in its capacity as a heavy icebreaker designed to conduct a wide range of research activities.
Healy is equipped for collecting echo sounder data; conductivity, temperature, and depth data; and is set up for scientists to bring their own equipment.
This leg was a science accommodation cruise, meaning any data had to be collected while underway as no stops were planned. Scientists aboard installed equipment to collect water and air samples as well as to test surface and deep sea water chemistry.

The mapping team’s goal is to transit over areas in U.S., Canadian, and Greenland waters where modern bathymetric data is sparse or non-existent.
Dr. Larry Mayer, from CCOM/JHC, determined priority areas with the help of the Canadian Hydrographic Service and the Danish Geodata Agency (Geodatastyrelsen).
Data was continuously collected from the time the ship left Seward, Alaska on August 25 until it arrived in Nuuk, Greenland on September 13.

 
Larry Mayer (CCOM/JHC) and Paul Johnson (CCOM/JHC) discuss the survey plan with USCG Capt. Ken Boda. (Credit: John Farrell, U.S. Arctic Research Commission)

The data will be used to add to the world’s knowledge of the ocean floor via the General Bathymetric Chart of the Oceans and will be provided to the respective charting agencies – NOAA’s Office of Coast Survey, the Canadian Hydrographic Service, and the Danish Geodata Agency – for use in the safety of navigation and navigational products.
Seabed 2030 is an international initiative to map the world’s oceans by the year 2030.
For areas where the ship is traversing through U.S. waters, the data collected will contribute to Seascape Alaska, a regional mapping campaign supporting the 2020 National Strategy for Mapping, Exploring, and Characterizing the United States Exclusive Economic Zone. This National initiative also contributes to Seabed 2030.

Additional projects

Several additional National Science Foundation funded projects were carried out while Healy transited the Northwest Passage.
Two scientists from the University of Alaska at Anchorage conducted experiments to understand the exchange of water between the oceans, land, and air by tracking isotopes in water and air samples. Another group of scientists from Oregon State University are seeking to understand the primary production of phytoplankton in the changing Arctic by evaluating dissolved gases and suspended carbon to track algal blooms and attempt to determine their causes and frequency.
Additionally, two scientists from the National Geospatial Intelligence Agency were aboard to collect gravity calibration data along the passage, linking the data previously obtained in the eastern and western Arctic.

Search and rescue exercise, and helicopter operations training
 
In addition to the science mission of the trip, the Coast Guard took the opportunity to train in several complex evolutions.
Early in the leg, Healy conducted helicopter operations in conjunction with an MH-65 short range recovery helicopter flying out of Cordova, Alaska.
The ship’s personnel practiced receiving and launching the helicopter as well as refueling operations.

 
An MH-65 takes off from U.S. Coast Guard Cutter Healy during training operations. 
(Credit: Lt. Patrick Debroisse, NOAA)

Later in the trip, the ship conducted a search and rescue exercise with the Canadian Coast Guard in the area of Resolute, Nunavut, Canada.
The exercise included flight operations for a visit by the Commandant of the Coast Guard, Adm. Karl Shultz, and a moc-search for a reported missing zodiak boat and crew.

 
Canadian Coast Guard Ship Amundsen passes along side USCGC Healy during joint training near Resolute, Nunavut, Canada. (Credit: Lt. Patrick Debroisse, NOAA)

Wednesday, October 20, 2021

Under the spell of the ice and cold on an Arctic expedition


From National Geographic by Esther Horvath

During weeks on a research vessel drifting with an ice floe in the polar night, a photographer discovers profound beauty—and her own limitations.
Polar bear guard Trude Hohle checks for a safe path across the sea ice during a 2019 scientific expedition in the Arctic Ocean.

The icebreaker Polarstern floated on the transpolar drift stream, frozen in sea ice, for nearly a year.
On board were about a hundred scientists and crew members who were braving the polar winter to study climate change in the Arctic.
I was there too, photographing the first leg of the MOSAiC expedition—the Multidisciplinary drifting Observatory for the Study of Arctic Climate.
It was the longest and largest Arctic expedition in history and, for me, a gift from the universe.


NGM maps

Four years earlier I’d fallen under the spell of the ice and cold on my first Arctic assignment.
When I returned home, I vowed to devote my photography to the fragile polar environment that had mesmerized me.
Shortly afterward I heard about MOSAiC and knew I had to go.

By the time the Polarstern set sail from Tromsø, Norway, on September 20, 2019, I’d been on nine other polar expeditions.
MOSAiC was different.
For one thing, the first few legs took place during the long polar night.
For another, help was very far away.
The ship, intentionally trapped in an ice floe, drifted close to the North Pole during winter, when the ice was thickest.
If anything had gone wrong, it would have taken two or three weeks for help to arrive and then two or three more weeks to return to human habitation.
We had to be prepared to handle everything ourselves—from fire to falling into frigid water to heart attacks.
(Toothaches were dealt with preemptively: I was told to have my wisdom teeth removed before the trip.)


For winter legs of the MOSAiC expedition, mandatory training prepared members for emergencies including falling into the frigid Arctic water.
A participant is hauled out of a pool after swimming through the crashing waves and howling winds of a simulated storm.


Training began long before the expedition.
Subjected to worst-case scenarios, we were taught how to get through them.
During a simulated storm in a training pool, we jumped into rough water and swam through crashing waves to a life raft.
We couldn’t see except for occasional flashes of lightning; the deafening wind and thunder prevented us from communicating with each other.
During polar bear safety training, we practiced shooting a rifle and a flare gun in complete darkness while people screamed around us.
Some days I was so tired I cried.

I did every training twice—once as a participant and once as a photographer.
The hardest was the firefighting.
We learned how to put out fires and rescue people—all while wearing 66 pounds of gear in a controlled-burn training room where temperatures neared 250°F.
For each exercise, participants spent about 10 minutes in the room.
When I was photographing them, I stayed there for hours, holding my heavy camera with sweat dripping down my body.
After it was over, I collapsed against a wall.

Yet I enjoyed it.
It felt important to learn how to take care of myself and my colleagues in extreme conditions—and to learn what my limits were.
I even volunteered for sea survival training, during which 14 of us were left for a few days on Svalbard, a Norwegian archipelago.
We had to figure out how to distribute our limited supplies (only five sleeping bags), get water, and protect ourselves from the area’s 3,000 polar bears.
By the end, I was exhausted but strangely comfortable with the upcoming expedition.
I knew I was prepared.

We arrived at the ice floe that was to be our home on October 4, one of the last days the sun rose above the horizon.
Very soon the days passed in darkness.
The moon and the stars were often covered by clouds.
The only light came from the Polarstern’s spotlight and the headlamps worn by the participants.

Photographing was difficult.
Wind and blowing snow made it hard to see through the camera’s viewfinder, especially when I was wearing goggles.
My hands became painfully cold.
Many times I saw a beautiful moment but couldn’t capture it because my hands weren’t working.
Eventually I covered my camera, including the trigger, with a very thin foam tape that allowed me to operate it while wearing mittens.

Every day I had to remind myself that I wasn’t on land.
Only two to three feet of unsteady ice lay between me and the ocean below.
Under the lights from the ship, the ice appeared gray; the sky was pure black.
It made me think of the famous NASA pictures taken from the moon in which you can see the lunar surface and then the universe in the background.
From the ice I could see the universe.
Those were the days I enjoyed most.

But the darkness also held terrors, which for me meant polar bears.
On my second—and last—day as a polar bear guard on the ice, I stood alone with my rifle outside a tent where two scientists were working.
There was too much wind, too much snow, and too much darkness to see anything, even an eight-foot-tall polar bear.
But I remembered that a trip wire had been installed around the science station.
If a polar bear ambled through, a signal would flare.

As I was having that thought, an orange signal shot into the air.
My next thought: The polar bear is scared, and it’s running straight toward me.
I tried to take out my signal pistol to scare the bear away—our goal was to protect the bears as well as ourselves—but my hands were so frozen I couldn’t do it.
One of the scientists grabbed it for me.
By the time we made it back to the ship, I was shaking.
Later the crew determined that the wind had tripped the wire.
Even so, I decided that from then on I would shoot only with my camera.

On December 13 we saw a ship on the horizon: the icebreaker Kapitan Dranitsyn, coming to drop off the next team and pick us up.
The return to Tromsø took 16 days, often through thick ice.

About a week after my return I was in Washington, D.C., for National Geographic’s Storytellers Summit.
As I walked through the city streets one morning, I had a sudden realization: I couldn’t fall through the ice into the ocean here.
I didn’t have to scan the horizon for polar bears.
I was safe.
In that moment I understood how vigilant I’d become and how much fear I had felt.
And yet, I missed the darkness so much.

This story appears in the October 2021 issue of National Geographic magazine.


Tuesday, October 19, 2021

Imray layers update in the GeoGarage platform

La Niña is back. Here’s what that means.

Global sea surface temperature anomalies in degrees Celsius. (Climate Reanalyzer)

From WP By Matthew Cappucci
 
La Niña is back. Here’s what that means.
The atmospheric and oceanic pattern will have a bearing on the Western drought, the end of hurricane season and the forecast for winter and spring


After a months-long period of relative atmospheric balance between El Niño and La Niña, the National Oceanic and Atmospheric Administration announced Thursday that La Niña has returned.
It’s expected to stick around in some capacity through the winter and relax toward spring.

The intensifying La Niña should peak in magnitude, or strength, by the end of 2021, having bearings on the drought in the West, the end of hurricane season and the upcoming winter.
La Niña also plays a role in shaping how tornado season pans out in the spring.
 

It’s one of many drivers in our atmosphere, but it is often among the most important given the extent to which it shuffles other atmospheric features key in determining how weather evolves over the Lower 48.
In brief, here are some of the key impacts La Niña could have in the coming months:

Extending favorable conditions for Atlantic hurricane activity this fall.
Worsening drought conditions in the Southwest through the winter and potentially elevating the fire risk through the fall.
Raising the odds of a cold, stormy winter across the northern tier of the United States and a mild, dry winter across the South.
Increasing tornado activity in the Plains and South during the spring.

La Niña is the opposite of El Niño, which often makes headlines for spurring powerful southern storms that can generate beneficial rains in California and track across the entire nation.
During La Niña, such winter storms tend to be less frequent.

About six weeks remain until the start of meteorological winter (Dec. 1), and forecasters are already looking ahead to what may be in store.
There’s still a long way to go before the first flakes fly in most places, but some meteorologists are already tossing their hats in the ring, trying to broadly gauge what lurks ahead.


A schematic for a traditional La Niña. (Climate.gov)

What is La Niña?


La Niña begins with a cooling of waters in the eastern tropical Pacific.
The basin alternates between El Niño and La Niña every two to seven years on average.
That pocket of cooler ocean water chills the air above it, inducing a broad sinking motion.
It’s that subsidence, or downwelling of cool air, that topples the first atmospheric domino.

During La Niña winters, high pressure near the Aleutian chain shoves the polar jet stream north over Alaska, maintaining an active storm track there.
The Last Frontier often ends up cooler than average.
The confluence of the polar and Pacific jet streams, as shown in the image above, helps drag some of that cold air across the Pacific Northwest and adjacent parts of the northern Plains.

That keeps the northern United States anomalously wet, while the South is left largely warm and dry. This is bad news for California and other parts of the Southwest, which are enduring a historic drought. The persistence of warm, dry conditions would cause the drought to worsen and potentially prolong the fire season.

La Niña arrived in fall 2020 before fading away in May 2021. Neutral conditions, bridging the divide between La Niña and El Niño, prevailed through the early fall before the NOAA’s declaration of La Niña’s return Thursday.

La Niña tends to exert a slight cooling effect on global temperatures, but recent La Niña years are warmer than El Niño years were just a decade ago because of the warming influences of human-caused climate change.
Even with La Niña influencing global temperatures, 2021 still has a greater than 99 percent chance to rank among the top 10 warmest years on record, according to the NOAA.
 

Impact on hurricane season

Conditions that have begun to skew slightly toward La Niña have already helped amplify the effects of the 2021 Atlantic hurricane season, and were in large part responsible for supercharging the record 2020 season, during which 30 named storms occurred.
Though the Atlantic is mostly quiet at the moment and there are no immediate signs of tropical development, a month and a half remain in the season.

La Niña patterns reduce wind shear, or a change of wind speed or direction with height, over the Caribbean and western parts of the Atlantic’s Main Development Region (MDR), the strip of territory between the Lesser Antilles and the coast of Africa.
That calming of the upper-level winds is more conducive for fledgling clusters of thunderstorms to developed into named storms.

La Niña conditions also influence the Walker circulation, or a horizontal overturning circulation in the tropics, and induce broad upward motion over the Atlantic with some subsidence, or sinking, in the Pacific.

This season is running about 54 percent ahead of average in the Atlantic, but 28 percent behind typical norms in the Pacific.
Usually if air is rising somewhere and enhancing storm prospects, sinking elsewhere has the opposite effect.

Though it’s impossible to predict specific storms or periods of active tropical weather, it looks like something called a convectively coupled Kelvin wave could favor more upward motion in the Atlantic beginning around Oct. 22.
That, assisted by the nascent La Niña conditions, would indicate a window of slightly greater odds for tropical development.

The Georgetown waterfront in Washington on a warm winter day. (angela n./Flickr)

What lies in store for winter

Winters are notoriously difficult to predict because of the complexities of pinpointing storm tracks, rain-snow lines and precipitation amounts more than a few days in advance.

Weather.com published a broad winter outlook for temperatures that is commensurate with typical La Niña expectations, depicting below-average temperatures in the northern United States and above-average warmth in the South.
It did not include notes on expected precipitation departures from average.

Weather.com winter temperature outlook. (Weather.com)

AccuWeather offered more details on precipitation in their outlook, predicting near to slightly above-average snowfall for New England and average snowfall in the Mid-Atlantic.

Parts of the Front Range, High Plains and Columbia River Basin in the Rockies, as well as the Ohio and Tennessee Valleys and Midwest, are included in AccuWeather’s prediction of above-average precipitation; the Southwest and Southeastern United States are in line to see unusually dry conditions.

Through the end of 2021, AccuWeather calls for little of the rain needed to ease the drought and fire risk in Southern California. 
“The lack of early-season precipitation will allow the ongoing wildfire season to extend all the way into December, an unusually late end to the season,” it wrote.

The National Weather Service Climate Prediction Center isn’t slated to issue its updated December through February forecast until Oct. 16, but its mid-September outlook indicated that virtually the entirety of the Lower 48, save for the Pacific Northwest, should see near to above-average temperatures. Its precipitation forecast is similar to AccuWeather’s, with drier conditions probable in the South and an uptick in precipitation for northerly regions.

Winter forecasts depend on far more than just La Niña, though, as evidenced by the record-shattering cold blast of February that wrought havoc on Texas’s electrical grid.
Judah Cohen, an atmospheric scientist and the director of Atmospheric and Environmental Research in Boston, says it’s just too early to know how other atmospheric players may influence the season.

“The most impressive atmospheric feature [lately] has been this ridge of high pressure over Eastern Canada,” he wrote in a Twitter direct message. “It has acted like an immovable boulder in the jet stream, and if that feature stayed park over Eastern Canada for much of the winter we would all be saying ‘what winter?’ ”

He does think that could change, but a transition like that is something that weather models struggle to anticipate.
“Where that block relocates will could be potentially critical to how the winter begins and may even set the tone for the winter,” he wrote.

The behavior of the polar vortex, the zone of frigid air surrounding the Arctic, will also play a crucial role.
It’s been showing signs of weakening or becoming more unstable as of late.
A weak, unstable vortex is more prone to unleashing frigid air over the Lower 48, compared with one that is strong and stable and that tends to lock up cold over the high latitudes.
“Once the polar vortex weakens, it could be predisposed to further weakening in the coming weeks or months and we have a more severe winter,” Cohen wrote.

But Cohen also said there are influences that could halt any vortex weakening.
He mentioned a scenario in which “the polar vortex rapidly strengthens as we approach the beginning of winter and we have an extended mild period to begin winter and possibly persisting right through the end of winter.”
 
The National Weather Service’s September forecast for what may lie in store this winter. (NOAA/CPC)

Severe weather season

If La Niña lingers into spring, it could enhance the upcoming severe weather season in tornado country across the Great Plains and Deep South.
There is a demonstrable link between La Niña and a more active severe weather season.

La Niña amplifies south-to-north temperature contrasts across the central Lower 48, which sets the stage for repeated clashes of the seasons.
That can lead to more episodes of severe weather.

The link between El Niño/La Niña and springtime severe weather. (Climate.gov)

Links :

Monday, October 18, 2021

Why maps are civilization’s greatest tool

 
 From Popular Mechanics by Meg Neal

Eight maps, from antiquity to today, that changed how we see the world.

When Christopher Columbus first set foot in what's now the Bahamas, it was the lucky sum of a 1,400-year-old cartographical error and Columbus's own miscalculations of the globe.
The Genoese explorer believed the Eurasian landmass to cover nearly 2/3 of the earth's circumference—the actual distance from Spain eastward to his target of eastern Asia was closer to 1/3 of the circumference.

Columbus’s image of the world was based on ancient maps that greatly overestimated the size of the Eurasian continent and depicted the planet’s circumference some 25 percent smaller than it actually was—a misjudgment compounded by his own wishful thinking and erroneous math.
By his calculation, India lay within a 2,500-mile voyage west of Spain.
He was off by about 8,000 miles.

Maps are a 10,000-year journey of humans trying to understand earth.

Columbus’s errors are only a chapter in a series of discoveries, theories, and mistakes that tell the story of maps and mapmaking.
Maps are a 10,000-year journey of humans trying to understand Earth.
In 1492, most people had no idea what the world looked like; even some impressively accurate maps were full of myths and mistakes, from fantastical monsters to entire missing continents to swaths of terra incognita, or “unknown territory.”

Over time, errors were corrected and empty spaces were filled in, and today, much of the population walks around with a map of the entire Earth in their pocket that’s so detailed you can see your own front door.
But to understand how we got here, look to these eight maps that tell the history of how we view the world.

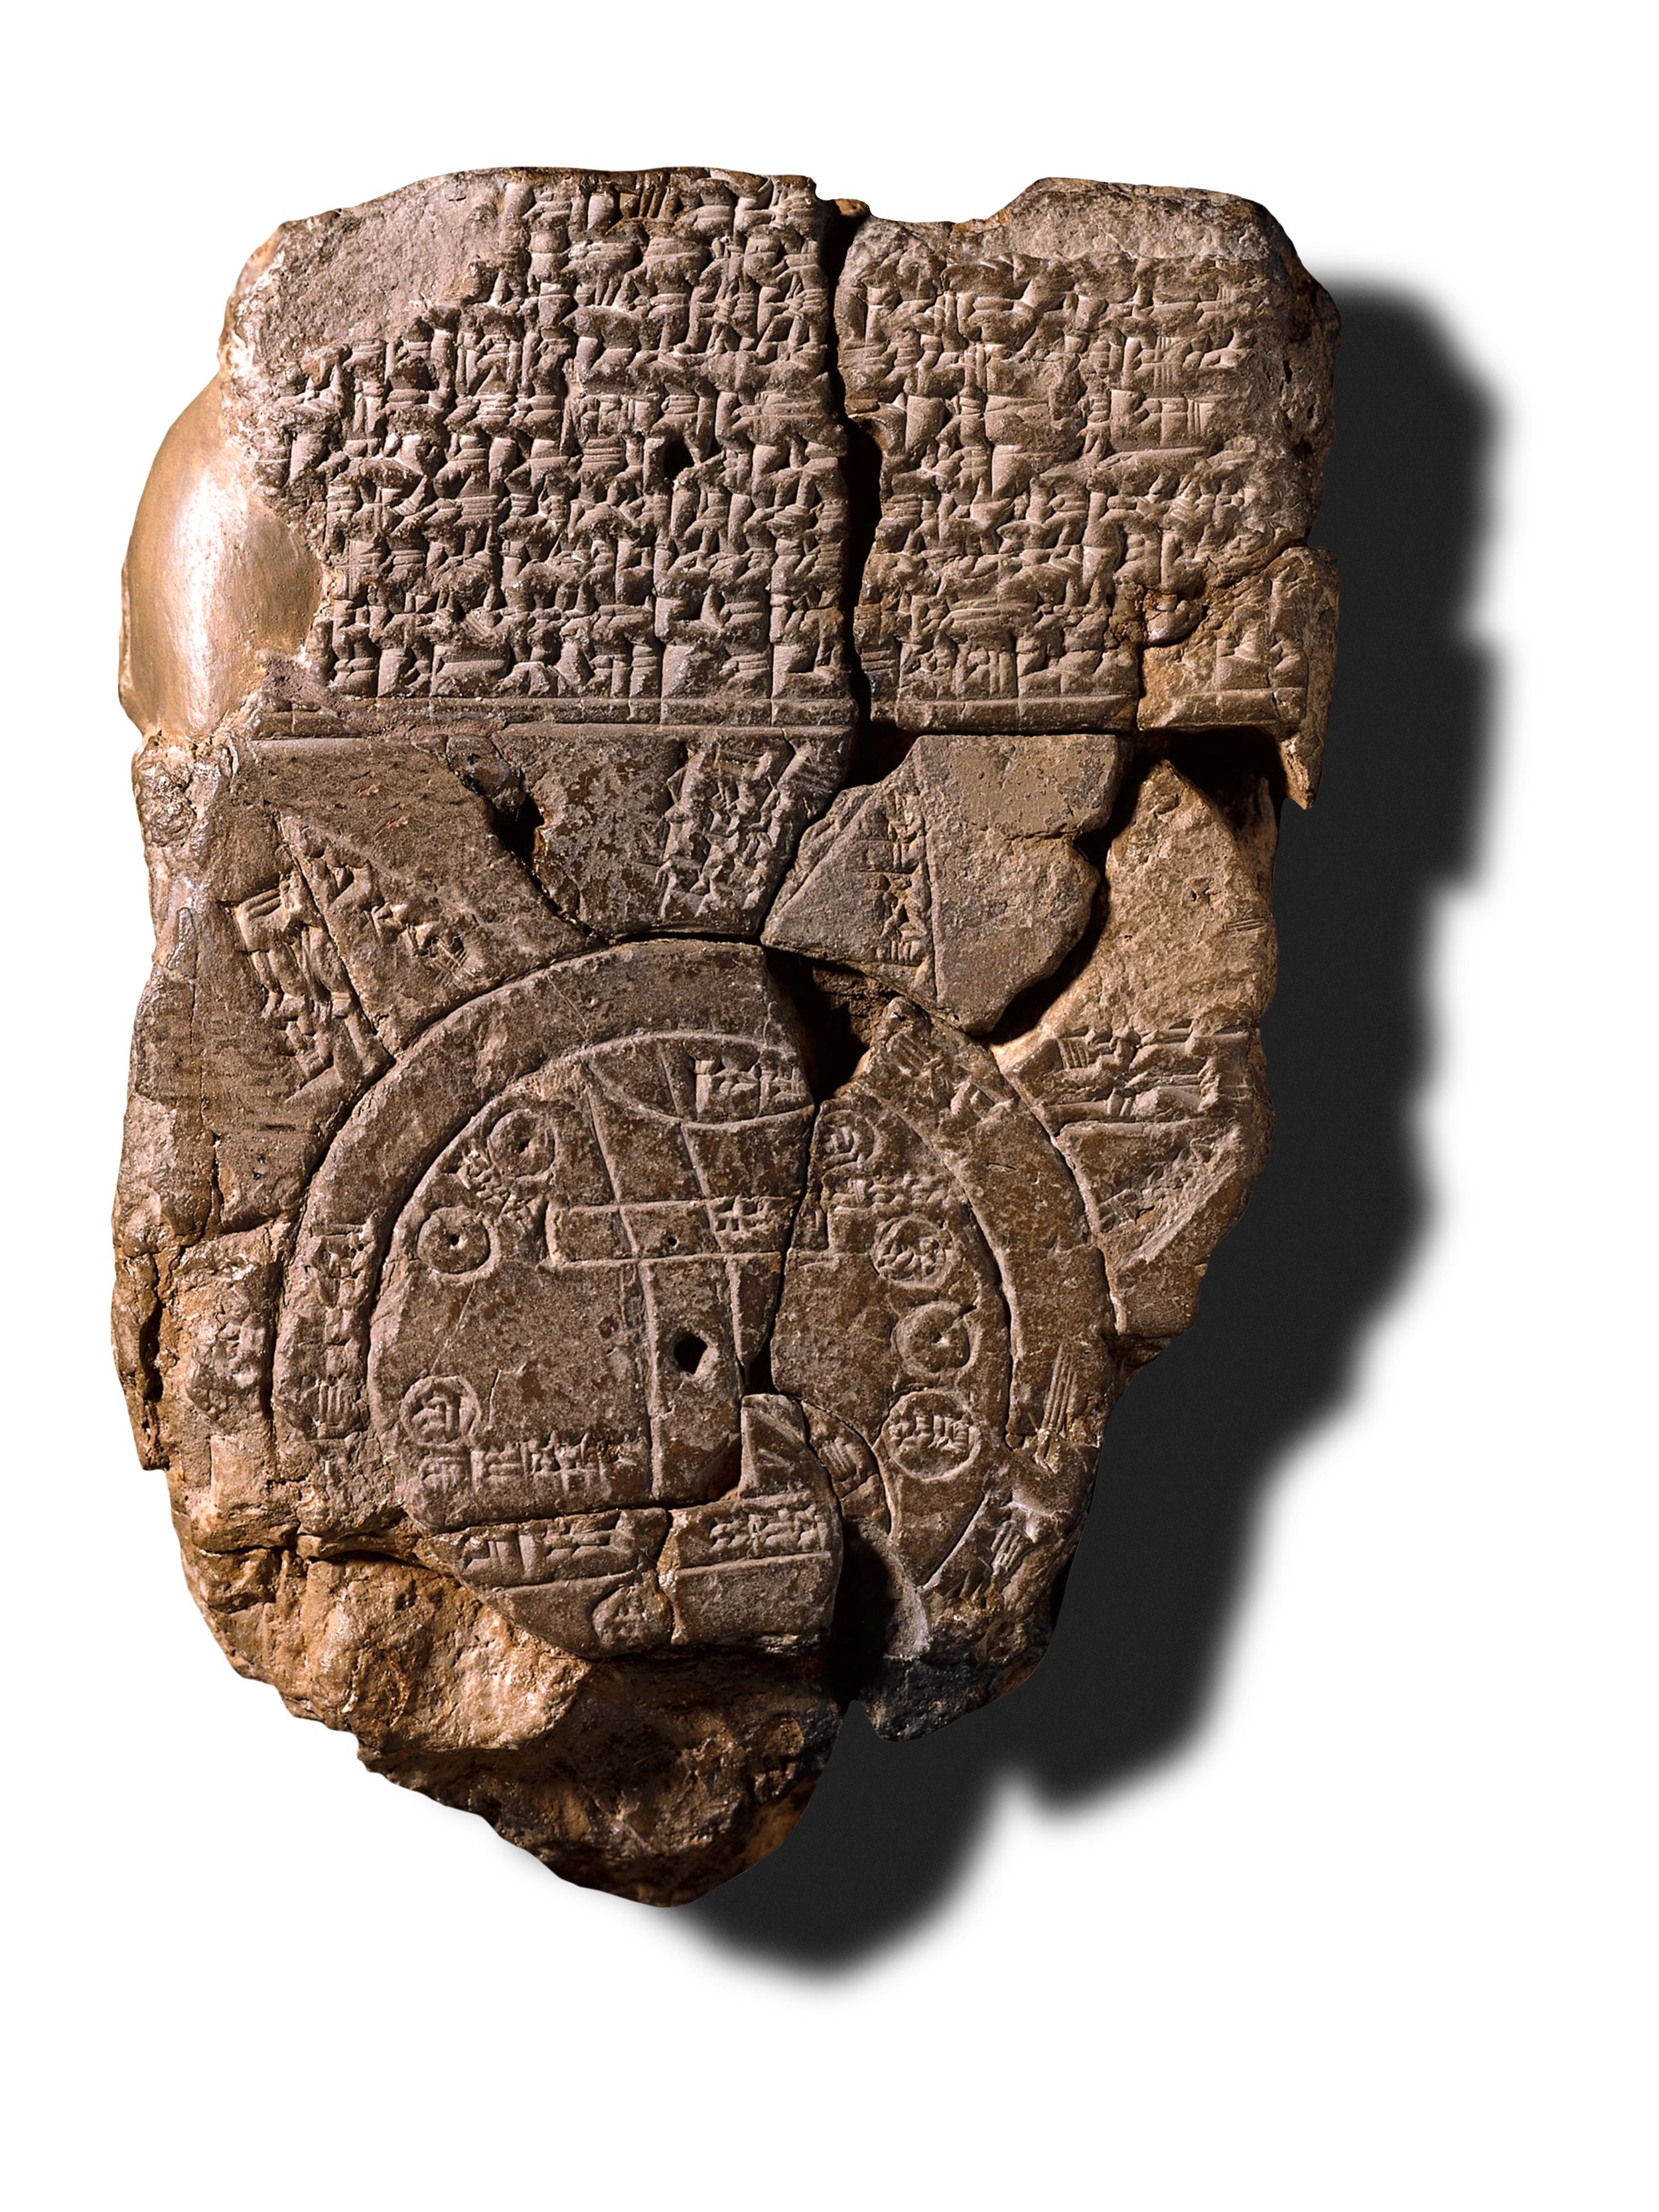
The oldest surviving world map : BABYLONIAN MAP OF THE WORLD
The Babylonian Map of the World, etched in the 6th century B.C.
Fine art images/heritage images getty images

The oldest surviving world map depicts the worldview of Babylonians circa 600 B.C.
The 5-inch stone tablet is centered around Babylon, the wide rectangle, which straddles the Euphrates River, depicted by the crooked lines running from top to bottom.
Babylon, likely the world’s most populous city at the time, is surrounded by neighboring cities represented by small circles, all within a greater circle to denote the ocean.
Though its geography is limited, this map reveals the inherent bias of mapmakers to place themselves at the literal center of the world.

Other early maps served more practical needs, such as the stick and shell charts built to denote currents around islands in the South Pacific over 2,000 years ago, or the Egyptian papyrus maps that led miners through the desert in the 12th century B.C.
But the Babylonian Map of the World is the earliest example of a political map used to champion a country or city.

The first world atlas : PTOLEMY’S GEOGRAPHIA


No original maps from Geographia survived, but this, the oldest recreation, was constructed in the 14th century according to Ptolemy’s map projection and locations
Phas/Universal Images Group via Getty Images

The Greeks were the first known culture to apply a scientific approach to measuring and mapping the world.
The philosopher Pythagorus theorized as early as the 6th century B.C.
that the Earth was round.
And by 200 B.C., the scholar Eratosthenes compared the angles of shadows cast simultaneously in two distant cities to accurately estimate the planet’s circumference within 1,000 miles.

Combining the work of earlier Greek scholars with travelers’ stories and town records from across the then-Roman world, Greek-Egyptian astronomer Ptolemy compiled Geographia, an eight-volume atlas that formed the basis for the next 1,500 years of mapmaking.
Completed around 150 A.D., Geographia served as a how-to manual for cartography.
Ptolemy explained map projections—depicting a globe on a flat plane.
And he listed the coordinates for 8,000 locations in Eurasia and northern Africa based on parallels of latitude and meridians of longitude, a precursor to today’s system.
Maps based on Ptolemy’s blueprint for the shape and size of the world informed Columbus’s voyage to the Americas and led Ferdinand Magellan’s expedition around the globe.
Yet his work disappeared with the fall of the Roman Empire, not reemerging for almost 800 years.

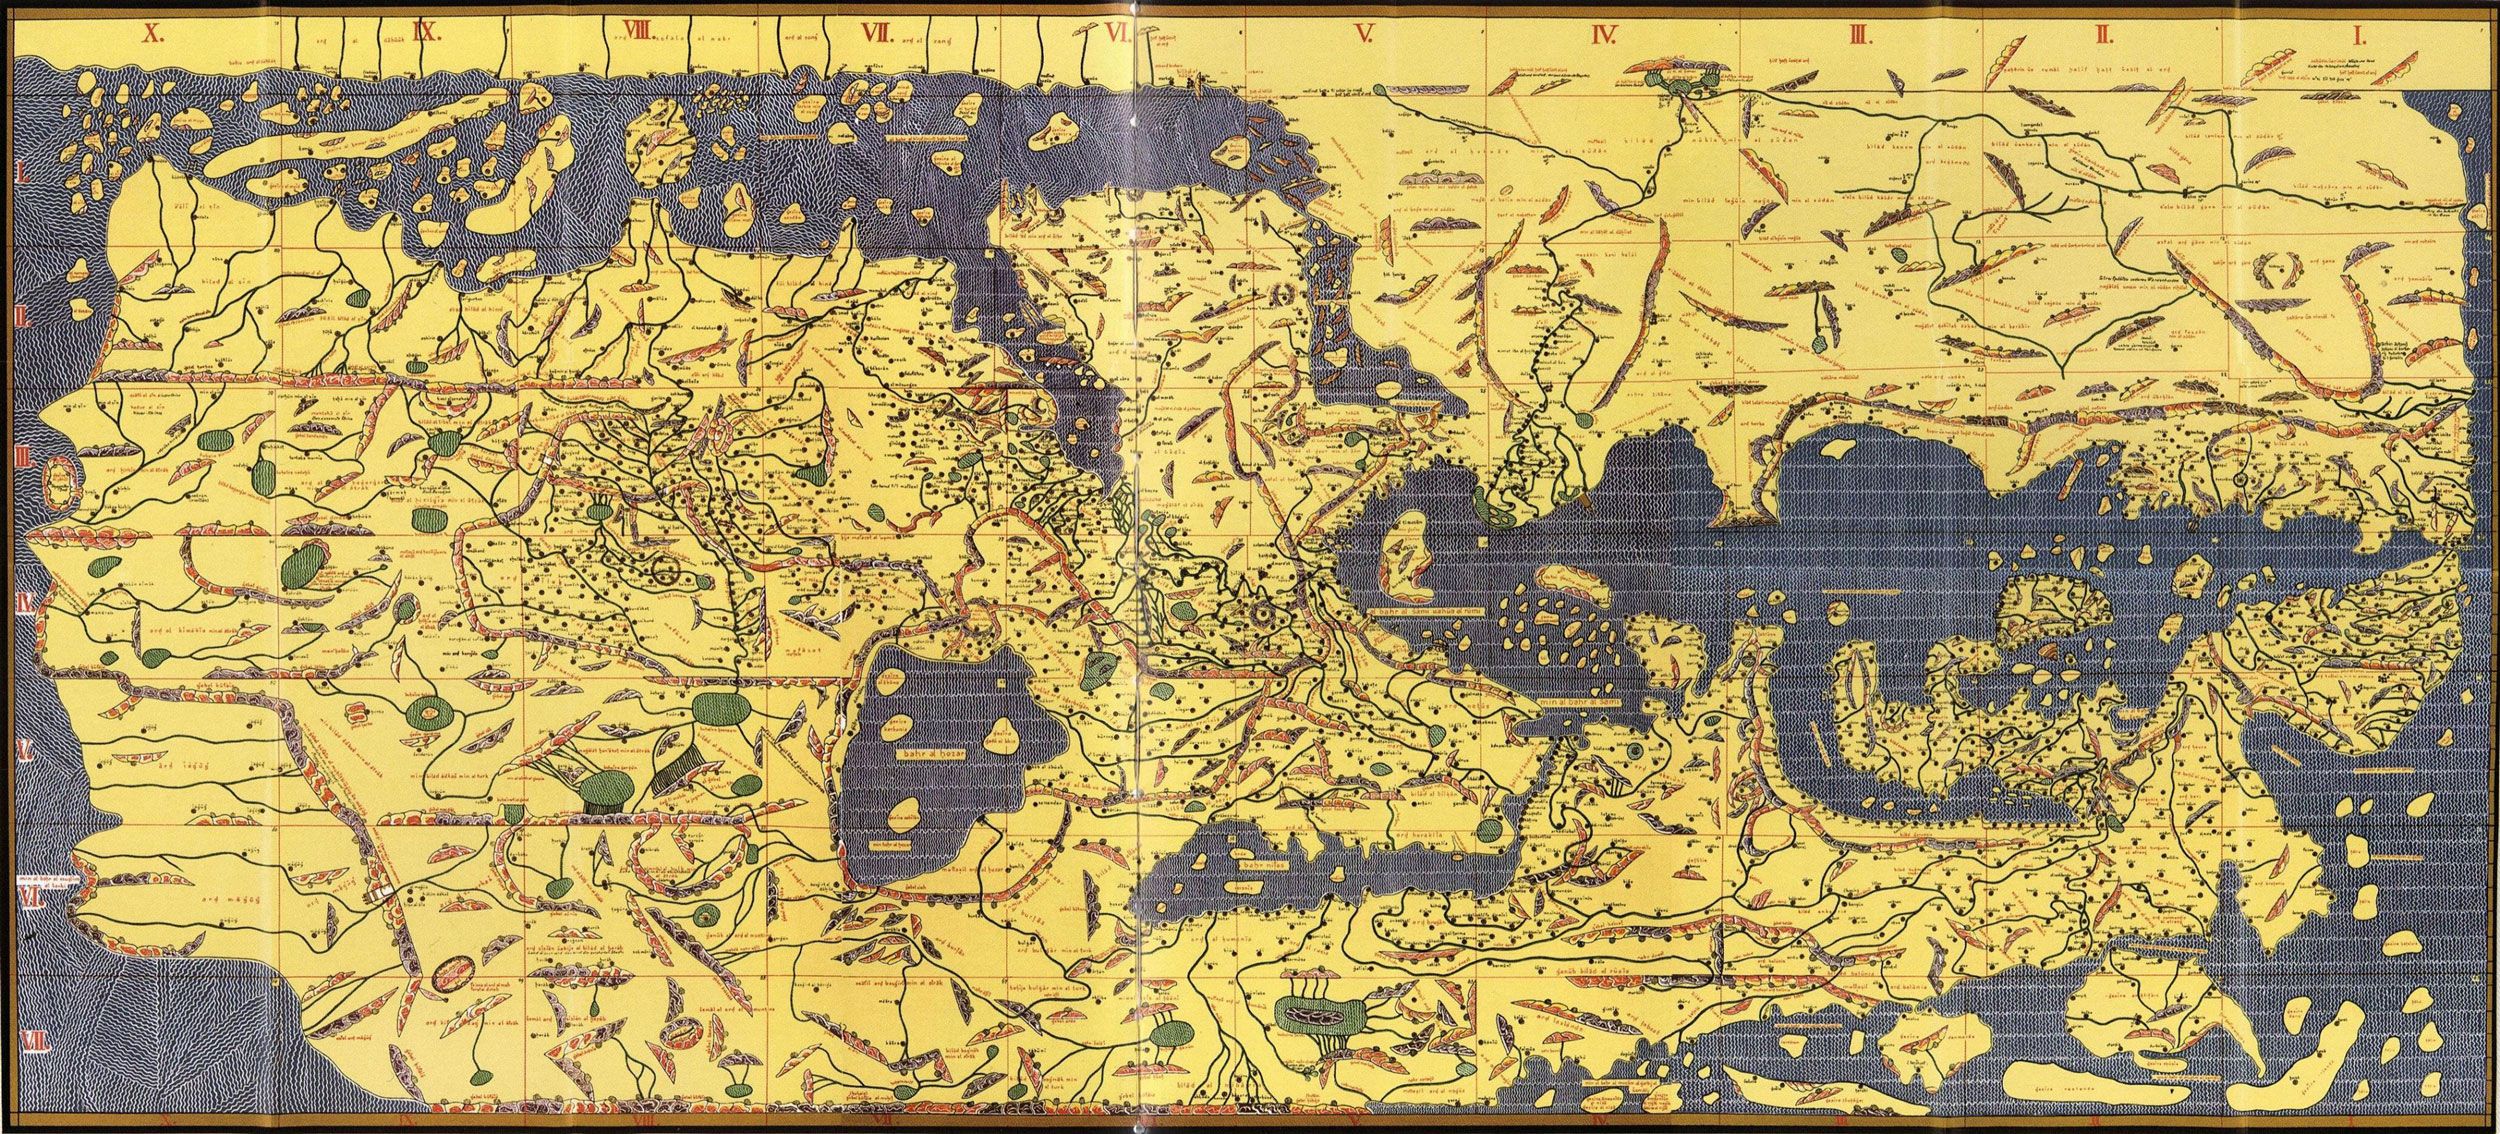
An update for the next millennium : TABULA ROGERIANA


Drawn by Muslim cartographer Muhammad al-Idrisi, this map of North Africa and Eurasia places south, the direction of Mecca, at the top.
Fine Art Images/Heritage Images/Getty Images

The Tabula Rogeriana, or Book of Roger, was completed by Moroccan cartographer Muhammad al-Idrisi in 1154.
Compiled over 15 years for King Roger II of Sicily—who hoped the map could inform and expand his rule—the book included a world map with 70 regional maps, each accompanied by a detailed description of their cities, roads, rivers, and mountains.
For the next three centuries, it was among the most accurate geographic works in existence of the known world.
It later helped guide Vasco da Gama’s voyage to India by sea.

Though it was produced for a Norman king in Italy, the atlas was a culminating achievement from the Islamic Golden Age—while science took a sabbatical in most of Europe during the early middle ages.
Al-Idrisi’s work was in large part based on Geographia, which was rediscovered and translated into Arabic around the 9th century.
Islamic cartographers built on Ptolemy’s work and corrected errors based on their knowledge of the growing empire.
They accurately drew the Indian Ocean as open and connected to the Pacific Ocean, instead of Ptolemy’s landlocked sea.

Islamic mapmakers also produced some of the most elaborate charts of the era, largely inspired by the need to determine the direction of Mecca from anywhere in the world.
Islamic world maps were oriented with south at the top, looking “up” toward the holy city.
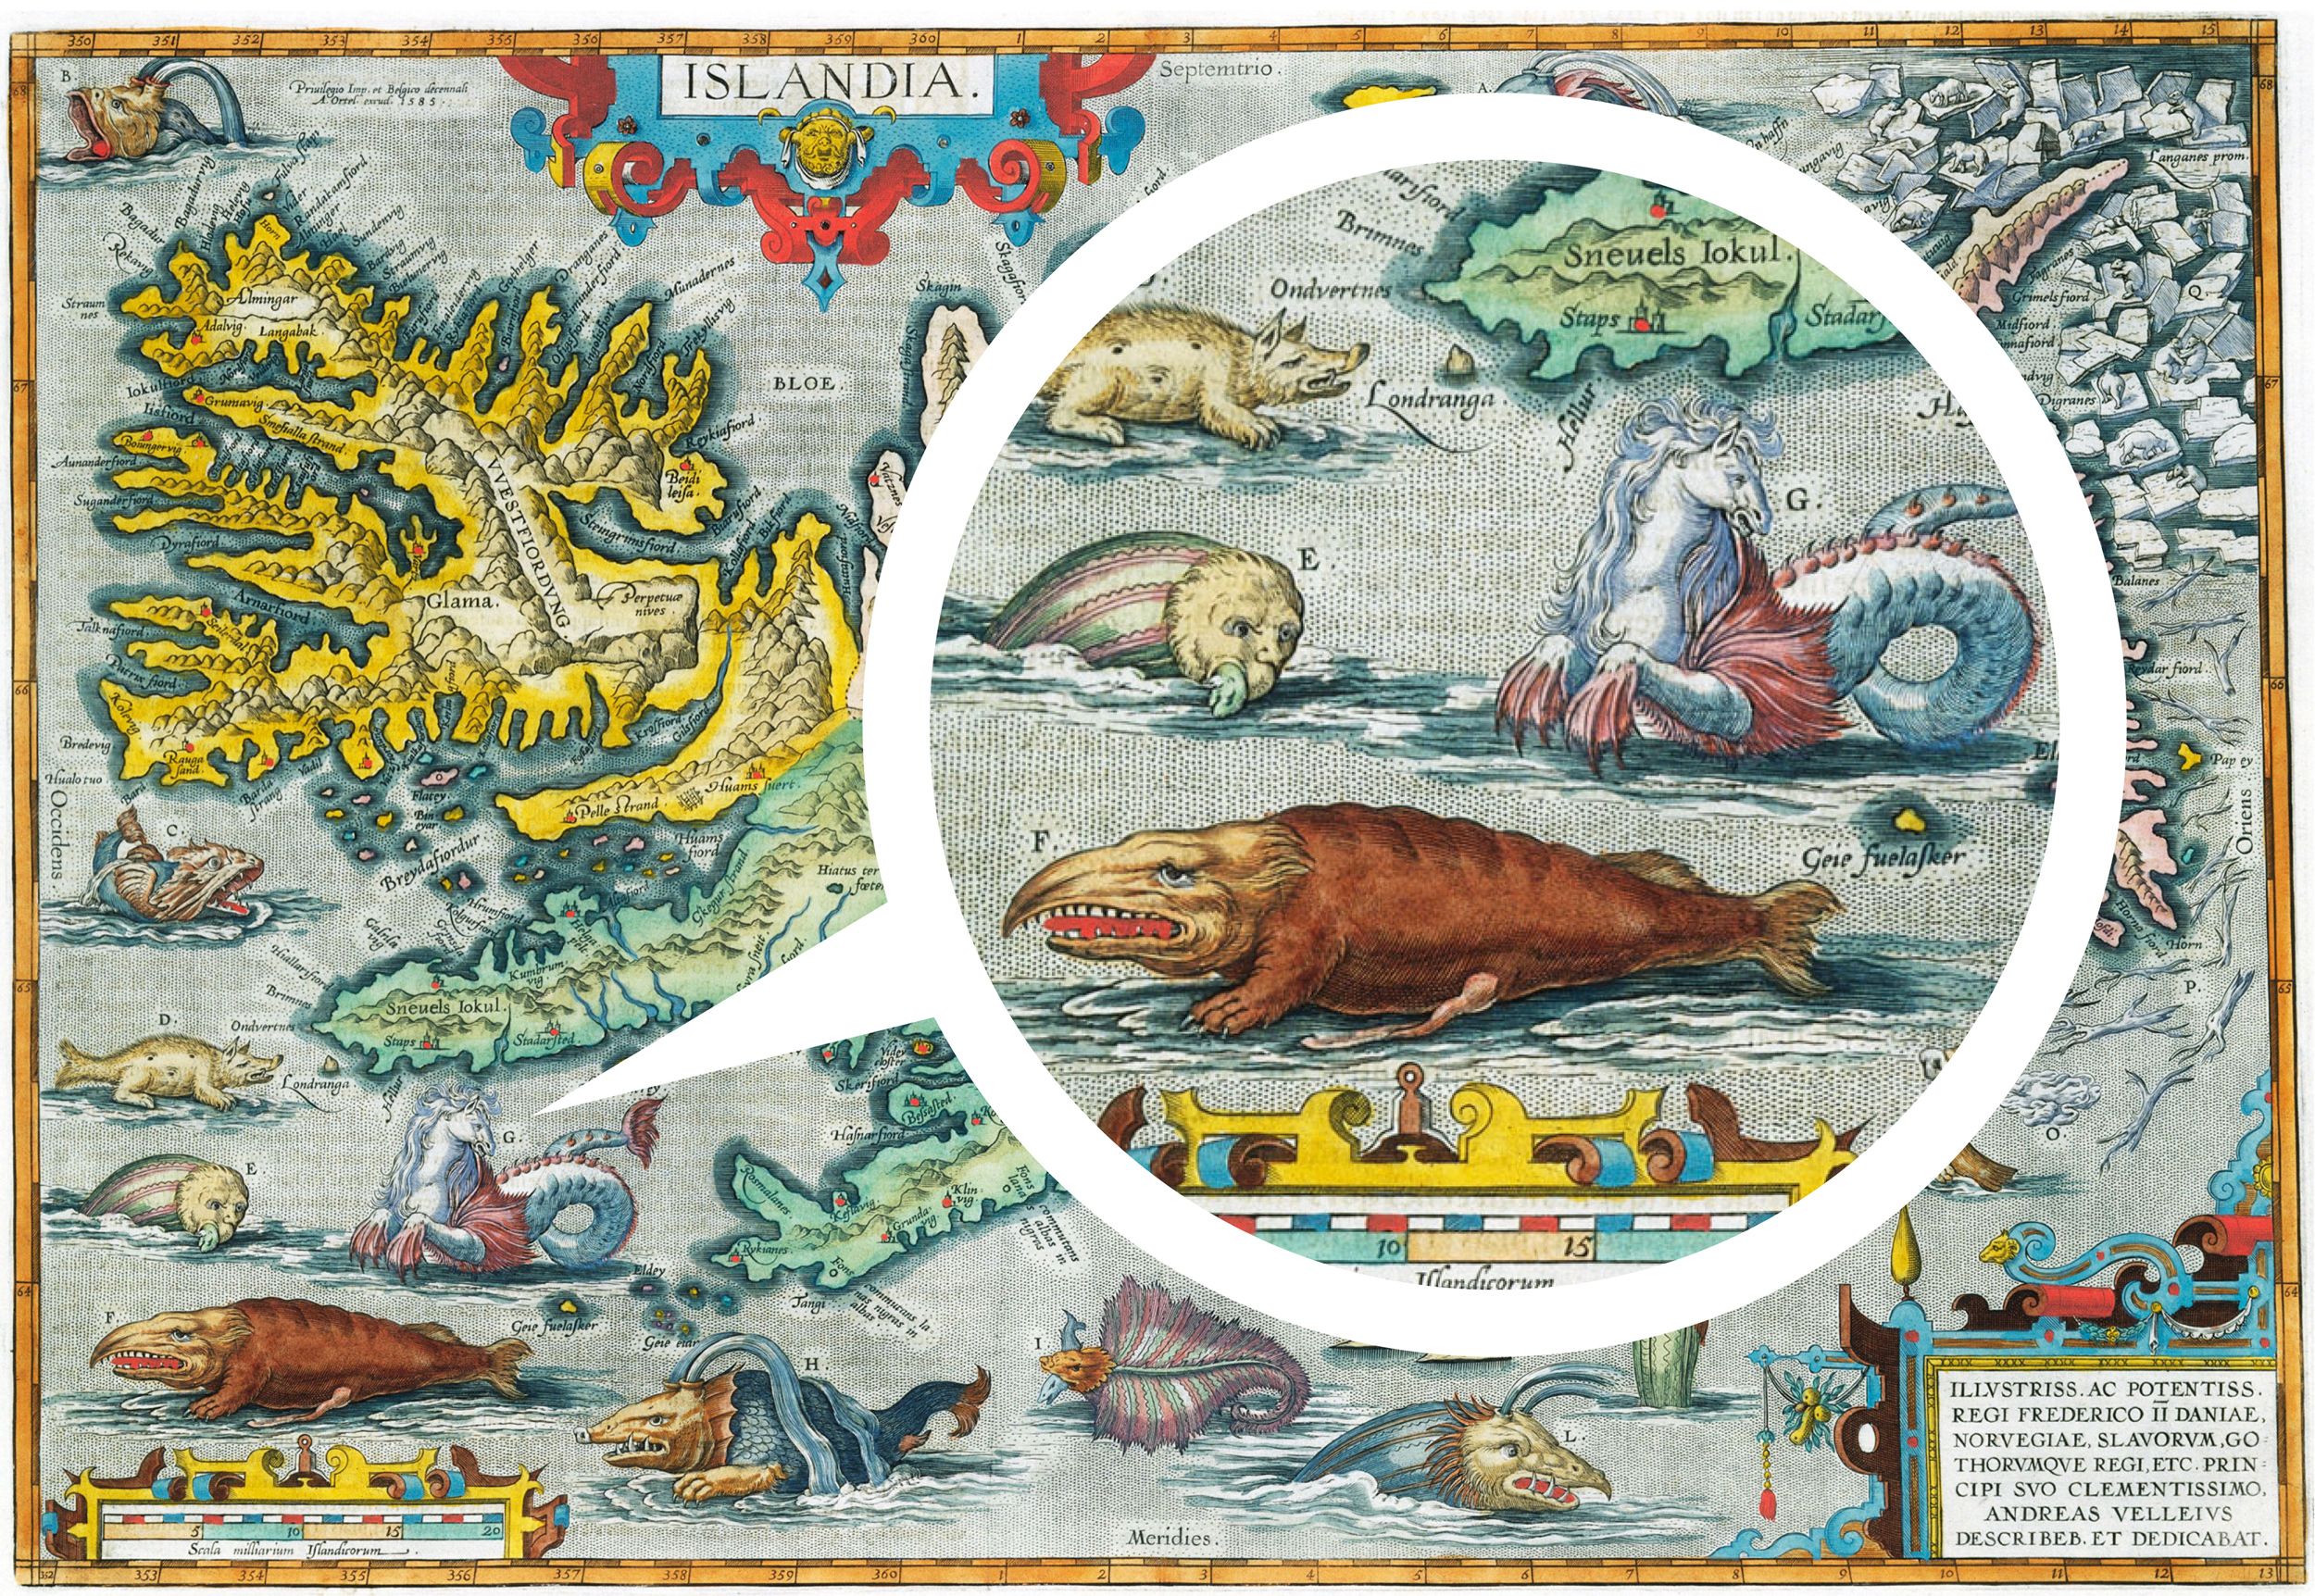
Where Be Dragons?

The famous warning “Here Be Dragons” is a map myth: It was never actually written on old maps, though a Latin version appears on one 16th-century globe.
Instead, the phrase represents the illustrations of monstrous sea serpents, toothy beasts, and strange peoples that frequently adorned medieval and Renaissance maps.

 Fine Art Photographic Library/Corbis via Getty Images

In most cases, map monsters were simple decoration, strategically filling in the empty parts of the map.
(Cartographers are known to abhor a blank space.) But often, these imaginary beasts were seen as very real threats, born out of inflated travelers’ tales and infused with religious myth and folklore.
They were often drawn lurking in uncharted waters, where they signaled the dangers that lie beyond the known world.
On some medieval world maps, the inhabitants of distant lands are depicted as strange mythical peoples.
You’ll find the headless “blemmyes” with faces in their chests, the desert “sciapods” with a single giant foot to shield the sun, and the “antipodeans” who live on the other side of the world (the Australian continent from the Europeans’ perspective) and whose feet point in the opposite direction.


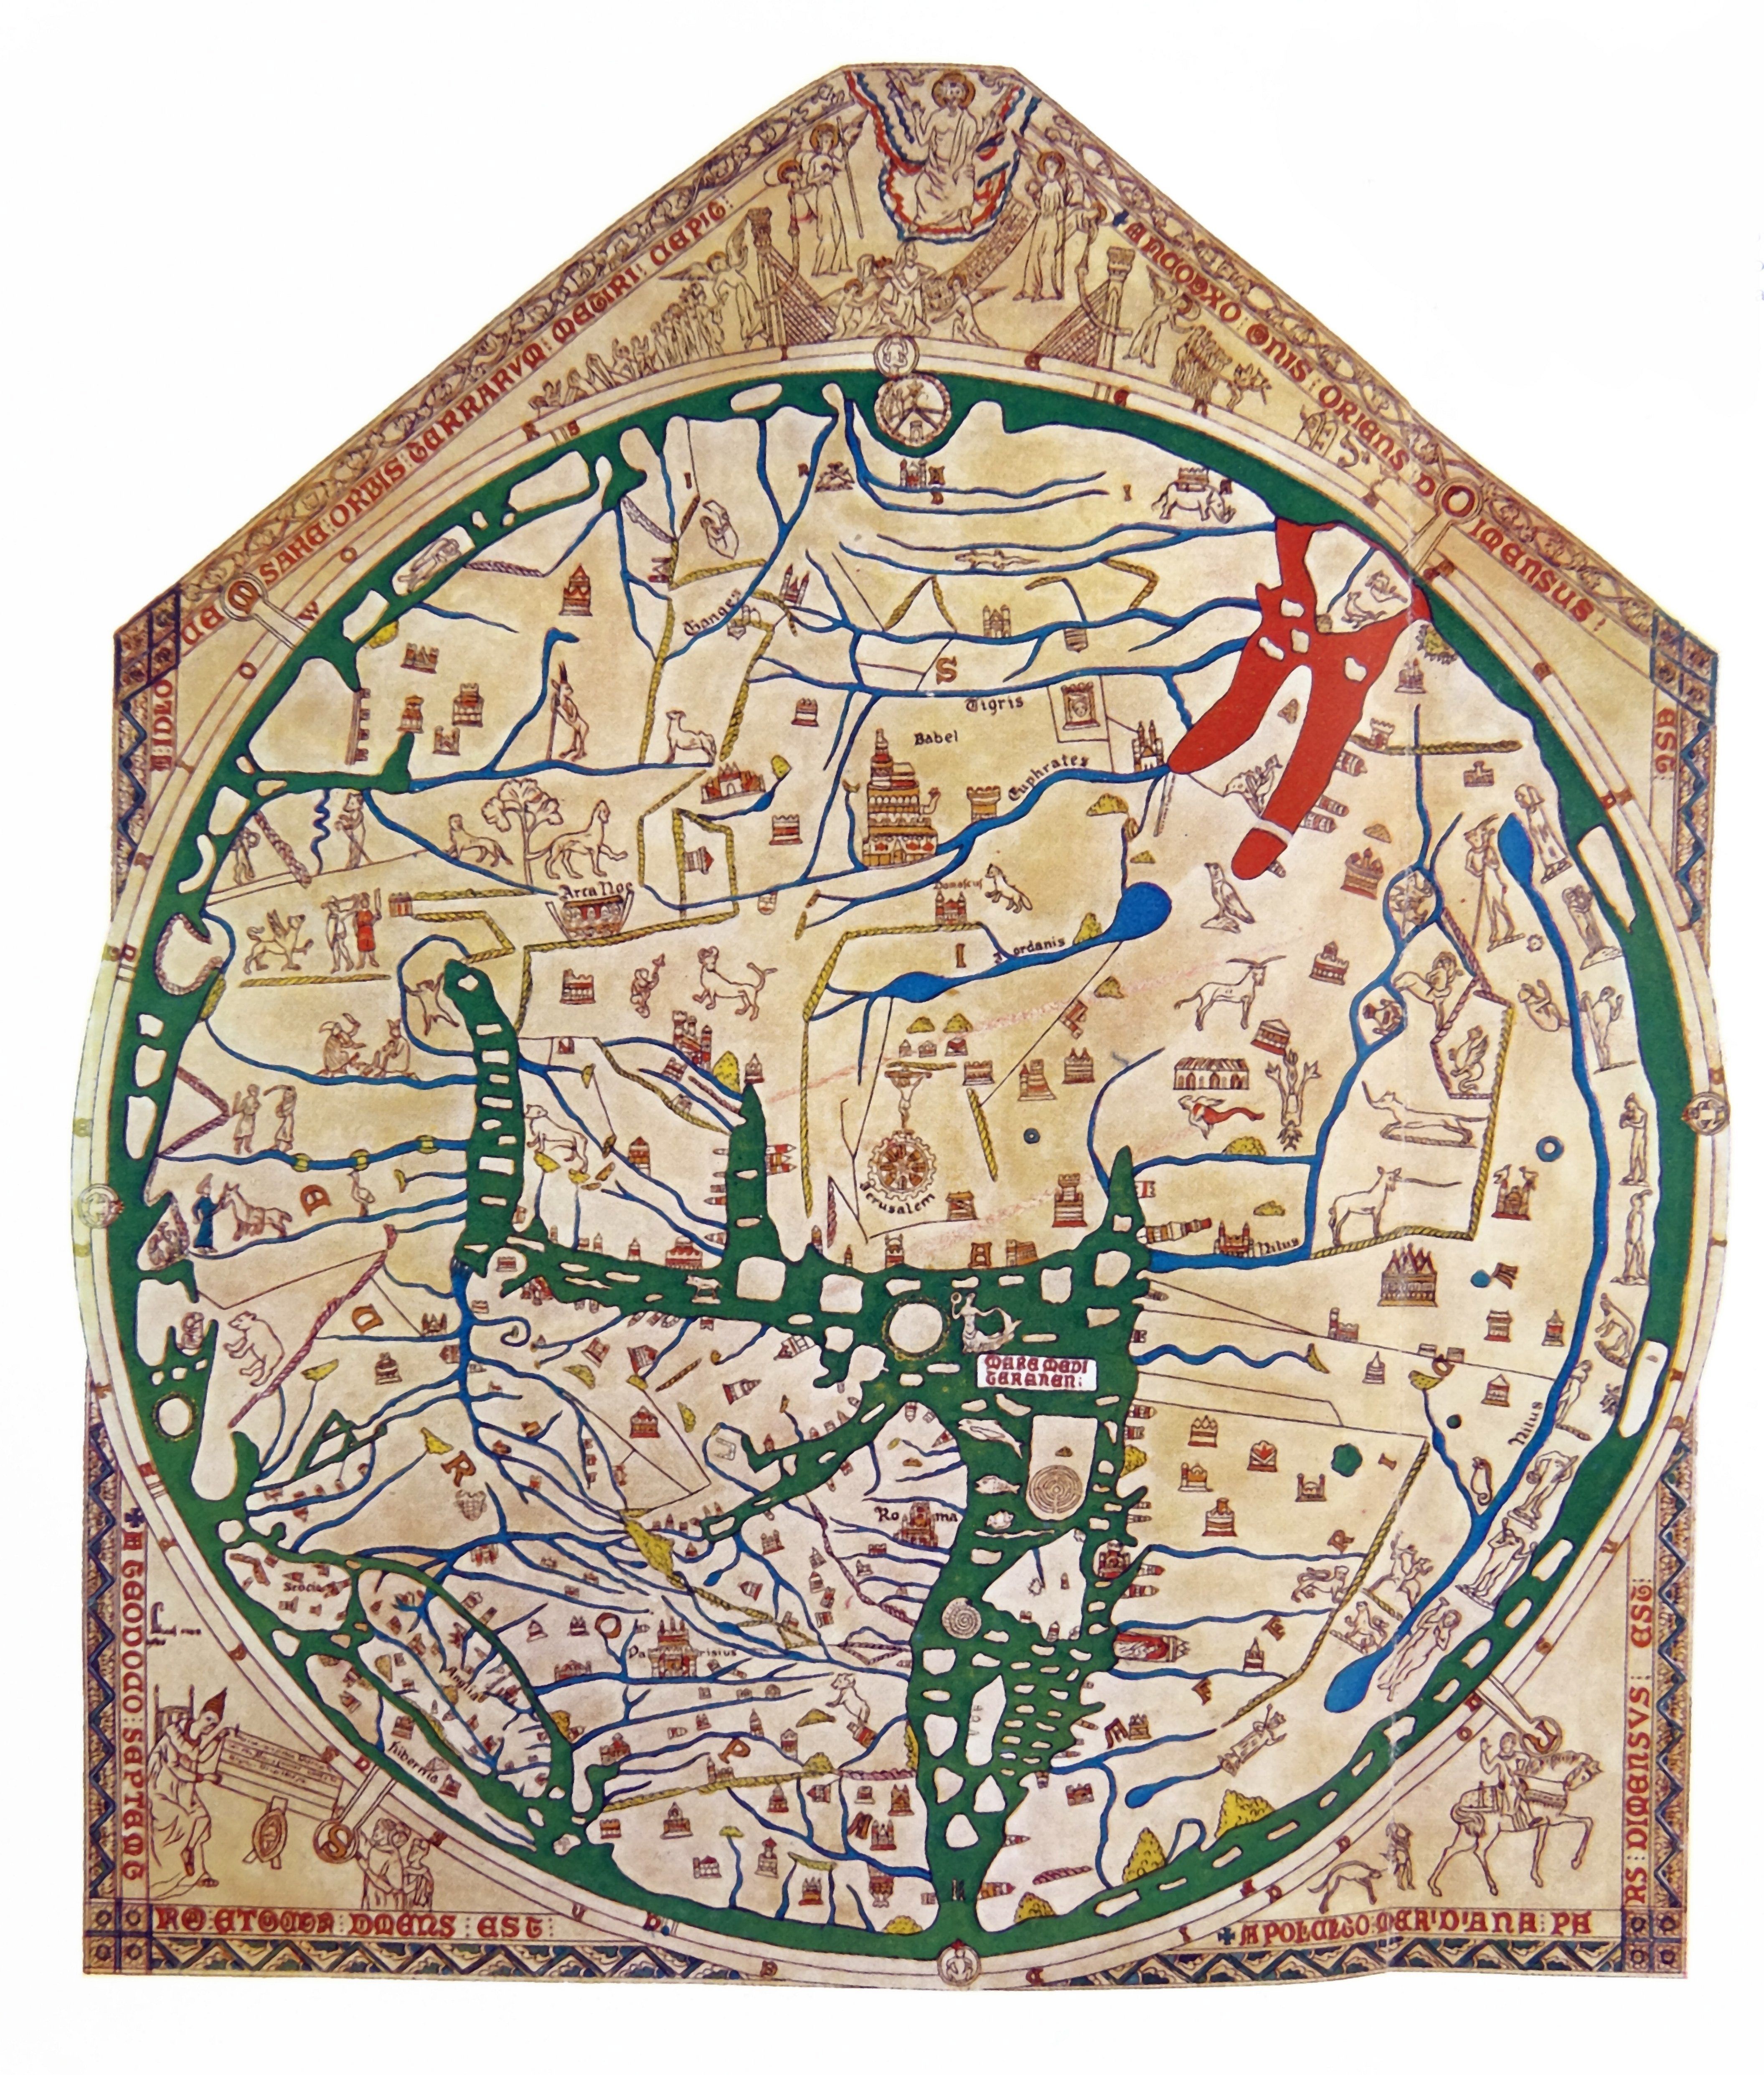
Mapping around Jerusalem : HEREFORD MAPPA MUNDI

A modern reproduction of the Hereford Mappa Mundi.
Europe is in the lower left quadrant.
Universal History Archive Getty Images

Back in Europe, maps told a spiritual story instead of a geographic one.
Much like how Babylon's ancient map gave a glimpse into their worldview, the medieval mappa mundi, or world maps, show how Western Christendom perceived the world.

The Hereford Mappa Mundi, created around 1300 in England, is a fascinating peek into the medieval imagination.
Drawn on a huge piece of animal hide, it is the largest and most famous surviving world map from the middle ages.
The top depicts the Day of Judgment, one of many biblical scenes inked onto map, while images of wild beasts and fantastical monsters lurk on the edges of the world, representing the dangers of the unknown.

The Hereford Map represents the most common type of mappa mundi, the “T-O” map, so called because a “T” shape splits the world into three continents (Asia, Europe, and Africa) surrounded by an “O”-shaped ocean.

First described in the 7th century, T-O maps usually put Jerusalem at the center of the world and were oriented with east at the top, considered the holiest direction and the location of the Garden of Eden.
In fact, the term “orientation” comes from the Latin root oriens meaning “east.” To “orientate” a map meant placing east at the top, and it was the standard of European mapmaking for centuries.
But that was about to change.

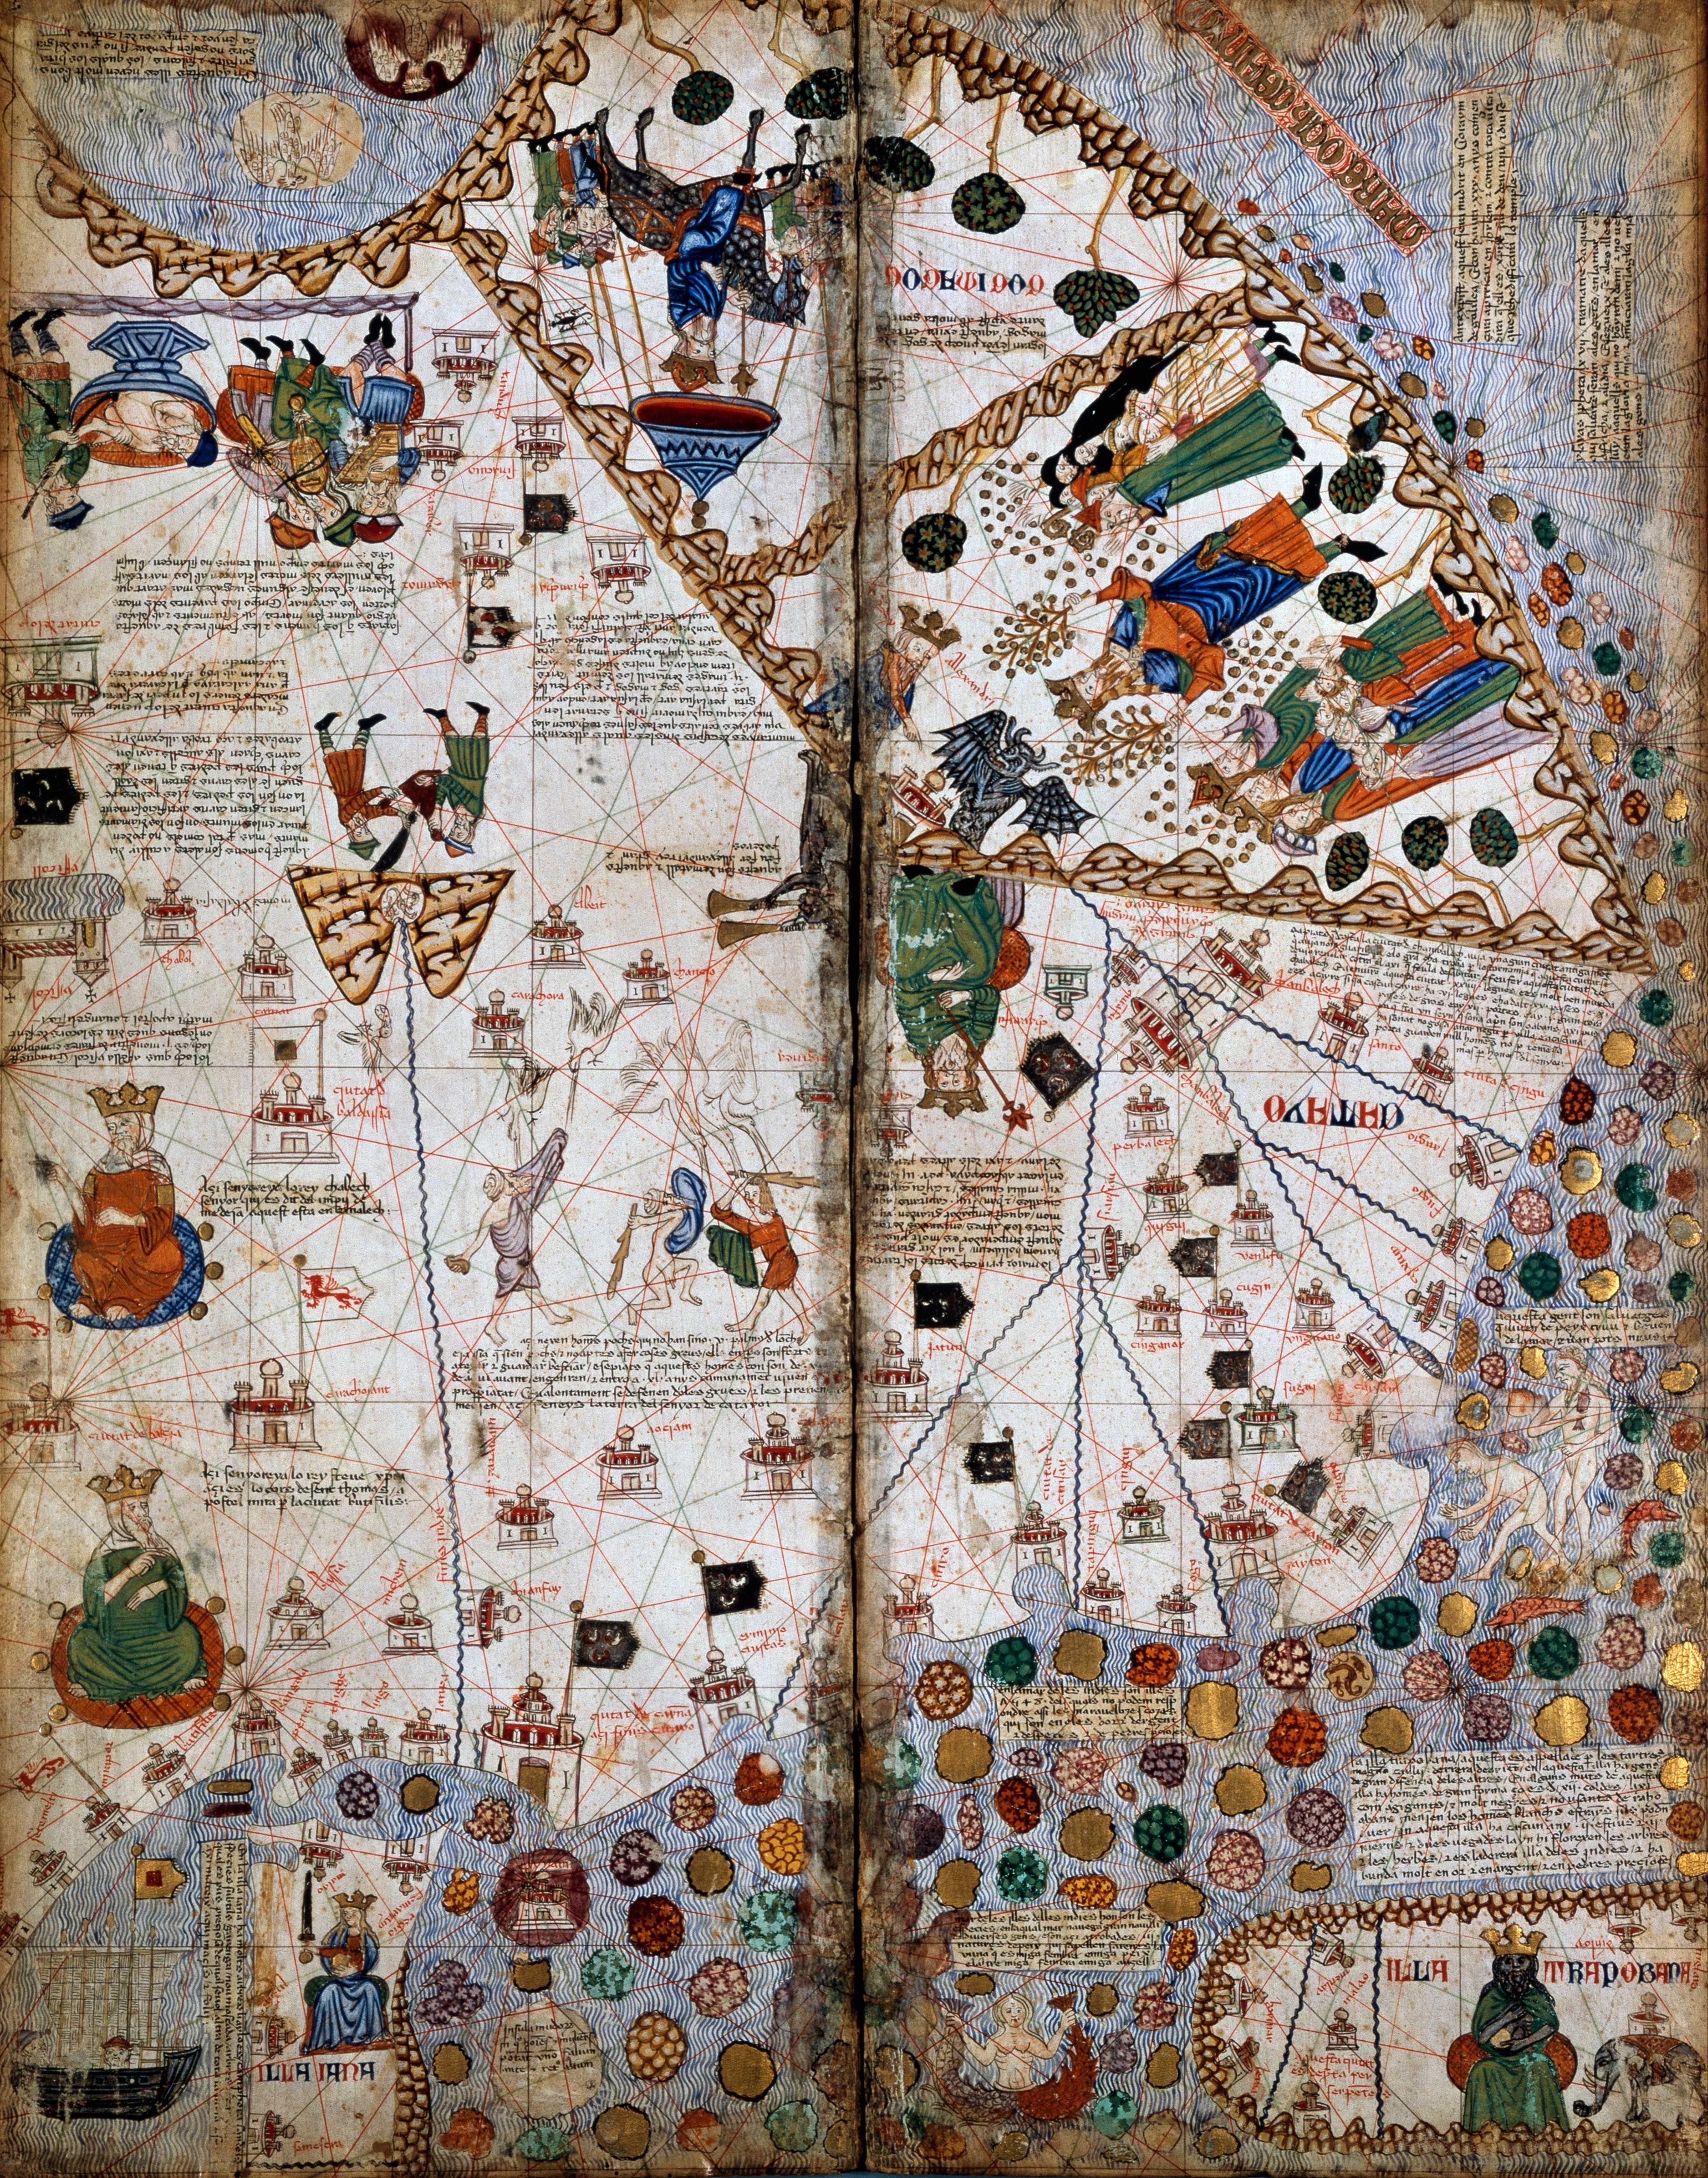
Navigation by compass : CATALAN ATLAS

The two far right pages of the Catalan Atlas (pictured) depict central and eastern Asia based on Marco Polo’s travels.
De Agostini Picture Library/Getty Images

Ancient sailors navigated the seas by keeping in sight of land and observing the sun and stars.
If clouds rolled in, they pulled in their sails and waited for better visibility.

The discovery of the compass—a magnetized needle on wood, floating in water, aligning itself with the magnetic poles—changed navigation.
Sailors could safely venture into the open sea without visual cues.
First mentioned in 11th century China, the compass spread along the Silk Road connecting the East and West, and with it, a new type of European map came into vogue, called a portolan chart.
These nautical maps were covered in crisscrossed lines indicating the bearing of trade routes between ports.
The oldest surviving example, the Carte Pisane, dating to 1290, charts the Mediterranean and Black Sea with enough accuracy that ships could navigate with it today.
But the most famous and expansive portolan map is the Catalan Atlas.
Drawn over eight pages of vellum in 1375 by Majorcan cartographer Cresques Abraham, it was the first world map to include the compass rose and stretched from the western edge of Europe and North Africa to China’s eastern coast.

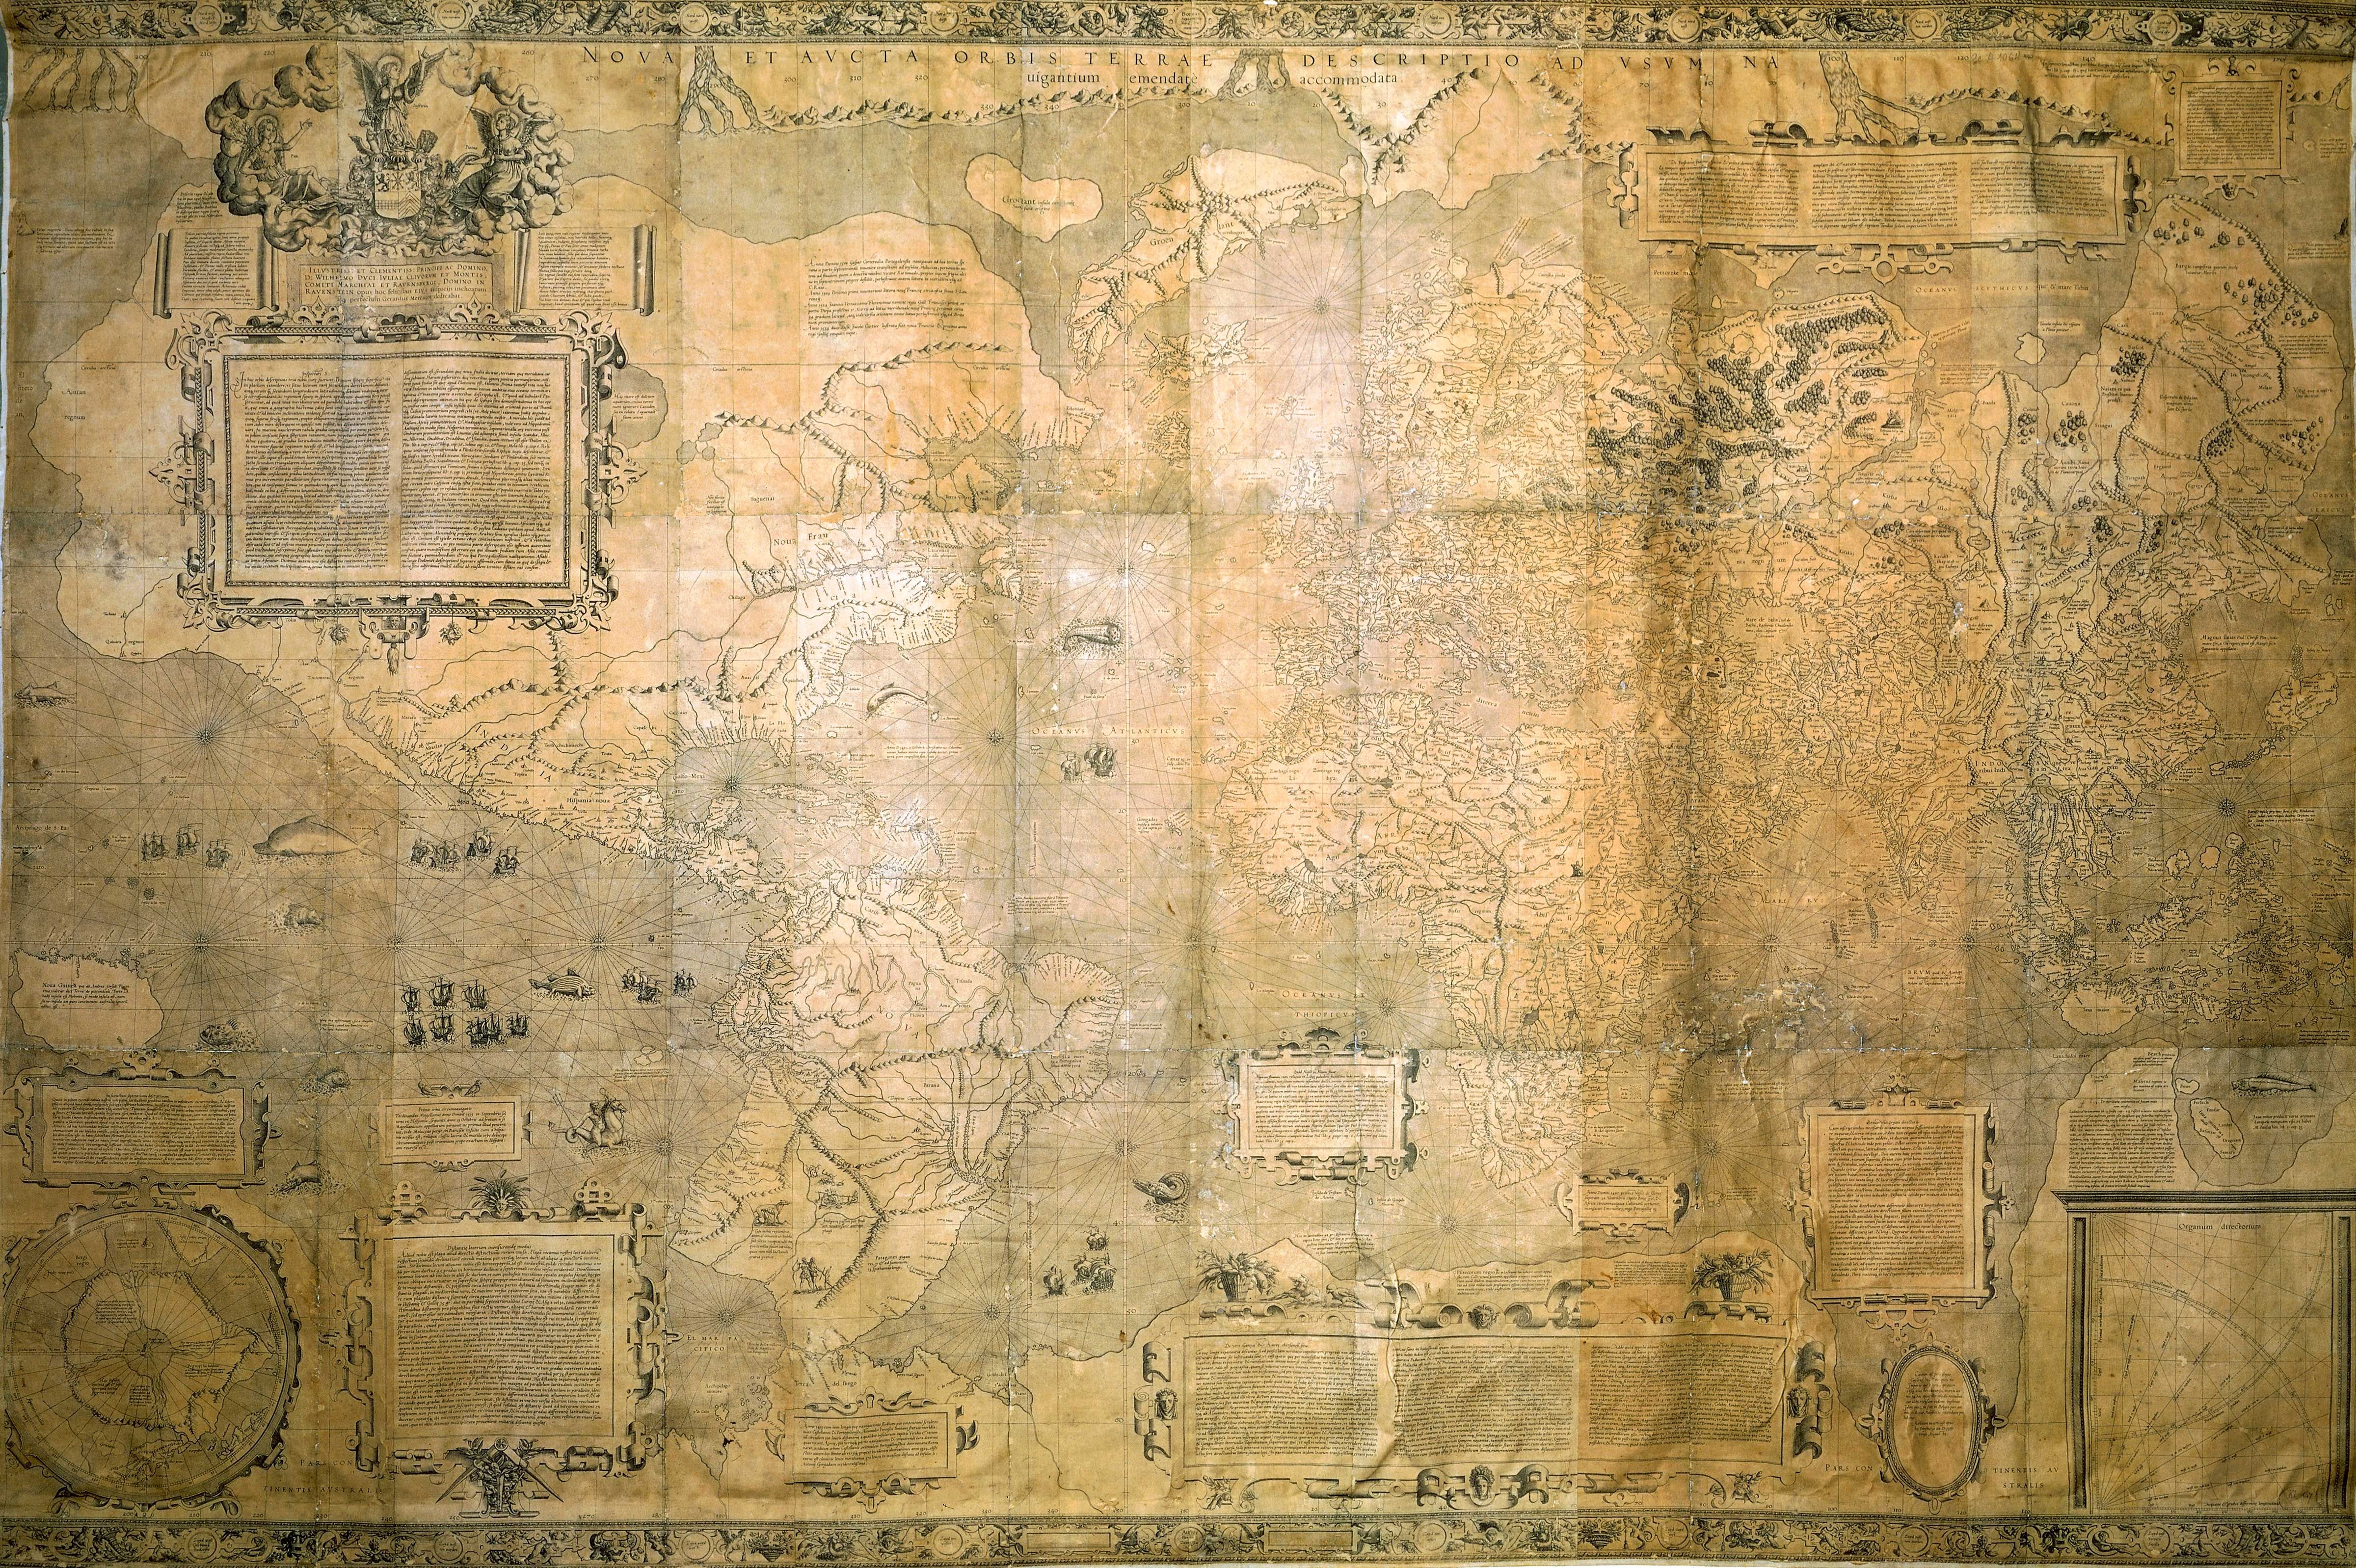
The first modern map : MERCATOR MAP OF THE WORLD

Mercator’s projection was inspired by the accuracy of portolan maps.
Dea Picture Library/De Agostini/Getty Images

The compass sparked a shift back to geographical maps made for practical navigation.
Religious symbolism defined most medieval European mapmaking.
(Maps could tell you the rough direction of Eden, but not how far away it was.) In the early 15th century, European monarchs began to explore the Atlantic and Indian Oceans in search of new trading routes to the East.
At the time, Ptolemy’s Geographia was translated into Latin, marking the start of a boom in exploration and mapmaking.

As the 16th century saw the most complete maps of the world, it also overcame one of the thorniest problems of cartography: how to navigate a spherical globe on a two-dimensional map.
Picture flattening an orange peel against a flat surface—it’s impossible to do so without distorting its shape.
Ptolemy had tackled this, but navigators still couldn’t achieve the simple task of plotting the shortest course between points on a map with a straight line.
In 1569, Flemish-German cartographer Gerardus Mercator solved this millennia-old problem with a new map projection: Earth as a cylinder, which unrolled to a square grid of latitude and longitude.
The projection spaced lines of latitude increasingly far apart as they got farther from the equator.
The disadvantage of this projection, which we still see today, is that it distorted landmasses toward the poles.
Eurasia and North America are enlarged, while regions at the equator, such as most of Africa, appear misleadingly small.

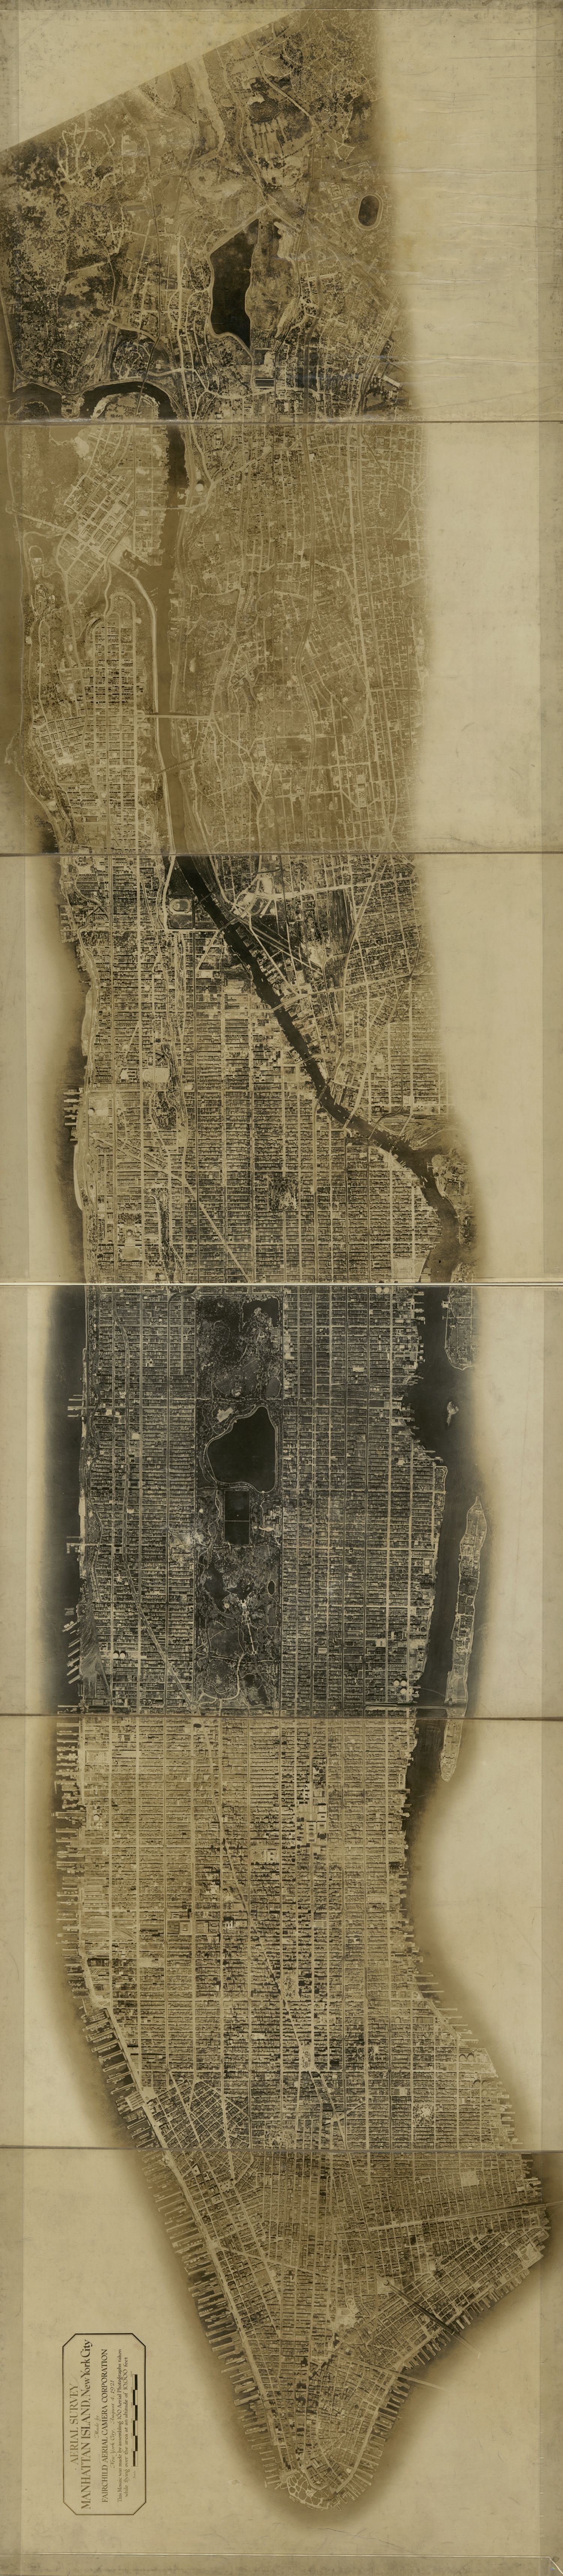
Mapping from above : AERIAL MAP OF MANHATTAN


Manhattan was Fairchild’s second first aerial survey.
His first, a map of Newark, New Jersey, failed to gain notice.
Library of Congress, Geography & Map Division

The first photograph taken from the air was shot from a 260-foot-high hot air balloon in 1858.
It was an inauspicious start—and that photo of a small French village was lost—but aviation would revolutionize mapmaking.
From above, a photograph could gather a huge amount of data at a time, a major improvement on labor-intensive ground surveys.

When World War I broke out, maps became powerful weapons.
A detailed trench map of the front line allowed for artillery bombardments to be carried out without practice shots, retaining the element of surprise.
After the war, aerial photography spread to civilian use and in 1921 the Fairchild Aerial Map of Manhattan ushered maps into pop culture consciousness.
New York City entrepreneur Sherman Fairchild, who had been developing new aerial photography techniques for World War I, introduced an aerial camera that automatically snapped photos and turned the roll of film at timed intervals.

Mounted under a war-surplus biplane flying 10,000 feet high over New York, the camera snapped photos of the city every 27 seconds over a 69-minute flight up and down the island.
The negatives were then overlapped to form the detailed Manhattan grid with a precision that set the standard for the next 50 years of aerial mapping.

The world, in your pocket : GOOGLE EARTH, MAPS, AND STREET VIEW

Visit Machu Picchu via Google Earth and hike the Inca Trail with Street View.
Courtesy Google Street View

The Cold War drove the next leaps in mapping technology.
The launch of Sputnik sparked the development of GPS when MIT scientists realized they could track the Soviet satellite from the ground by observing how its radio signal changed as it moved, and likewise, objects on Earth could be located based on their distance from satellites.

Early satellite navigation experiments were developed by the U.S. military to track intercontinental missiles in the 1960s.
And by the early 1970s, the military launched the first Global Positioning System, NAVSTAR, which could determine precise spatial coordinates for anywhere on Earth.
Today a full constellation of GPS satellites (about 27) circles the globe twice a day, transmitting radio signals.
When an object on Earth’s surface receives a signal from at least three satellites, its precise geographic coordinates can be determined within centimeters.
In 2000, the Department of Defense lifted its policy of degrading the accuracy of its GPS tracking for civilian use.
From the ensuing technology boom, Google emerged with a trio of products—Earth, Maps, and Street View—that together created the most complete world map.

Released in 2005, Google Earth provided an interactive, 3D image of the globe formed from millions of overlapping satellite photographs overlaid on a 3D digital earth.
Close-up 3D details are added from aerial images that capture the depth of buildings and terrain.

Started in 2006 with vans driving around six major U.S. cities with GPS sensors and multi-lens cameras mounted on top, Google Street View recreates the Earth from eye level.
In 2017 the Street View cameras were updated with laser scanners that record the dimensions and depth of the objects being photographed to create a 3D view along the way.
These cameras, aided by crowdsourced data and machine learning, have mapped millions of miles of roads across 87 countries on all seven continents.
Combined with Maps, Street View and Earth literally put the world in billions of people’s hands.
It is now possible to navigate and explore nearly anywhere on Earth—try Everest Base Camp or Rome’s Coliseum—with a click and zoom.

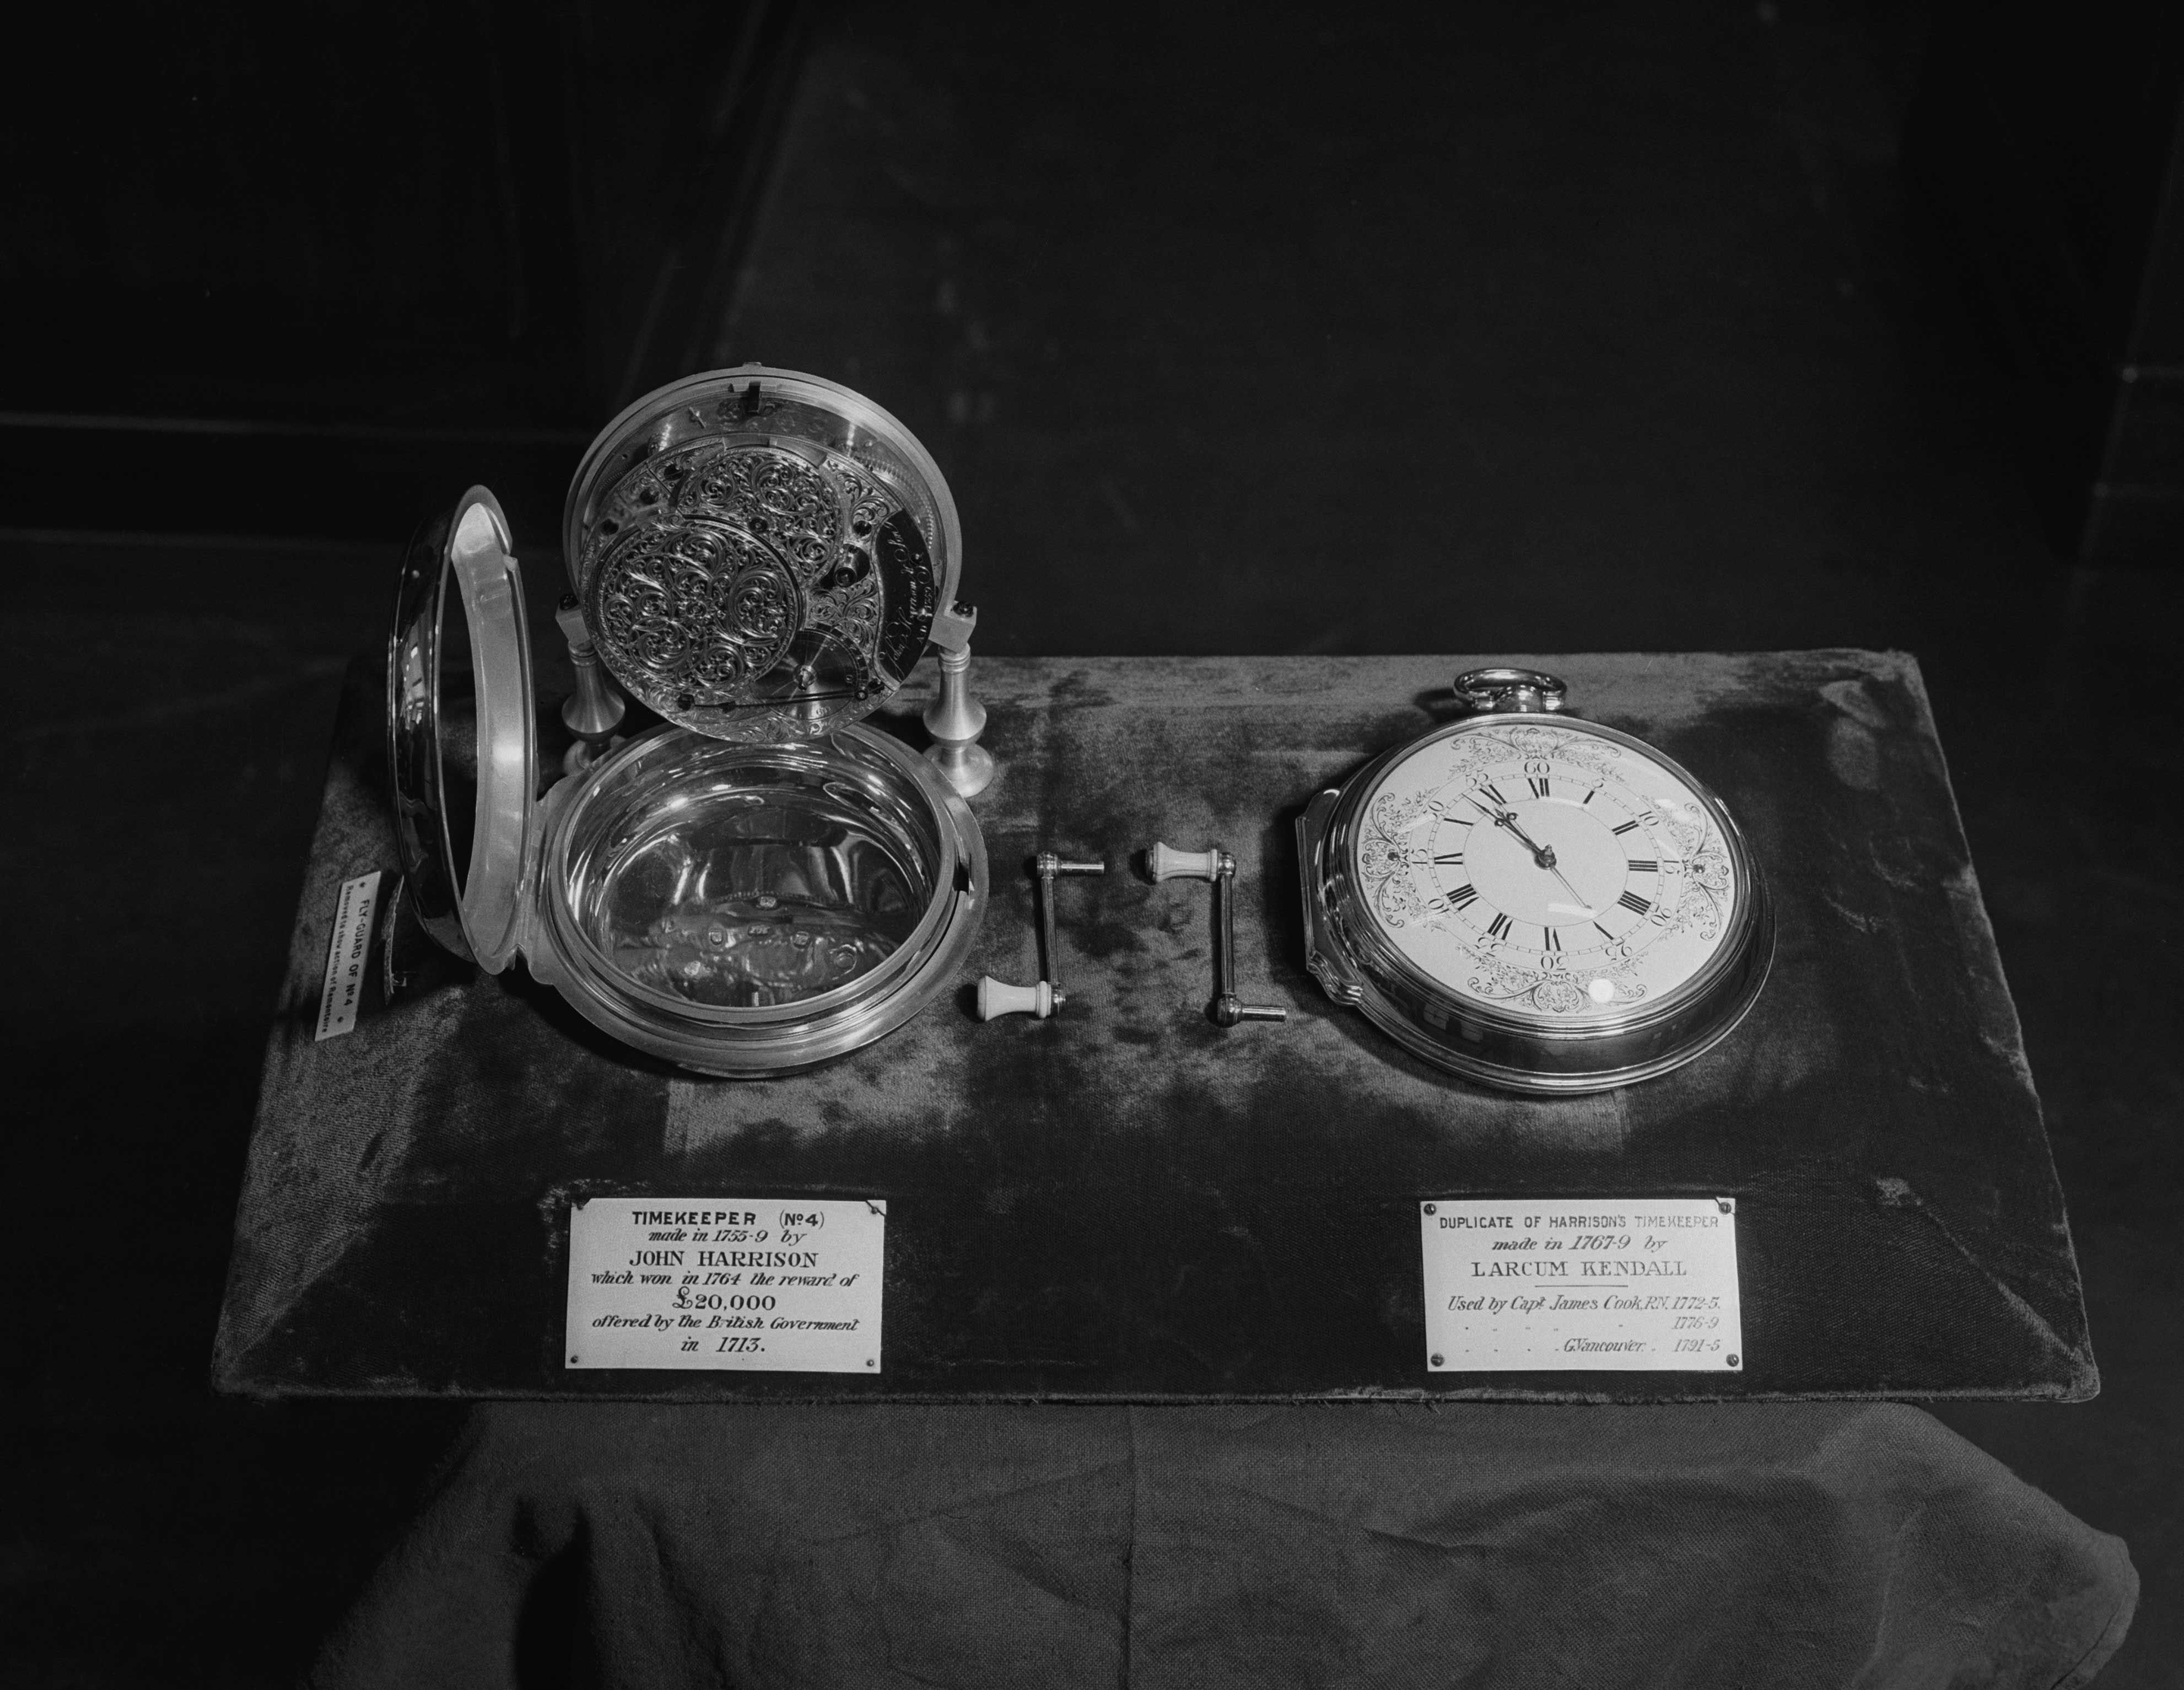
The Longitude Problem

In 1714, the English government offered a £20,000 reward (about £1.5 million today) to anyone who could solve a problem that had baffled scientists and sailors for centuries: how to determine longitude—distance to the east or west—at sea.

Since antiquity navigators had been able to find their latitude fairly easily using celestial navigation.
But knowing how far you’d traveled on the globe’s east-west axis also required knowing the time of day at a set location to compare to the local time of the ship (determined by the sun).
This required a clock to track that reference time, but the pendulum clocks of the era did not accurately keep time aboard a rocking ship.

It took until 1761, when self-taught English clockmaker finally cracked the longitude problem—to the approval of England's Board of Longitude—with a mechanical clock that could reliably keep time at sea.
Harrison spent 40 years of his life developing his revolutionary sea clock, called a marine chronometer.

Monty Fresco/Topical Press Agency/Hulton Archive/Getty Images

Having spent decades developing prototypes, Harrison had a breakthrough when he discovered that high frequency oscillations were more stable than larger clocks, so he shrunk the device to speed up the vibration—it ticked five times per second.
The new “sea watch” looked similar to a pocket watch, but it was far more accurate than any timekeeping device at the time.
In 1765, the high-tech device was tested on a transatlantic voyage to the West Indies and passed with flying colors.
The chronometer achieved an unheard of precision of one second per month, allowing the navigator, Harrison’s son, to predict his landfall within a single mile.
The chronometer eventually became the standard tool for navigators to find their longitude at sea, and it remained so until it was replaced with radio signals in the early 20th century.

Links :

Sunday, October 17, 2021

Great Lakes, acrylic on nautical chart

from renowned seascape impressionist Kerry Hallam
33 x 45.25 inches