National Geographic photographer Michaela Skovranova uncovers the beauty of Antarctica and inspires the everyday photographer.
Saturday, August 28, 2021
Friday, August 27, 2021
Can artificially altered clouds save the Great Barrier Reef?
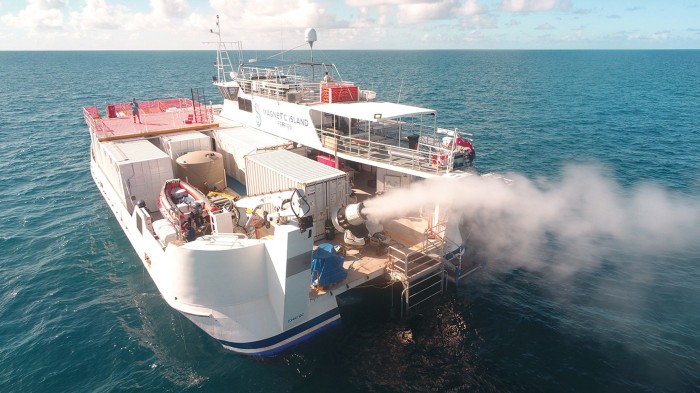
During a field trial, a turbine generates plumes of seawater droplets that rise into the sky.
Credit: Brendan Kelaher/SCU
From Nature by Jeff Tollefson
Australian scientists are rushing to develop new technologies — such as ways to block sunlight — to help preserve corals in the face of climate change.
Australian scientists are rushing to develop new technologies — such as ways to block sunlight — to help preserve corals in the face of climate change.
In place of its normal load of cars and vans, the repurposed ferry boat sported a mobile science laboratory and a large fan on its deck as it left Townsville, Australia, in March.
Researchers dropped anchor in a coral lagoon some 100 kilometres offshore and then fired up the cone-shaped turbine, which blew a mist of seawater off the back of the boat.
What happened next came as a welcome surprise: after briefly drifting along the ocean surface, the plume ascended into the sky.
Looking a bit like a jet engine, this mist machine is at the centre of an experiment that, if successful, could help to determine the future of the Great Barrier Reef.
Three-hundred and twenty nozzles spewed a cloud of nano-sized droplets engineered to brighten clouds and block sunlight — providing a bit of cooling shade for the coral colonies below.
Scientists used sensors aboard the ferry, drones and a second boat to monitor the plume as it migrated skyward.
The experiment wasn’t big enough to significantly alter the clouds.
But preliminary results from the field tests — which were shared exclusively with Nature — suggest that the technology might perform even better than computer models suggested it would, says Daniel Harrison, an oceanographer and engineer at Southern Cross University in Coffs Harbour, Australia, who is heading up the research.
“We are now very confident that we can get the particles up into the clouds,” Harrison says.
“But we still need to figure out how the clouds will respond.”
Harrison’s project is the world’s first field trial of marine cloud brightening, one of several controversial geoengineering technologies that scientists have studied in the laboratory for decades.
The research has been driven by fear that humans might one day be forced to deliberately manipulate the Earth’s climate and weather systems to blunt the most severe impacts of global warming.
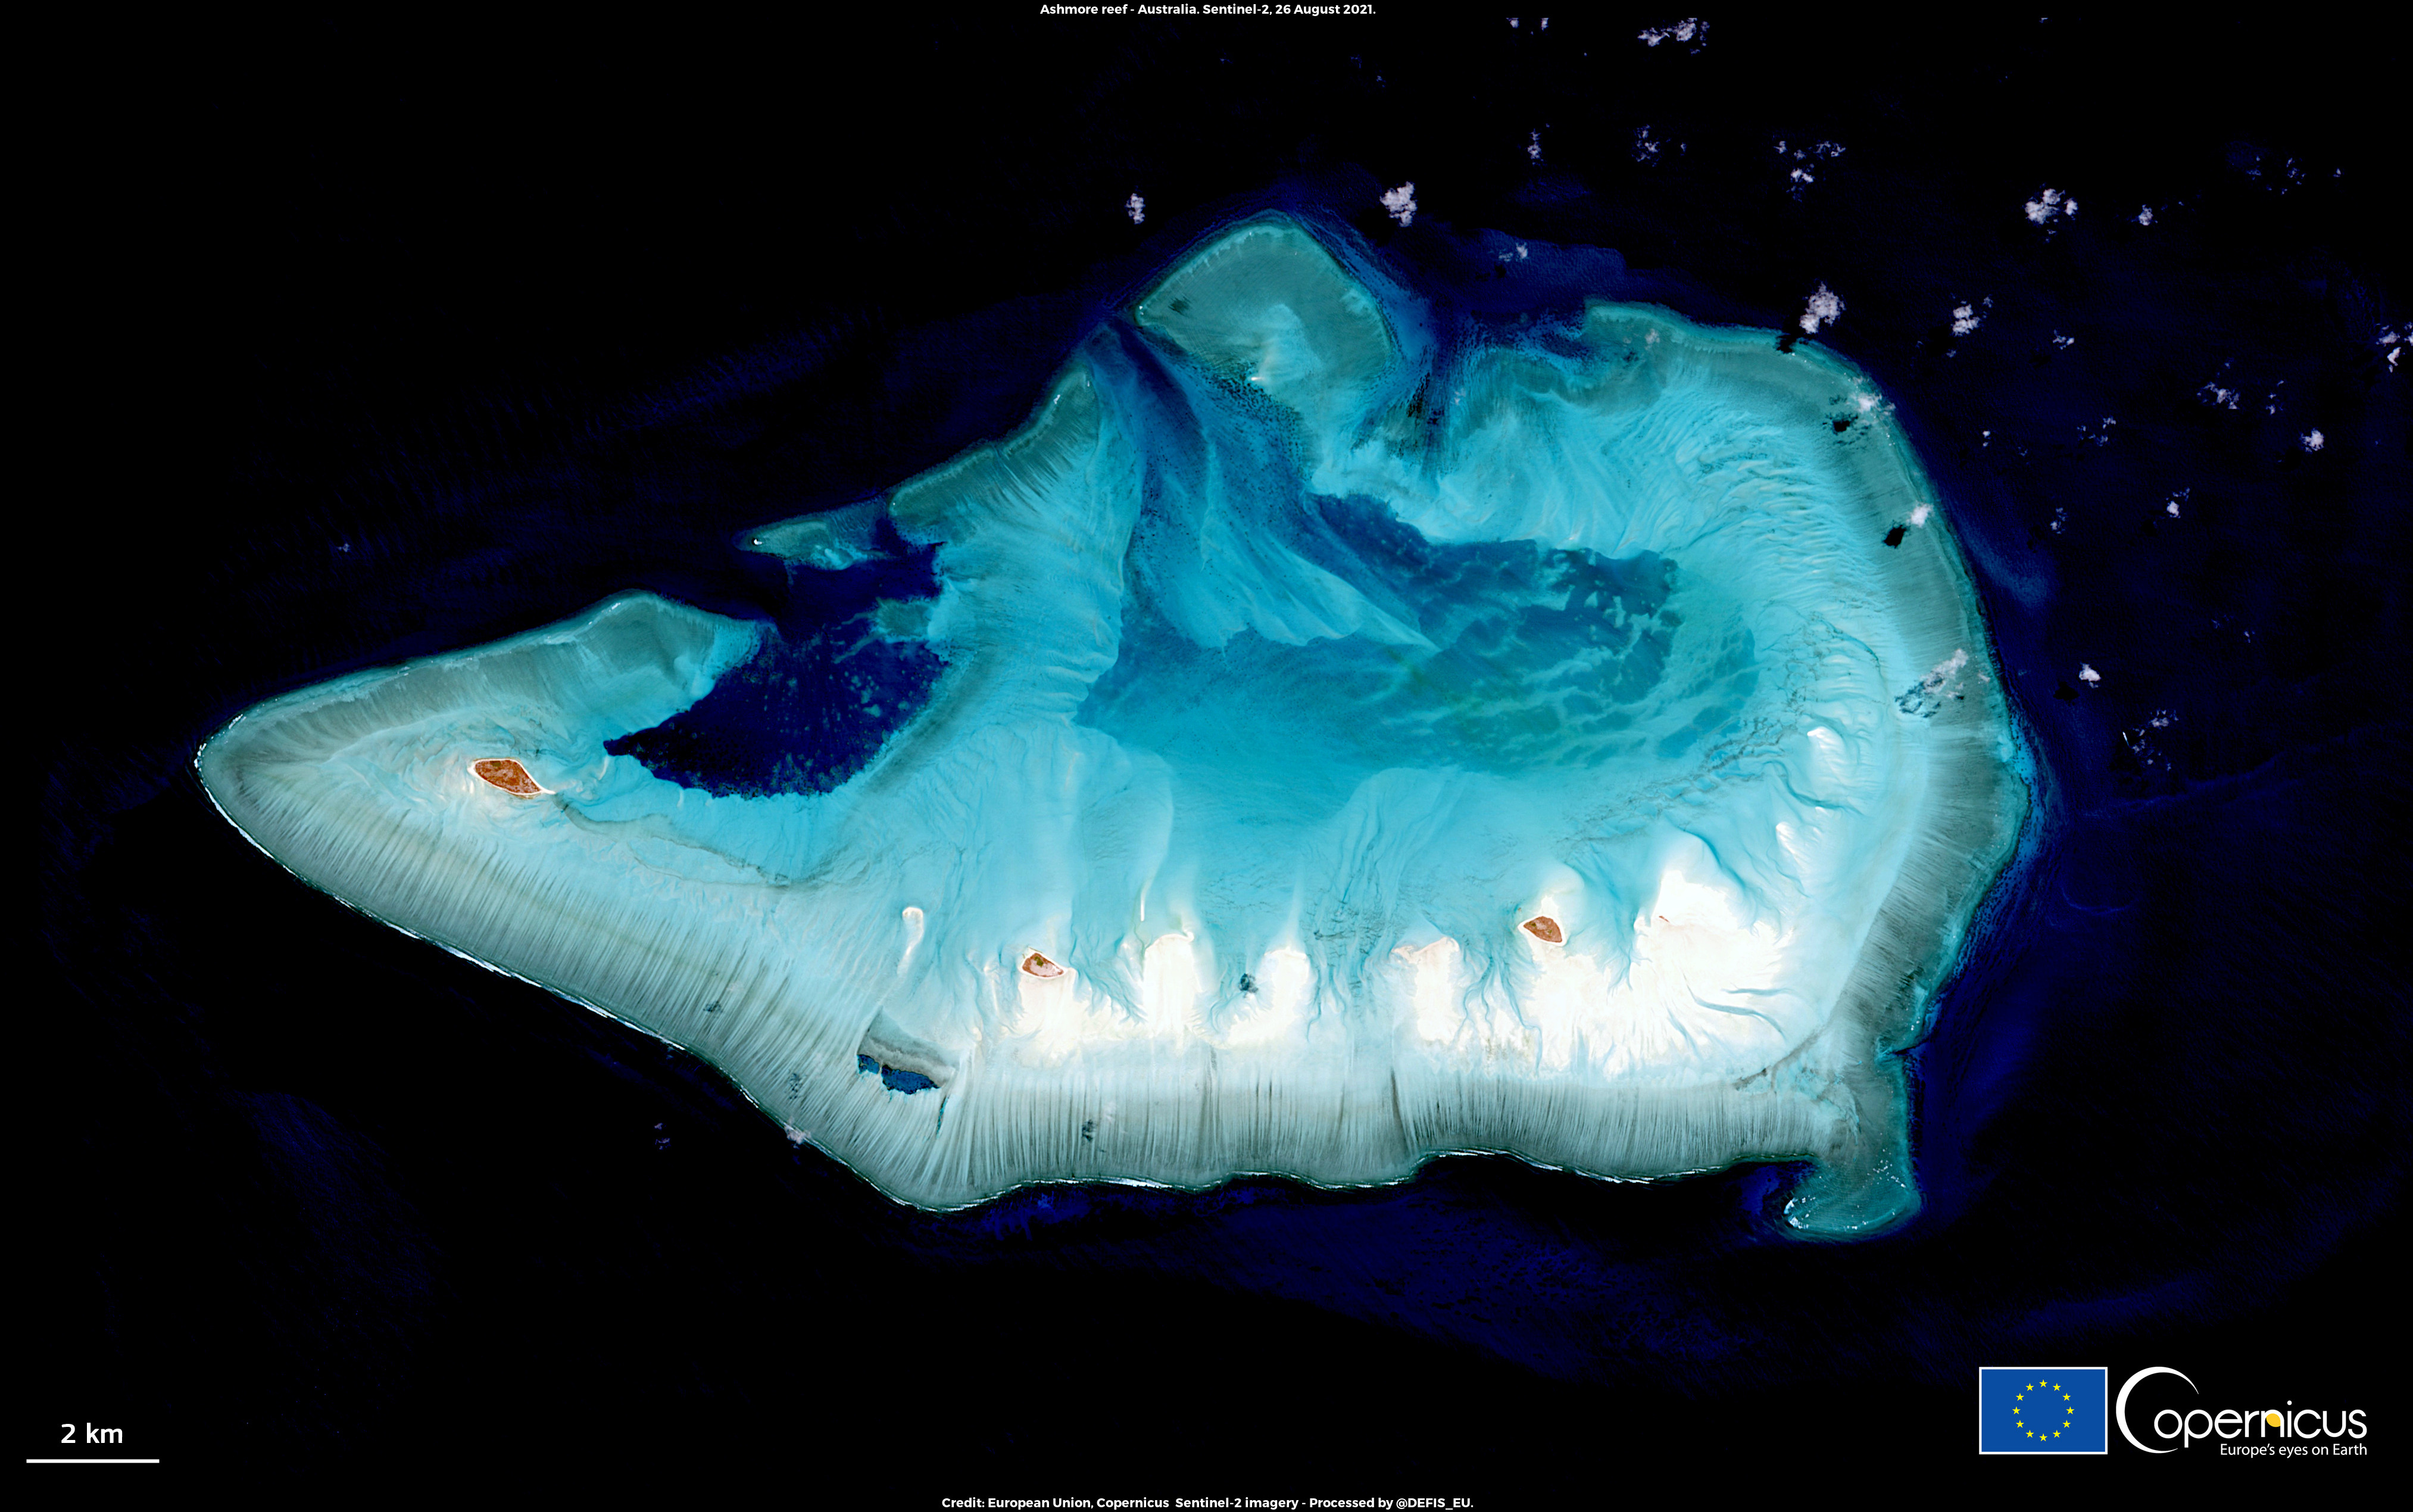
Coral reef systems are a key marine life habitat & a natural barrier against extreme weather, but they are endangered by Climate Change
For example, the coral biodiversity of Ashmore reef could fall sharply by 2100
For many Australians, that day arrived in 2017, when a marine heat wave spurred massive coral bleaching and death across much of the 2,300-kilometre Great Barrier Reef.
That crisis hit just a year after another bleaching event along the reef, which supports more than 600 species of coral and an estimated 64,000 jobs in industries such as tourism and fishing.
Research suggests that the reef lost more than half of its coral between 1995 and 2017, as a result of warming waters, tropical storms and predatory starfish (A.Dietzel et al. Proc. R. Soc. B. 287, 20201432; 2020).
The project has raised concerns among some scientists abroad, in part because the Australian group has published little about its work.
Environmentalists outside Australia objected to the project last year after news of the first trial broke, and there could be similar criticism when details of the 2021 trial emerge.
Harrison stresses that the cloud-brightening project is about local adaptation to climate change, not global geoengineering, because its application would be limited in both space and time.
It’s also just one part of a larger Aus$300 million (US$220 million) Reef Restoration and Adaptation Program (RRAP) launched last year by Australia to investigate and develop techniques and technologies to save the country’s reefs.
Many of the proposals, from cloud brightening to breeding heat-tolerant corals, would represent unprecedented human interventions in the natural reef system.
Ecological modelling suggests that a large-scale intervention involving multiple strategies — including a fleet of mist machines — could prolong the life of the reef while governments work to eliminate greenhouse-gas emissions.
The goal now is to work out what’s achievable in the real world, says Cedric Robillot, executive director of the RRAP.
“You need to consider every angle, from the fundamental science to the very pointy end of engineering, if you want to succeed,” Robillot says.
“It’s not enough to just prove you could do it. You need to explain how you would do it.”
Into the clouds
Harrison conducted his first field test in March 2020: a three-day proof-of-concept expedition on a small car ferry with four scientists, one representative from a local Indigenous group, and two shipping containers for equipment and sleeping quarters.
The team had a minimal Aus$400,000 budget and limited scientific instrumentation to monitor the mist, but it was enough to document that the plume flowing out of their mist machine rode a draught of warm air high into the sky.
It was the first time they had witnessed this phenomenon.
Their models had suggested that evaporation of the brine droplets would cool the plume, which would then float across the surface of the ocean, only slowly mixing upwards into the low-lying marine clouds.
The models also indicated a risk that the tiny droplets might merge and drop out of the air.
Instead, brine droplets floated along the surface of the ocean for half a kilometre without coalescing, gradually losing water and weight to evaporation along the way.
And then they shot upwards.
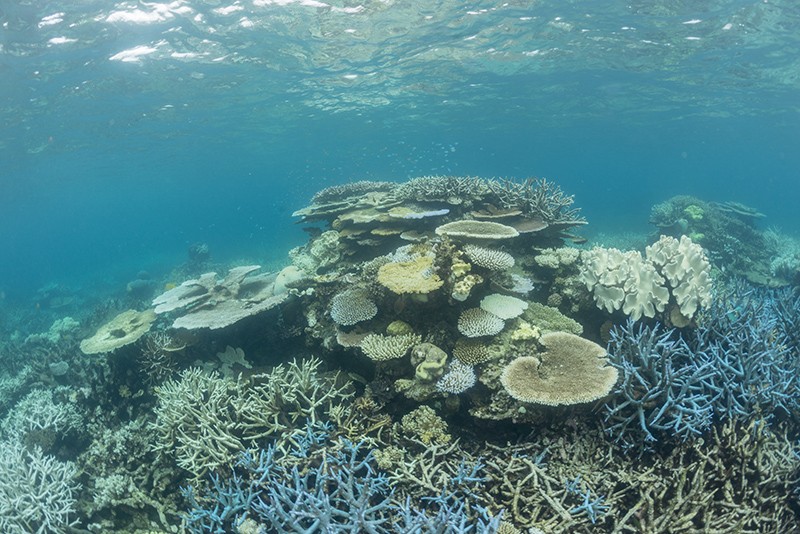
A marine heat wave in 2017 caused coral bleaching along much of Australia’s Great Barrier Reef.
Credit: Juergen Freund/Nature Picture Library
“We didn’t expect that at all,” Harrison says, “but it turned out we were doing this experiment in the middle of a rising air mass.”
The scientists feared it was a fluke.
Although years of research and development have gone into the nozzles, initially led by a separate American team, this was the first time anybody had ever deployed them in the field with fresh seawater.
The team also didn’t know what to expect from clouds and aerosols in that region, because research on the reef has focused almost exclusively on what happens below the water, not the conditions above.
For Harrison, the 2020 experiment was more than enough to justify moving forward with another, larger trial in March 2021.
But it did raise eyebrows among some scientists and observers abroad, where geoengineering research has met strong opposition and struggled to attract funding.
Most of the concern has centred on a form of solar geoengineering that involves injecting reflective material into the stratosphere to block sunlight at a global scale.
But cloud brightening has also been studied as a potential global intervention, and it has attracted criticism from some environmental groups who argue that it carries inevitable ecological risks and detracts from efforts to limit greenhouse gases.
Some scientists, as well as environmental advocates who follow geoengineering research, told Nature that they were surprised to see the experiment move forward without more scrutiny — or without published research to justify such an investment.
Critics also worry that Australia is setting the wrong kind of precedent by rebranding a solar-geoengineering experiment that could have regional impacts as a local adaptation project.
“One could say that there should have been some level of consultation with the outside world,” says Janos Pasztor, who heads the Carnegie Climate Governance Initiative, an advocacy group in New York City that has been pushing for a global debate over geoengineering governance in the United Nations.
Harrison says scientists in the programme have consulted with regulatory authorities, as well as with the general public and Indigenous groups that have historic claims on the reef.
He also readily acknowledges trying to avoid getting embroiled in a debate about solar geoengineering, arguing that the project would be more akin to cloud-seeding operations that are designed to promote rain and that are not considered to be geoengineering.
One of the next modelling efforts, however, will be to explore any potential regional and global implications, he says.
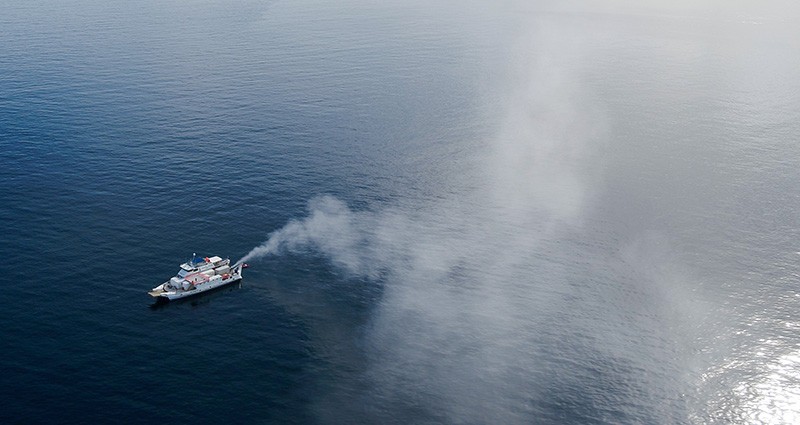
A plume of seawater droplets rises up into the sky during a field trial in March 2021.
Credit: Brendan Kelaher/SCU
Others question the Australian government’s motivations in funding such work.
Under the conservative prime minister Scott Morrison, the government has yet to strengthen its climate pledge under the 2015 Paris agreement, as many nations have done in the past year.
Morrison has personally ruled out committing to net-zero emissions.
Pushing for a technological fix to global warming without moving to aggressively curb greenhouse gases is “sheer lunacy”, says Peter Frumhoff, chief climate scientist for the Union of Concerned Scientists, an advocacy group in Cambridge, Massachusetts.
Some researchers, however, are pleased to see marine cloud brightening move from theory to the field, including US scientists working on a similar project that has been struggling to get into the field for nearly a decade.
“This is an early example of how climate disruption can drive interest in these things,” says Sarah Doherty, an atmospheric physicist who manages the Marine Cloud Brightening Project at the University of Washington in Seattle.
Members of the team provided the initial nozzle design and have been tracking the Australian group’s progress.
Coral crisis
The first time that scientists observed a major bleaching event along the Great Barrier Reef was in 1998, and the second event followed four years later.
In both cases, corals expelled the algae that live within them and that provide colour and energy through photosynthesis.
Most of the corals eventually recovered.
But in 2016 and 2017, many corals bleached and then died across two-thirds of the reef.
“It was absolutely horrifying,” says David Wachenfeld, chief scientist at the Great Barrier Reef Marine Park Authority, which manages the reef.
The clear message from those events was that the traditional approach to managing corals and coral reefs would not be enough, he adds.
“Our hand was forced.”
In 2018, the Australian government allocated Aus$6 million to a consortium of universities and government research institutes for a feasibility study focused on potentially radical strategies that could be applied across the reef.
Researchers reviewed some 160 ideas, including putting live corals on ice for long-term preservation and synthetically engineeering new varieties that can tolerate the warmer waters.
Many approaches proved too costly and energy intensive, but 43 interventions were singled out for further study.
Marine cloud brightening drew support in part because it theoretically provides direct relief precisely when and where corals need it most.
Much of the emphasis of the programme is on helping corals to adapt and repopulate the reef, including efforts to improve coral aquaculture operations so that they can produce millions of corals per year rather than thousands.
For Madeleine van Oppen, a coral geneticist at the Australian Institute of Marine Science near Townsville, the RRAP programme helps to integrate her team’s work on assisting coral evolution to make them more heat tolerant.
Thanks to the RRAP, she says, data from those projects are now being fed directly into models that enable researchers to assess the potential benefits — as well as the risks — of releasing new strains of coral and microalga into the wild.
The programme is also raising ecological questions, such as whether the introduction of new coral species can propagate disease, or whether a new variety of more heat-tolerant corals might displace corals struggling to survive.

Researchers are testing specialized nozzles that create jets of seawater mist.Credit: Alejandro Tagliafico/SCU
“It sort of speeds up the whole path from research to implementation in the field,” says van Oppen.
In the long run, the models indicate that without interventions, the extent of coral on the reef could shrink by well over 60% by 2070 compared with 2020 levels (S.A.Condie et al.R.Soc.Open Sci.8, 201296; 2021).
But simulations suggest that Australia could cut those losses in half with a three-pronged approach focused on propagating heat-tolerant corals, controlling outbreaks of the predatory crown-of-thorns starfish and brightening clouds to take the edge off of heat waves.
Crucially, the latest modelling also suggests that without the cooling provided by Harrison’s cloud brightening project, the other interventions might not amount to much.
Testing the wind
When Harrison’s group returned to the field this year, they had more-powerful drones as well as other aerosol sensors on a second boat.
As in the previous year’s experiment, each time they created a plume, it rose into the sky after the droplets lost around 90% of their water to evaporation.
The likely explanation, Harrison says, is that the reef is creating its own weather as warm water along the shallow corals heats the air above.
Many more droplets are making it into the clouds than the scientists had initially calculated, but Harrison says their mist machine might need to be scaled up by a factor of 10 — from 320 to around 3,000 nozzles — to produce enough particles to brighten nearby clouds by around 30%.
His team’s modelling suggests that this could in turn reduce the incoming solar radiation on the reef locally by around 6.5%.
Even then, the operation would require 800–1,000 stations to cover the length of the Great Barrier Reef.
But it’s unclear whether that spray of salty droplets will have the desired effect, says Lynn Russell, an atmospheric chemist at the Scripps Institution of Oceanography in La Jolla, California, who has studied cloud brightening.
Russell has not seen the latest — and as-yet unpublished — results, but questions whether there are enough of the low layered clouds considered suitable for cloud brightening.
Harrison acknowledges such concerns and says that his team sees more of these clouds on the southern part of the reef.
His team’s modelling suggests the technology will also work on the clouds that are common across the rest of the reef in summer.
Even then, he says, it remains unclear how much coverage a full-scale cloud-brightening operation could provide across the entirety of the reef.
More measurements, and detailed modelling, are needed to provide answers.
For now, Harrison has secured funding for another two years, and he needs to demonstrate progress.
The RRAP is testing all 43 approaches and will redistribute resources to projects that show potential, Robillot says.
But he stresses that no amount of science and engineering will preserve the reef in its current form.
“Even if we do all of this, the system that you’ll end up with is not going to be the Great Barrier Reef that we know today,” Robillot says.
“You might, however, retain a very functional ecosystem.”
That’s enough to keep Harrison going, and his team is already preparing for a trip into the field in 2022.
The scientists plan to run the mist machine at higher pressure, which should produce a sixfold increase in the number of particles, and they will use new instrumentation to determine how particles alter clouds.
They are also investigating an entirely different nozzle technology that could reduce the number of nozzles needed by a factor of 1,000.
Harrison is more confident today than he was even a year ago that cloud brightening might work over the reef, but he is also realistic about the future if governments fail to limit carbon emissions.
“There are only so many clouds available, and there is only so much you can brighten them,” he says.
“Eventually, climate change just overwhelms things.”
Thursday, August 26, 2021
Electronic Navigational Charts: an update and some issues

From Marinelink by Tom Ewing
In November 2019, the Office of Coast Survey (OCS), part of the National Oceanic and Atmospheric Administration (NOAA), announced the start of a five-year program to “sunset” all raster and paper nautical charts.
NOAA has produced electronic navigational charts (ENCs) since 1993.
In the 2019 notice, NOAA writes that “ENC sales increased 425% since 2008, while sales of paper charts are now half of 2008 levels.”
For NOAA and mariners, a focus on electronic charts and publications promises many advantages.
With a singular focus, NOAA can use its resources more efficiently.
Mariners will get higher quality, more informative charts, eventually building to a library with over 9,000 ENCs.
And importantly, paper charts will still be available via a new NOAA web-based Custom Chart application.
Users can define scale and paper size and selected positioning.
Notes and other marginalia appear on separate PDF pages.
The app is now available as Version 1 and, even better, development is ongoing and two-way: via NOAA’s web page a user can comment on the app’s good points and ideas for improvement.
The huge increases in demand for ENCs surely indicate support among users.
That doesn’t mean, though, that there are no questions with the sunsetting project.
In a heavily regulated industry, one basic concern for mariners is, yes, NOAA makes the charts, but the U.S. Coast Guard (USCG) makes the rules.

NOAA RNC in the GeoGarageGeoGarage platform
Is the Coast Guard on board with NOAA’s e-chart initiative?
To a large extent, yes.
In May 2020, the USCG issued a Navigation and Vessel Inspection Circular (NVIC, No. 01-16 (CH-2)) updating its “use of electronic charts and publications in lieu of paper charts, maps and publications.”
The NVIC states that, because of technology advancements, “the Coast Guard now considers most electronic devices to be capable of meeting the ‘ready reference’ timeframe by which a ready-reference paper version on board a vessel would be available.”
The NVIC states further that “the Coast Guard sees no significant safety barriers preventing vessels from accessing voyage planning navigational information via the internet on an as-needed basis, versus keeping a publication or extract on board.
”The USCG writes of “encouraging the use of electronic voyage planning products.”
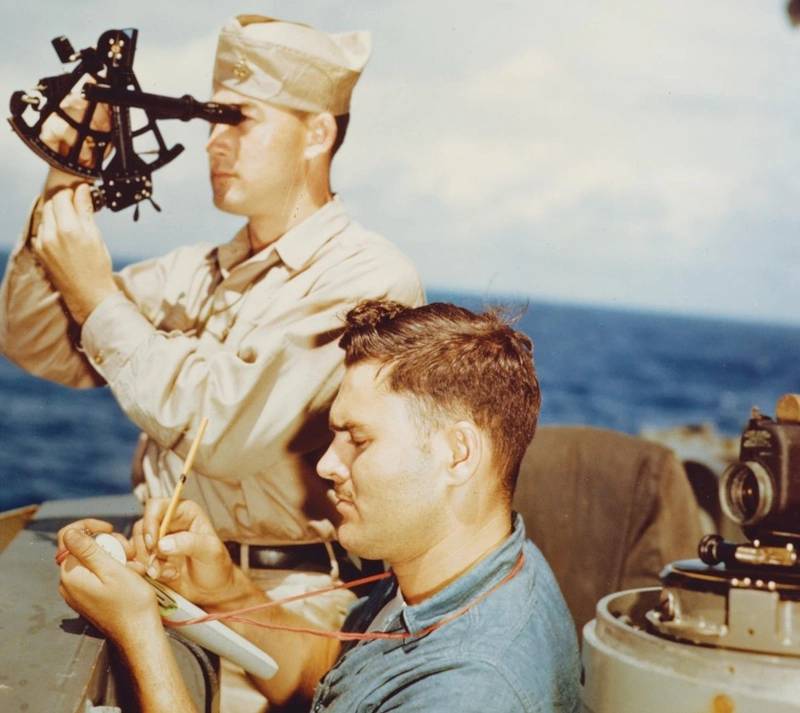 A quartermaster takes a sun sighting from the navigation bridge of the USS Alaska (CB-1) in 1945.
 (U.S.NAVAL INSTITUTE PHOTO ARCHIVE. Used with permission.)
Since 2019, the sunsetting process has made significant strides across a number of fronts.
In April and May the Agency held two webinars to explain and update the e-chart process.
Earlier, in February, it announced the end of work on its first paper chart, for Lake Tahoe, paper chart 18665.
That means that starting in August, an electronic navigational chart will be the only NOAA nautical chart of the area.
The notification about Lake Tahoe was included in the USCG’s Local Notice to Mariners (LNM).
Going forward, that’s the venue that will be used for future end-of-paper announcements.
NOAA does not have a specific schedule or set of criteria for how it will progress with the sunset.
Rather, changes will proceed when certain conditions develop.
These include:
- Availability of new, larger-scale, reschemed ENC coverage;
- New depth or shoreline data;
- Low chart sales; and,
- Some regional cancellations, especially if all or most of a particular chart's adjoining, similar-scale chart coverage is canceled.
Again, to stay current on sunsetting, watch Local Notices.
Plus, NOAA’s website has a List of Latest Editions webpage tracking map and chart sunsets.
NOAA’s transition plan was to incorporate stakeholder comments and concerns which would help guide the sunsetting process.
What did people say to NOAA?
That’s hard to tell directly because NOAA did not make this a public docket.
“We wanted responders to be candid and forthright with their feedback and posting them publicly would discourage that,” explained Julia Powell, Chief of the Navigation Services Division, Office of Coast Survey.
NOAA received more than 430 comments, Powell said.
About 70% were from recreational boaters, 20% from professional mariners, and the remaining from other sources, such as maritime educational institutions and other government agencies.
Over half of the comments supported the continuation of paper charts, especially as backup for e-charts.
Powell added that there were “several comments” conveying “satisfaction with the use of NOAA ENCs and the advantages of focusing efforts on improving this digital chart product.”
Regarding the many references to keeping paper charts, Powell emphasized that the e-chart move still makes paper charts accessible via the new NOAA Custom Chart app.
Overall, the project is on schedule.
“We fully expect to complete the process of canceling all traditional paper and raster nautical chart products by Jan 2025,” Powell said.
With no access to public comments, it’s hard to assess industry’s top concerns and suggestions and whether that information is influencing implementation.
As with all big projects, there are outstanding issues and unanswered questions.
Maybe the biggest question: is the USCG a participant in the sunsetting project, or standing by as an observer? Yes, NVIC 01-16 is a critical document.
But it wasn’t issued as part of NOAA’s sunsetting.
During NOAA’s recent webinars, questions came up about NOAA and USCG teamwork.
One participant asked, for example, about USCG-approved custom POD (print on demand) charts.
NOAA’s reply: “That is a good question for which we don't have an answer.
We are looking into what it would take to make a carriage compliant, NOAA custom chart.”
Another person asked about petroleum transport and charting.
NOAA’s reply was a general reference to NVIC 01-16.
NOAA added that the Coast Guard is “presently working on preliminary steps that will result in new regulations related to the use of electronic navigational charts,” likely ready in about a year.
In response to a question about the Light List NOAA mentioned a NOAA-CG effort at “harmonization,” underway now, pertaining to updated waterway references.
NOAA’s 2019 Sunsetting document tells that NOAA and the Coast Guard are “currently discussing if and what paper chart carriage the USCG may have in the future.”
Those discussions are ongoing.
After one question NOAA staff remarked that the webinar attendee list included several participants from the Coast Guard.
Hopefully, NOAA’s staff commented, “they will take note of (the) question.”
With a new program, nobody expects all the answers at start up.
But regulated businesses, facing inspection and enforcement, want to avoid policy zigs and zags and conflicting timelines.
In fact, e-chart development seems active on a number of fronts – “harmonization,” new carriage allowances – not just the sunsetting process.
People expect interagency teamwork.

ENCs view

RNC view of the same area
In 2020, the American Waterways Operators, sent comments to NOAA on sunsetting.
AWO suggested that NOAA “strategically sequence” the transition from paper to ENC products “for those (companies) that need or choose to use them to meet US Coast Guard navigation carriage requirements.”
Another suggestion was retaining the option to purchase traditional paper charts “until the Custom Chart application is fully tested, functional and operational.”
A third major concern is more complicated.
AWO notes that some of its members would prefer ENCs.
However, AWO writes, “current Coast Guard policy regarding chart carriage requirements effectively prevents them from doing so.
We would like to bring these issues to your attention and ask for NOAA’s support to resolve them.”
At issue is text within the CG’s NVIC 01-16 directing that, “If any part of the vessel’s intended voyage is seaward of the territorial sea baseline (as defined by 33 CFR 2.20), then the display system must be tested against and meet the International Electrotechnical Committee’s Maritime Navigation and Radiocommunication Equipment and Systems Standard (IEC 60945) or be a Radio Technical Commission for Maritime Services Electronic Chart System.”
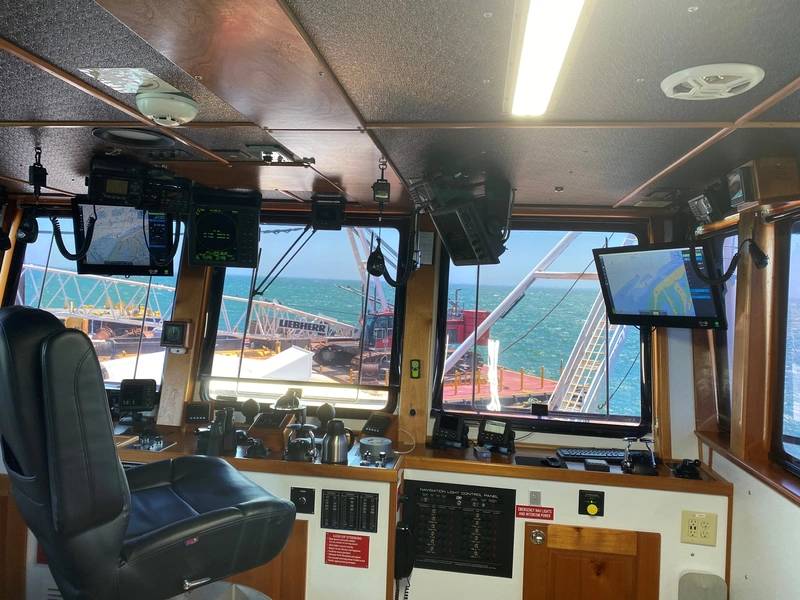
A Weeks Marine vessel with Rose Point ECS displayed on two Hatteland Technology Panel PCs
(Photo: Rose Point Navigation Systems)
As mariners know, a person could swim past the territorial sea baseline.
Coastal vessels then, and this is also an issue in the Great Lakes, as required by NVIC 01-16, need computer equipment meeting the IEC standard, which is tough, and expensive, reportedly costing as much as $5,000 per unit.
If a company owns 10 vessels, do the math.
But that’s not all.
The USCG requires a backup.
The cost could double if a duplicate IEC-standard system is required, which, seems likely, if there are no paper charts that comply with Coast Guard regs.

NOAA RNC displayed in IOS movile app W4D
In contrast, vessels staying inside the sea baseline can use any hardware to display ENCs, e.g., a laptop issued by the IT team purchased on Amazon or at Staples.
AWO writes that, “For members operating domestically in the coastal sector, ECDIS is the only ENC display system the Coast Guard will accept for vessels that transit outside the territorial sea baseline.
Between equipment, installation and subscription costs, and the costs of specialized crew training, an ECDIS can cost up to tens of thousands of dollars.”
Hardly an incentive to jump onto NOAA’s sunsetting.
AWO writes that it wants to work with the CG to find “practical options” and it asks NOAA’s “assistance to resolve these issues.”
In an update, Caitlyn Stewart, AWO’s VP, Regulatory Affairs, said that NOAA and USCG staff have emphasized to AWO that the two agencies are coordinating their efforts regarding e-charts.
With Lake Tahoe, for example, Stewart said the Coast Guard is reportedly working on “bridging guidance” for Lake Tahoe users subject to carriage requirements.
Additionally, the USCG advised AWO that the agency is working on new rules regarding ENCs and coastal operations.
Hopefully, these important discussions become public sooner, not later.
Maybe NOAA and the Coast Guard can work separately, but mariners can’t.
Silos bad.
Teamwork good.
Links :
- GeoGarage blog : Rescheming and improving Electronic Navigational Charts / A nautical tradition fades with transition from printed to electronic charts / NOAA seeks public comment on ending production of traditional paper nautical charts / A nautical tradition fades with transition from printed to electronic charts / Nautical chart smarts
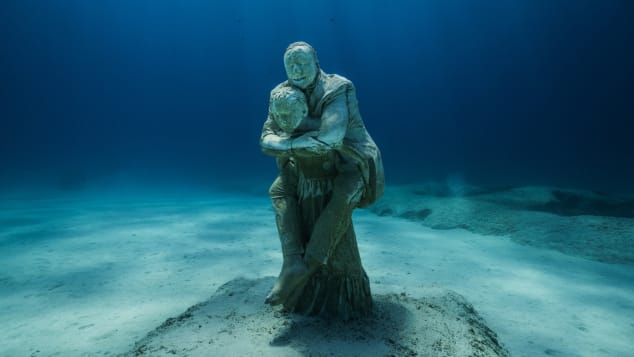
The underwater forest growing in the Med
The Museum of Underwater Sculpture in Cyprus features 93 sculptures by Jason deCaires Taylor.
MUSAN/@JasondeCairesTaylor
MUSAN/@JasondeCairesTaylor
From CNN by Tamara Hardingham-Gill
The artist behind the world's first underwater sculpture park has just unveiled his latest subaquatic project -- a spectacular sunken forest located off the coast of Pernera beach in Ayia Napa, Cyprus.
The artist behind the world's first underwater sculpture park has just unveiled his latest subaquatic project -- a spectacular sunken forest located off the coast of Pernera beach in Ayia Napa, Cyprus.
The Museum of Underwater Sculpture in Cyprus (Musan), which cost €1 million ($1.1 million) to bring to life, is made up of 93 sculptures by Jason deCaires Taylor, whose previous work includes the Molinere Bay Underwater Sculpture Park in Grenada and Mexico's Isla Mujeres National Marine Park.
Taylor aims to put the spotlight on "rewilding our natural spaces" and "reforesting areas of barren habitat" through the installation, which explores the relationship between man and nature.
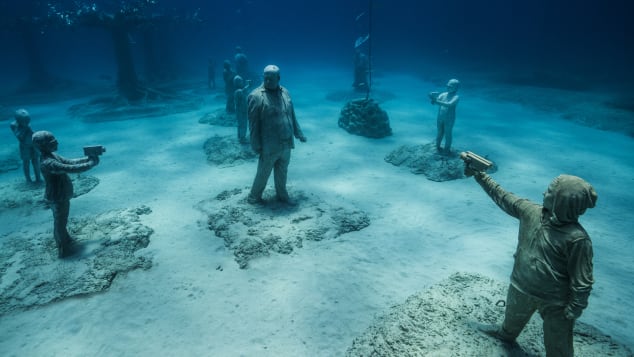
Human impact
Some of the figures featured include huge trees weighing up to 13 tons as well as children pointing cameras at shapes depicting the human race while playing hide and seek.
"I tried to incorporate as many references to climate change and habitat loss and pollution as I could, because those are really the defining issues of our era," Taylor tells CNN Travel.
"I'm kind of hoping that it leaves the visitor with a sense of hope along with a sense that the human impact isn't always negative.
That we can reverse some of the things we've done.
"But I also hope that it instills some other messages about holding genes and corporations responsible.
It's really about safeguarding the future of the younger generation."
Each of the sculptures, which were lowered below the surface by crane, were made with inert pH neutral materials that attract marine life and have been placed at different depths, so that the biodiversity of the area may be "enriched" by their presence over time.
Submerged art
The evocative installation explores the relationship between man and nature.
MUSAN/Costas Constantinou
MUSAN/Costas Constantinou
"They're designed to sort of let natural growth settle on the substrate," explains Taylor.
"After five or six days, I could already see a thin film of algae on each of the heads of the sculptures, which have these quite complex habitat areas, and they were already full with little juvenile fish.
"So that was very, very encouraging.
I'm really looking forward to going back in a couple of months time and seeing how it aggregates marine life."
Taylor spent two to three years working on Musan, which had been due to open last year, but the launch was delayed due to the global pandemic.
"We started building the project in Cyprus in March last year," says Taylor.
"So we probably chose the worst time possible.
"We had a lot of difficulties with changing flights, organizing materials and moving everything.
It's certainly been one of the most challenging projects that I've ever done."
Related contentJapan's Ocean Spiral proposed as giant underwater city
Challenging project
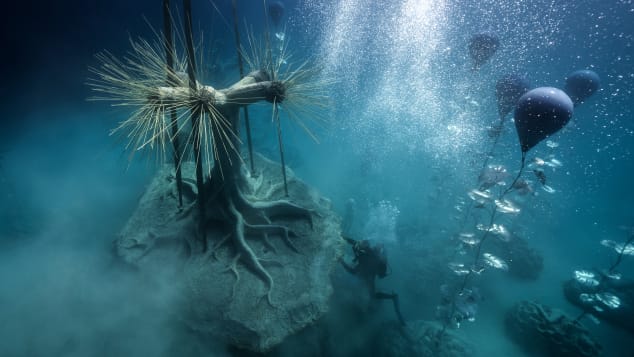
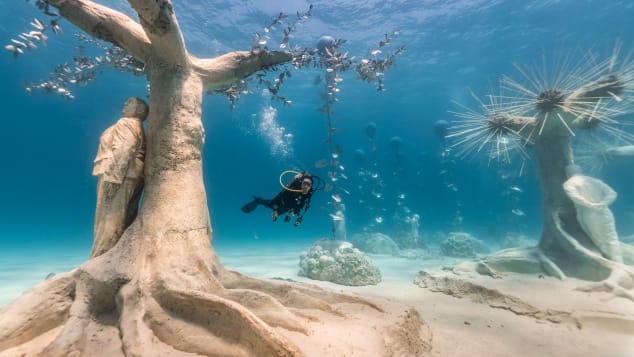
The underwater forest is located off the coast of Pernera beach in Ayia Napa, Cyprus.
MUSAN/@JasondeCairesTaylor
MUSAN/@JasondeCairesTaylor
The museum actually begins on land, with a physical entrance on Pernera beach and a pathway leading towards a descent point with a floating platform that leads down to the submerged sculptures.
Musan is accessible to both divers and snorkelers, and Taylor hopes that it will lure more visitors to this marine protected area of Cyprus, which he describes as having "some of the best visibility I've ever been in."
"It's obviously very different from other places," he explains.
"It's not a tropical region, where we have coral reefs and all the habitat that that brings, it's more of a temperate area.
"So it will attract different species of marine life, and it's one of the first pieces I've done where the works go from the seabed up to the sea surface, with floating elements.
"The floating trees move quite a lot in the current -- they go very, very close to the surface."
Related contentDiving into the past: The Black divers searching for slave shipwrecks
Living visual experience

MUSAN/Costas Constantinou
One of the sculptures have been strategically placed so that it's looking out onto the barren stretch of sand along the waters of the Mediterranean, considered the world's most over fished sea.
"It's meant to convey that we need to look after these protected areas massively and we need to talk about policing them in a much, much tighter way," he adds.
Musan is a joint collaboration between the Department of Fisheries and Marine Research, the Ayia Napa municipality and the Ministry of Tourism.
"The underwater museum will be a living visual and ecological experience, with works of art interacting with nature and evolving over time," Marina Argyrou, director of the Department of Fisheries and Marine Research said during a statement at the launch of the project last month.
Environmental art
Taylor hopes to put the focus on "re-wilding our natural spaces" and "re-reforesting areas of barren habitat".
MUSAN/@JasondeCairesTaylor
MUSAN/@JasondeCairesTaylor
"And I'm certain it will bring people closer to the marine environment and the conservation and protection of our marine ecosystem."
Visits to the museum can be booked via local dive centers.
Taylor's work is primarily focused on promoting ocean conservation and highlighting the impact of climate change.
He's currently working on new exhibits for Australia's Museum of Underwater Art in Townsville, northern Queensland on the Great Barrier Reef, which has lost half of its corals over the past two decades, as well as a future exhibit to be based in the Red Sea.
Taylor says he's also been in talks with the Grenadian government about the possibility of creating some new underwater installation on the island where he launched his first such project back in 2006.
The artist launched an underwater museum consisting of six portrait sculptures weighing around 10 tons in France near Cannes earlier this year.
Links :
- GeoGarage blog : Transcendent underwater sculpture acting as artificial reefs
Wednesday, August 25, 2021
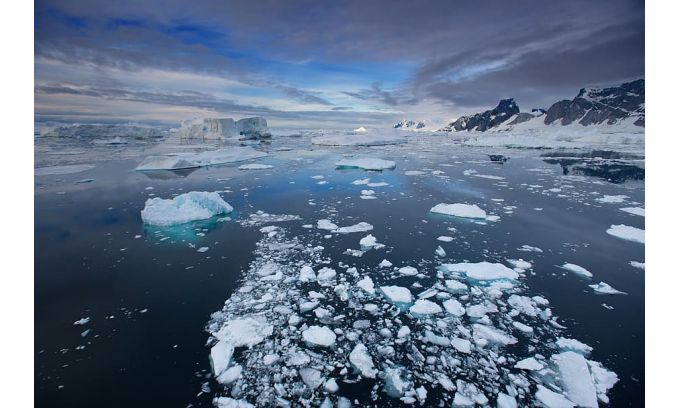
How the seafloor of the Antarctic Ocean is changing ...and the climate is following suit
From Hydro
Experts have reconstructed the depth of the Southern Ocean at key phases in the last 34 million years of the Antarctic’s climate history.
The glacial history of the Antarctic is currently one of the most important topics in climate research.
Why? Because worsening climate change raises a key question: How did the ice masses of the southern continent react to changes between cold and warm phases in the past, and how will they do so in the future? A team of international experts, led by geophysicists from the Alfred Wegener Institute, Helmholtz Centre for Polar and Marine Research (AWI), has now shed new light on nine pivotal intervals in the climate history of the Antarctic, spread over 34 million years, by reconstructing the depth of the Southern Ocean in each one.
These new maps offer insights into the past courses of ocean currents, for example, and show that, in past warm phases, the large ice sheets of East Antarctica reacted to climate change in a similar way to how ice sheets in West Antarctica are doing so today.
The maps and the freely available article have just been released in the online journal Geochemistry, Geophysics, Geosystems, a publication of the American Geological Union.
The Southern Ocean is one of the most important pillars of the Earth’s climate system.
Its Antarctic Circumpolar Current, the most powerful current on the planet, links the Pacific, Atlantic and Indian Oceans, and has effectively isolated the Antarctic continent and its ice masses from the rest of the world for over 30 million years.
Then and now, ocean currents can only flow where the water is sufficiently deep and there are no obstacles such as land bridges, islands, underwater ridges and plateaus blocking their way.
Accordingly, anyone seeking to understand the climate history and glacial history of the Antarctic needs to know exactly what the depth and surface structures of the Southern Ocean’s floor looked like in the distant past.
Researchers around the globe can now find this information in new, high-resolution grid maps of the ocean floor and data-modelling approaches prepared by a team of international experts led by geoscientists from the AWI, which cover nine pivotal intervals in the climate history of the Antarctic.
“In the course of the Earth’s history, the geography of the Southern Ocean has constantly changed, as continental plates collided or drifted apart, ridges and seamounts formed, ice masses shoved deposited sediments across the continental shelves like bulldozers, and meltwater transported sediment from land to sea,” says AWI geophysicist and co-author Dr Karsten Gohl.
Each process changed the ocean’s depth and, in some cases, the currents.
The new grid maps clearly show how the surface structure of the ocean floor evolved over 34 million years – at a resolution of ca.
5 x 5 kilometres per pixel, making them 15 times more precise than previous models.Southern Ocean 2.65 million years ago – transition from the Pliocene to the Pleistocene.

40 Years of Geoscientific Research in the Antarctic
In order to reconstruct the past water depths, the experts gathered geoscientific field data from 40 years of Antarctic research, which they then combined in a computer model of the Southern Ocean’s seafloor.
The basis consisted of seismic profiles gathered during over 150 geoscientific expeditions and which, when put end-to-end, cover half a million kilometres.
In seismic reflection, sound waves are emitted, penetrating the seafloor to a depth of several kilometres.
The reflected signal is used to produce an image of the stratified sediment layers below the surface – a bit like cutting a piece of cake, which reveals the individual layers.
The experts then compared the identified layers with sediment cores from the corresponding regions, which allowed them to determine the ages of most layers.
In a final step, they used a computer model to ‘turn back time’ and calculate which sediment deposits were already present in the Southern Ocean at specific intervals, and to what depths in the seafloor they extended in the respective epochs.
 Antarctic ocean (1890)
see AAD
Turning Points in the Climate History
They applied this approach to nine key intervals in the Antarctic’s climate history, including the warm phase of the early Pliocene, five million years ago, which is widely considered to be a potential template for our future climate.
Back then, the world was 2 to 3 degrees Celsius warmer on average than today, partly because the carbon dioxide concentration in the atmosphere was as high as 450 ppm (parts per million).
The IPCC (IPCC Special Report on the Ocean and Cryosphere in a Changing Climate, 2019) has cited this concentration as the best-case scenario for the year 2100; in June 2019, the level was 415 ppm.
Back then, the Antarctic ice shelves now floating on the ocean had most likely completely collapsed.
“Based on the sediment deposits we can tell, for example, that in extremely warm epochs like the Pliocene, the large ice sheets in East Antarctica reacted in a very similar way to what we’re currently seeing in ice sheets in West Antarctica,” reports Dr Katharina Hochmuth, the study’s first author and a former AWI geophysicist, who is now conducting research at the University of Leicester, UK.
Accordingly, the new maps provide data on important climatic conditions that researchers around the world need in order to accurately simulate the development of ice masses in their ice-sheet and climate models, and to produce more reliable forecasts.
Researchers can also download the corresponding datasets from the AWI’s Earth system database PANGAEA.
Links :
- The Guardian : Antarctica: an ecosystem under threat - in pictures
Tuesday, August 24, 2021
Bedrock modernizes seafloor mapping with autonomous sub and cloud-based data

Image Credits: Bedrock
From Techcrunch by devin Coldeway
The push for renewable energy has brought offshore wind power to the forefront of many an energy company’s agenda, and that means taking a very close look at the ocean floor where the installations are to go.
The push for renewable energy has brought offshore wind power to the forefront of many an energy company’s agenda, and that means taking a very close look at the ocean floor where the installations are to go.
Fortunately Bedrock is here to drag that mapping process into the 21st century with its autonomous underwater vehicle and modern cloud-based data service.
The company aims to replace the standard “big ship with a big sonar” approach with a faster, smarter, more modern service, letting companies spin up regular super-accurate seafloor imagery as easily as they might spin up a few servers to host their website.
“We believe we’re the first cloud-native platform for seafloor data,” said Anthony DiMare, CEO and cofounder (with CTO Charlie Chiau) of Bedrock.
“This is a big data problem — how would you design the systems to support that solution? We make it a modern data service, instead of like a huge marine operation — you’re not tied to this massive piece of infrastructure floating in the water. Everything from the way we move sonars around the ocean to the way we deliver the data to engineers has been rethought.”
The product Bedrock provides customers is high-resolution maps of the seafloor, made available via Mosaic, a familiar web service that does all the analysis and hosting for you — a big step forward for an industry where “data migration” still means “shipping a box of hard drives.”
Normally, DiMare explained, this data was collected, processed, and stored on the ships themselves.
Since they were designed to do everything from harbor inspections to deep sea surveys, they couldn’t count on having a decent internet connection, and the data is useless in its raw form.
Like any other bulky data, it needs to be visualized and put in context.
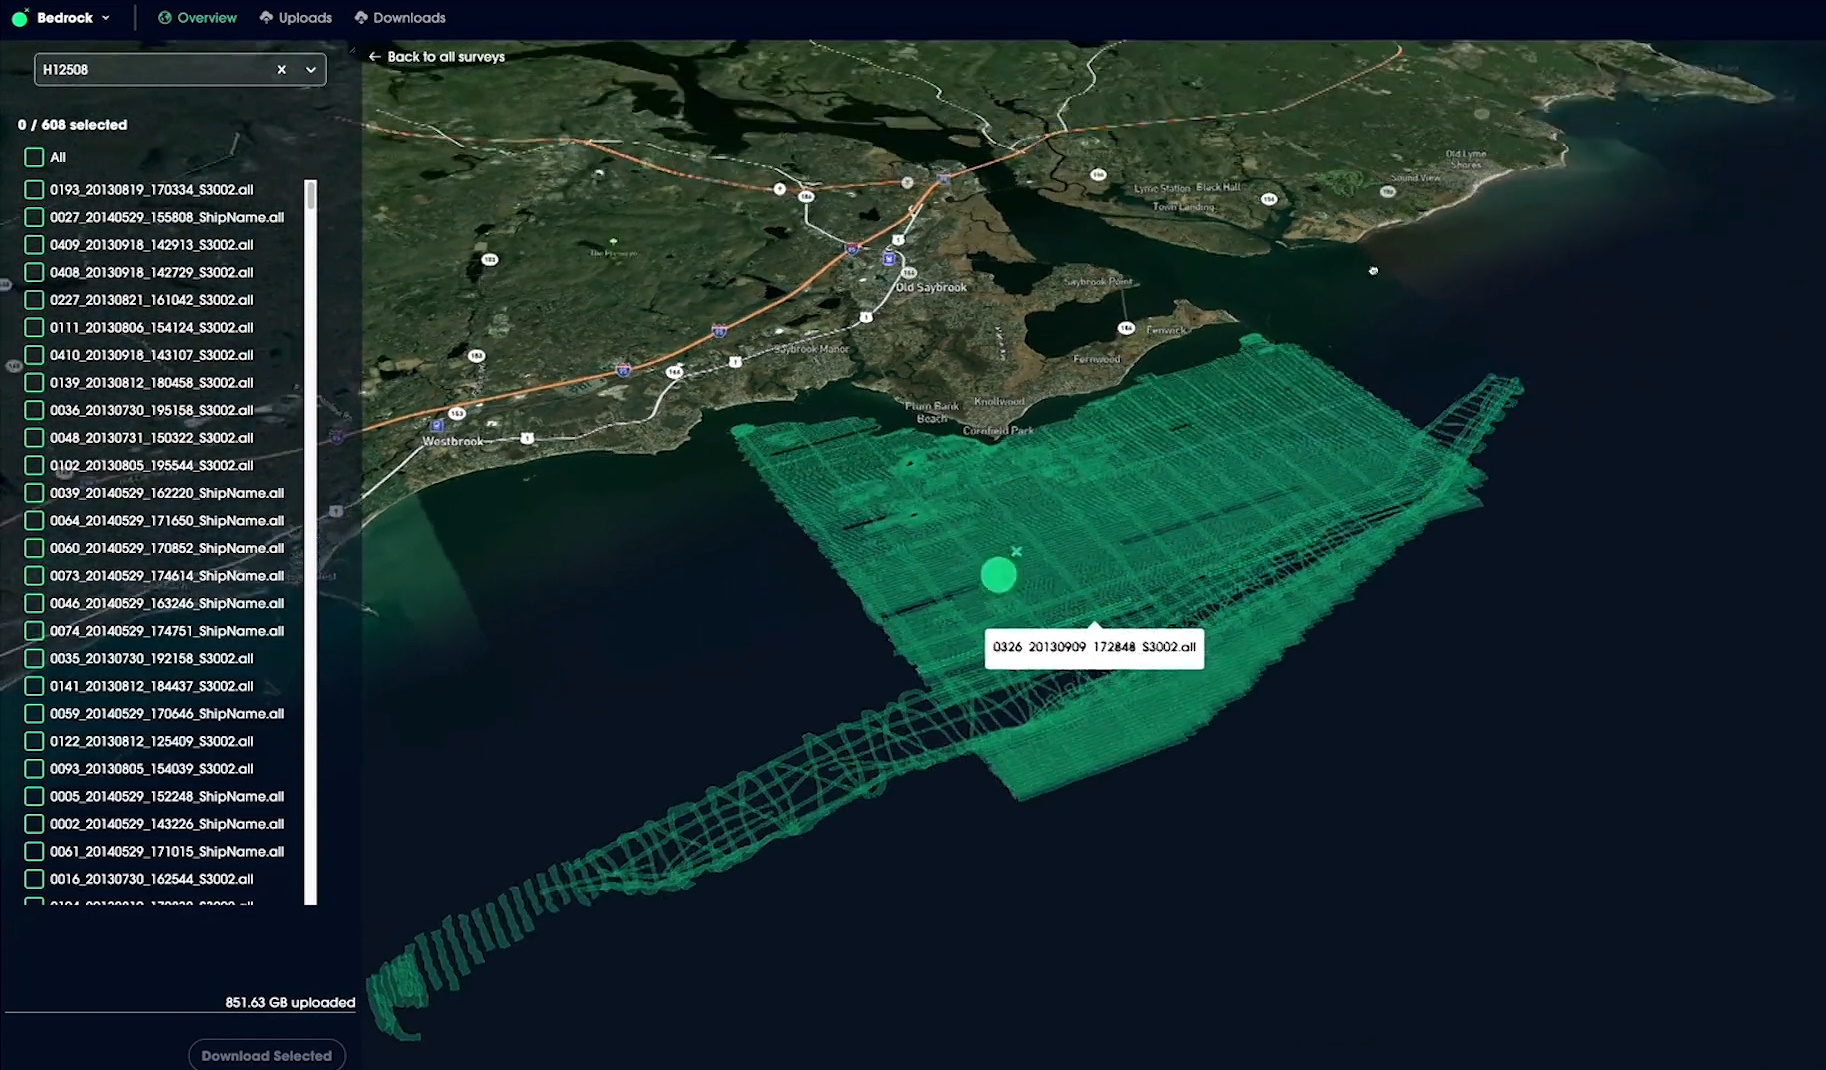
Image Credits: Bedrock
“These datasets are extremely large, tens of terabytes in size,” said DiMare.
“Typical cloud systems aren’t the best way to manage 20,000 sonar files.”
The current market is more focused on detailed, near-shore data than the deep sea, since there’s a crush to take part in the growing wind energy market.
The current market is more focused on detailed, near-shore data than the deep sea, since there’s a crush to take part in the growing wind energy market.
This means that data is collected much closer to ordinary internet infrastructure and can be handed off for cloud-based processing and storage more easily than before.
That in turn means the data can be processed and provided faster, just in time for demand to take off.
As DiMare explained, while there may have been a seafloor survey done in the last couple decades of a potential installation site, that’s only the first step.
As DiMare explained, while there may have been a seafloor survey done in the last couple decades of a potential installation site, that’s only the first step.
An initial mapping pass might have be made to confirm the years-old maps and add detail, then another for permitting, for environmental assessments, engineering, construction, and regular inspections.
If this could be done with a turnkey automated process that produced even better results than crewed ships for less money, it’s a huge win for customers relying on old methods.
And if the industry grows as expected to require more active monitoring of the seafloor along every U.S. coast, it’s a win for Bedrock as well, naturally.
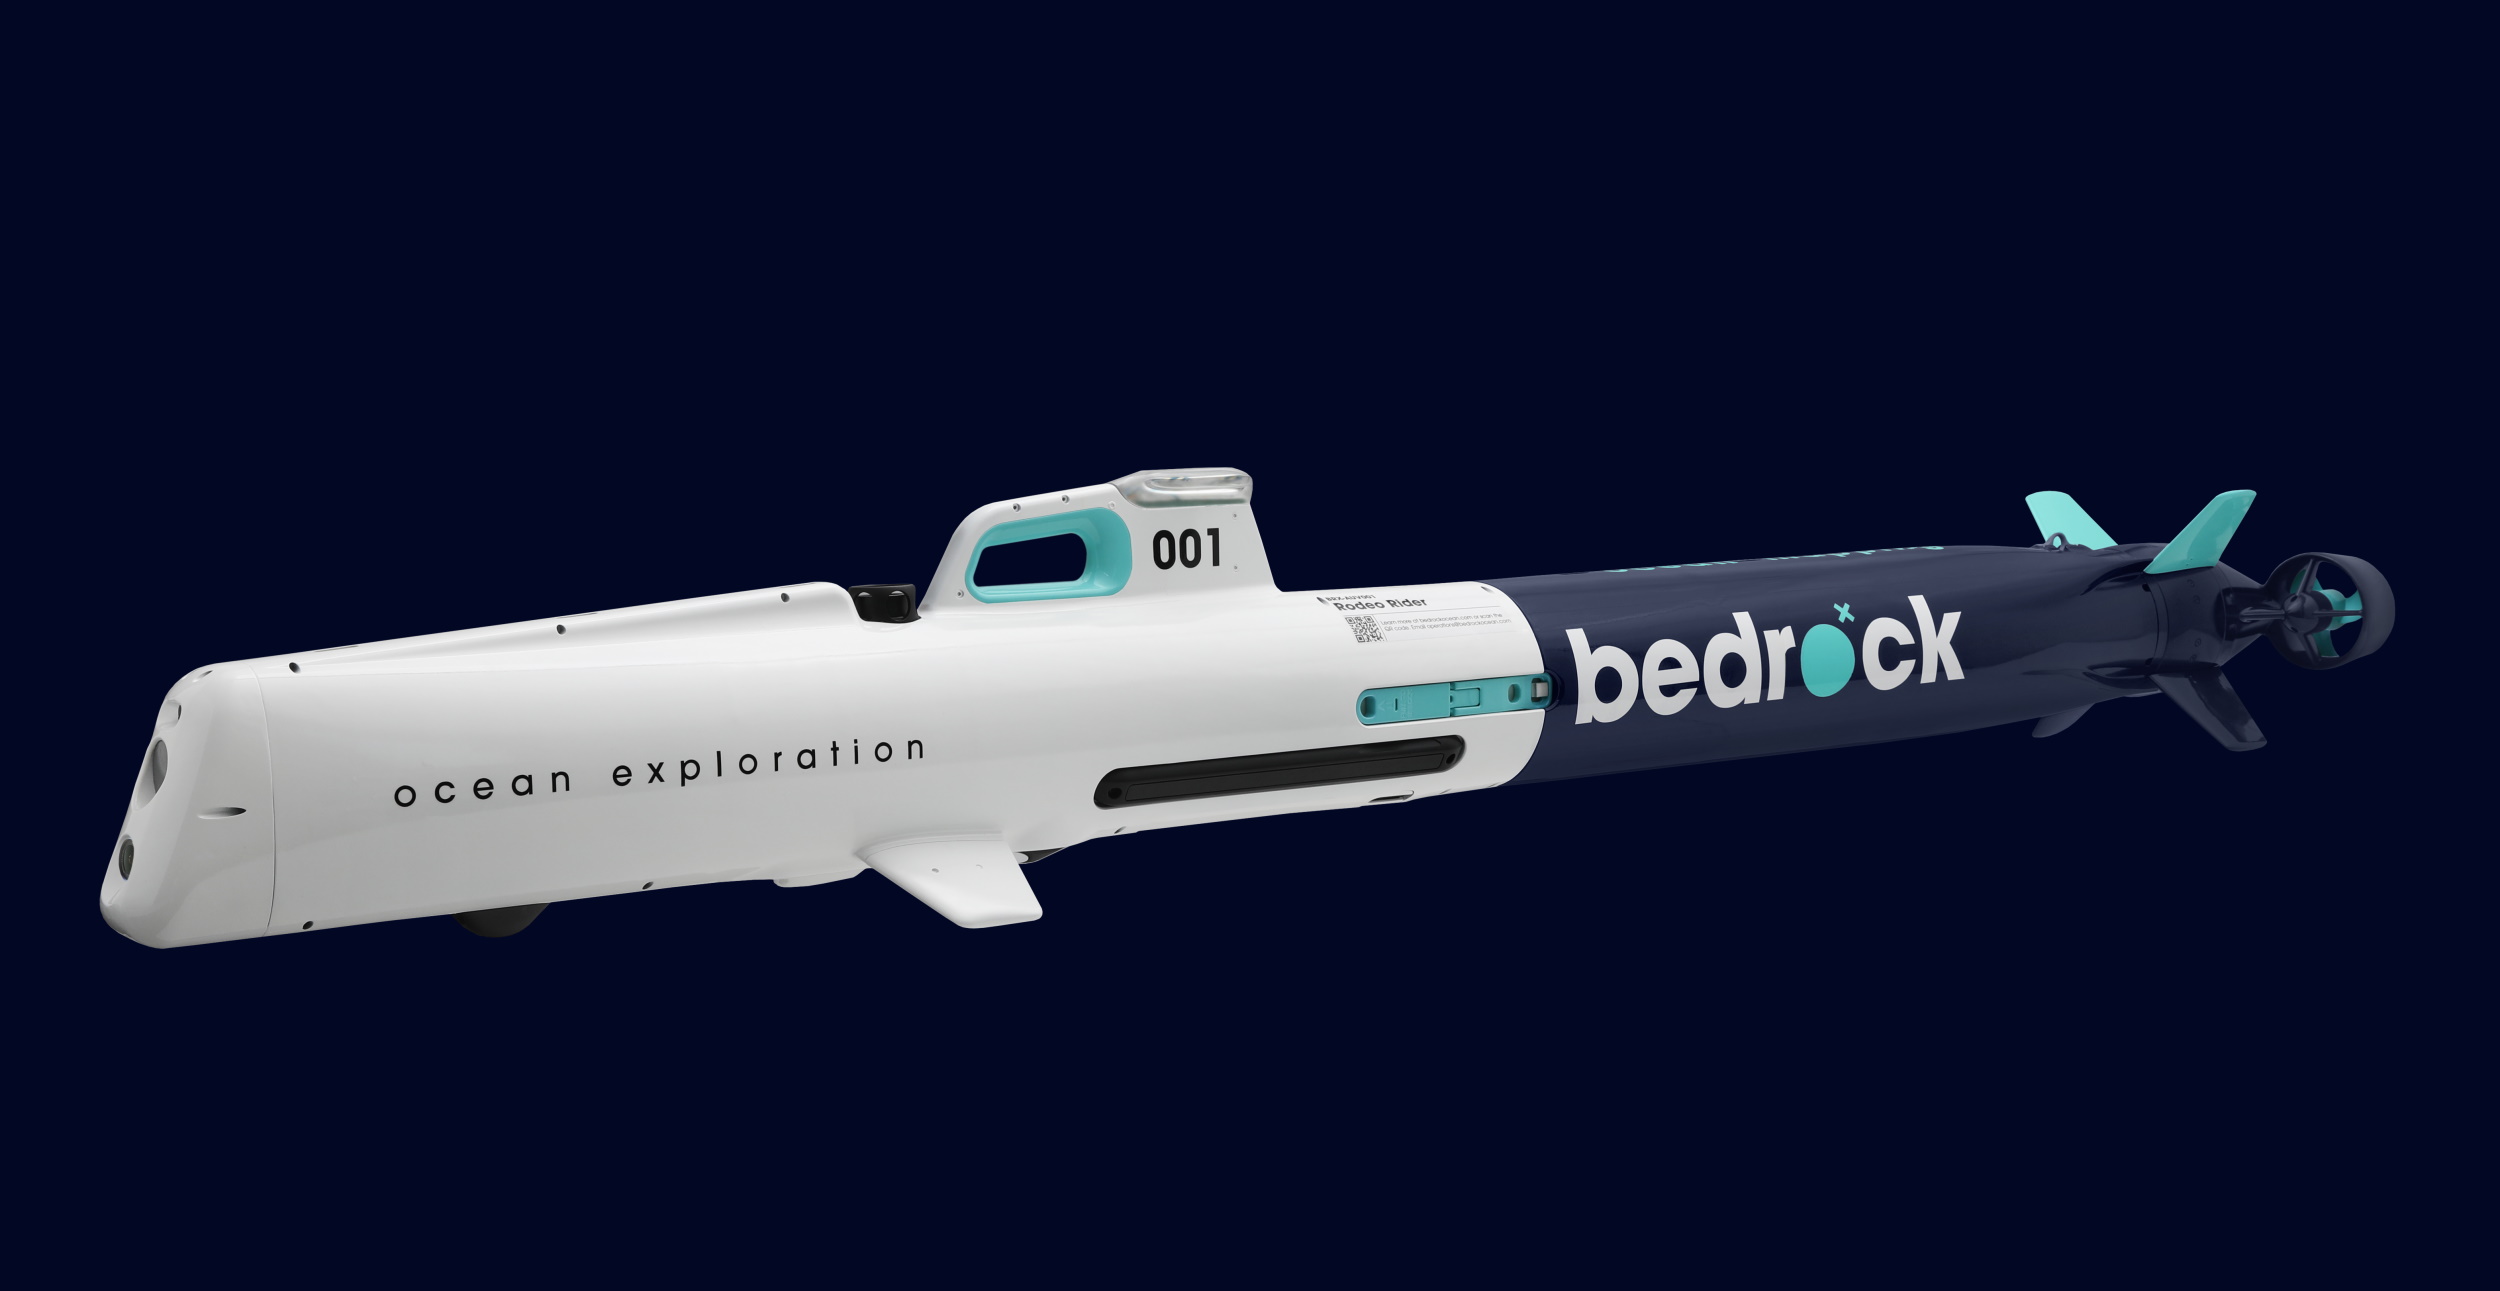
Image Credits: Bedrock
To make this all happen, of course, you need a craft that can collect the data in the first place.
“The AUV is a piece of technology we built solely to enable a data product,” said DiMare, but noted that, originally, “we didn’t want to do this.”
“We started to spec out what it looked like to use an off the shelf system,” he explained.
“We started to spec out what it looked like to use an off the shelf system,” he explained.
“But if you want to build a hyper-scalable, very efficient system to get the best cost per square meter, you need a very specific set of features, certain sonars, the compute stack… by the time we listed all those we basically had a self-designed system. It’s faster, it’s more operationally flexible, you get better data quality, and you can do it more reliably.”
And amazingly, it doesn’t even need a boat — you can grab it from the back of a van and launch it from a pier or beach.
“From the very beginning one of the restrictions we put on ourselves was ‘no boats.’ And we need to be able to fly with this thing. That totally changed our approach,” said DiMare.
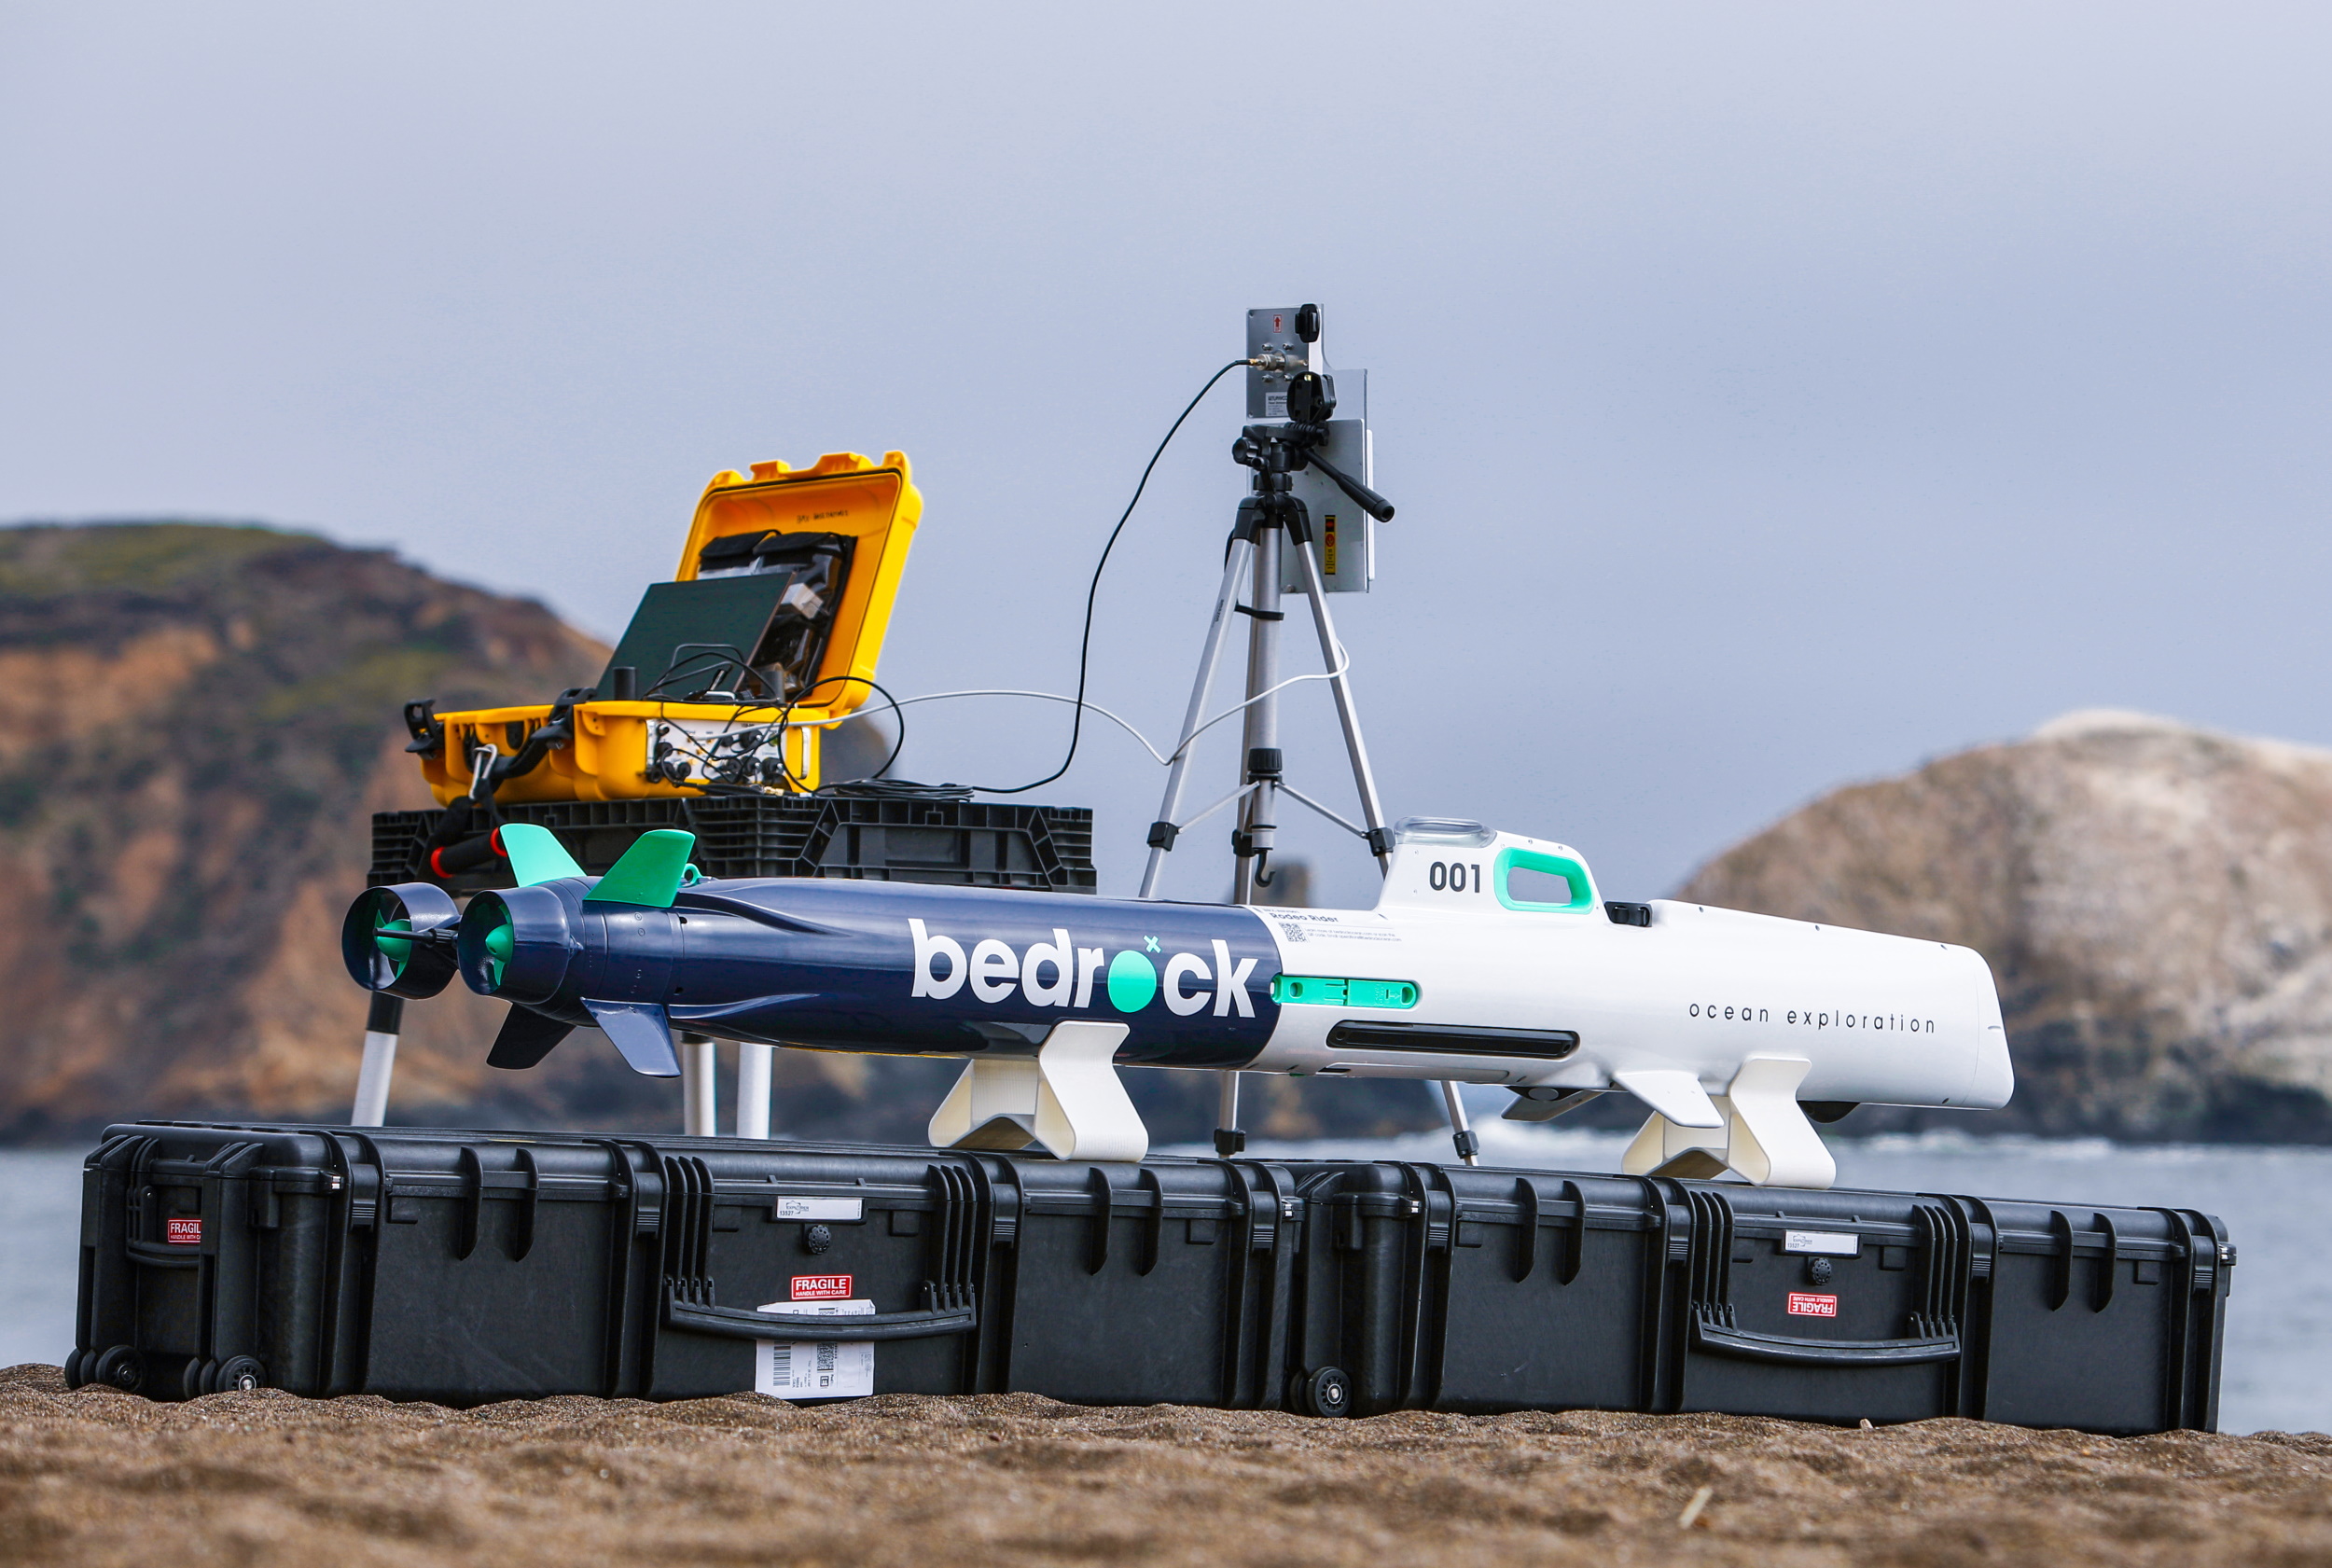
Image Credits: Bedrock
The AUV packs a lot into a small package, and while the sensor loadout is variable depending on the job, one aspect that defines the craft is its high-frequency sonar.
Sonars operate in a wide range of frequencies, from the hundreds to the hundreds of thousands of hertz. Unfortunately that means that ocean-dwelling creatures, many of which can hear in that range, are inundated with background noise, sometimes to the point where it’s harmful or deters them from entering an area.
Sonar operating about 200 kHz is safe for animals, but the high frequency means the signal attenuates more quickly, reducing the range to 50-75 meters.
That’s obviously worthless for a ship floating on the surface — much of what it needs to map is more than 75 meters deep.
That’s obviously worthless for a ship floating on the surface — much of what it needs to map is more than 75 meters deep.
But if you could make a craft that always stayed within 50 meters of the seabed, it’s full of benefits. And that’s exactly what Bedrock’s AUV is designed to do.
The increased frequency of the sonar also means increased detail, so the picture its instruments paint is better than what you’d get with a larger wave.
And because it’s safe to use around animals, you can skip the (very necessary but time-consuming) red tape at wildlife authorities.
Better, faster, cheaper, and safer is a hell of a pitch.
Today marks the official launch of Mosaic, and to promote adoption Bedrock is offering 50 gigs of free storage — of any kind of compatible map data, since the platform is format-agnostic.
There’s a ton of data out there that’s technically “public” but is nevertheless very difficult to find and use.
Today marks the official launch of Mosaic, and to promote adoption Bedrock is offering 50 gigs of free storage — of any kind of compatible map data, since the platform is format-agnostic.
There’s a ton of data out there that’s technically “public” but is nevertheless very difficult to find and use.
It may be a low-detail survey from two decades ago, or a hyper-specific scan of an area investigated by a research group, but if it were all in one place it would probably be a lot more useful, DiMare said.
“Ultimately we want to get where we can do the whole ocean on a yearly basis,” he concluded. “So we’ve got a lot of work to do.”
“Ultimately we want to get where we can do the whole ocean on a yearly basis,” he concluded. “So we’ve got a lot of work to do.”
Links :
- Techcrunch : Ocean floor mapping robotics startup Bedrock announces an $8M raise
- GeoGarage blog : The future of ocean exploration
Monday, August 23, 2021

Canada (CHS) layer update in the GeoGarage platform
 42 nautical raster charts updated
 see GeoGarage news
Why is the ocean salty?
No matter how salty you get, you'll never be as salty as the ocean
From ZME Science by Mihai Andrei
Every time you bathe in the sea, you have geology to thank for the extra buoyancy that salty water provides. Large-scale geological processes bring salt into the oceans and then recycle it deep into the planet. The short answer to ‘why is the ocean salty’ sounds something like this:
Salts eroded from rocks and soil are carried by rivers into the oceans, where salt accumulates. Another source of salts comes from hydrothermal vents, deep down on the surface of the ocean floor. We say “salts” — because the oceans carry several types of salts, not just what we call table salt.
But the longer answer (that follows below) is so much more interesting.
Image credits: Olia Nayda.
In the beginning there was saltiness
As it is so often the case in geology, our story begins with rocks and dirt, and we have to go back in time — a lot. Billions of years ago, during a period called the Archean, our planet was a very different environment than it is today. The atmosphere was different, the landscape was different, but as far as ocean saltiness goes, there may have been more similarities than differences.
Geologists look at ancient rocks that preserved ancient water (and therefore, its ancient salinity); one such study found that Earth’s Archean oceans may have been ~1.2 times saltier than they are today.
At first glance, this sounds pretty weird. Since salt in the seas and oceans is brought in by river runoff and erosion, the salts hadn’t yet had time to accumulate in Earth’s earliest days. So what’s going on?
It is believed that while the very first primeval oceans were less salty than they are today, our oceans have had a significant salinity for billions of years. Although rivers hadn’t had sufficient time to dissolve salts and carry them to oceans, this salinity was driven by the oceanic melting of briny rocks called evaporites, and potentially volcanic activity. It is in this water that the first life forms on Earth emerged and started evolving.
“The ions that were put there long ago have managed to stick around,” says Galen McKinley, a UW-Madison professor of atmospheric and oceanic sciences. “There is geologic evidence that the saltiness of the water has been the way that it is for at least a billion years.”
The ancient salinity of oceans is still an area of active research with many unknowns. But while we don’t fully understand what’s going on with the ancient oceans, we have a much better understanding of what drives salinity today.
So how do the oceans get salty today?Salinity map of the world’s oceans. Scale is in parts per thousand. Image credits: NASA.
Oceans today have an average of 3.5% salinity. In other words, 3.5% of the ocean’s weight is made of dissolved salts. Most, but not all of that is sodium chloride (what we call ‘salt‘ in day to day life). Around 10% of the salt ions come from different minerals.
At first glance, 3.5% may not seem that much, but we forget that around 70% of our planet is covered in oceans. If we took all the salt in the ocean and spread it evenly over the land surface, it would form a layer over 500 feet (166 meters) thick — a whopping 40-story building’s height of salt covering the entire planet’s landmass. That’s how much 3.5% means in this particular case.
All these salts come from rocks. Rocks are laden with ionic elements such as sodium, chlorine, and potassium. Much of this material was spewed as magma by massive volcanic eruptions and can form salts under the right conditions.
Because it is slightly acidic, rainwater can slowly dissolve, erode rocks. As it does so, it gathers ions that make up salts and transfers them to streams and rivers. We consider rivers to be “freshwater”, but that’s not technically true: all rivers have some salt dissolved in them, but because they flow, they don’t really accumulate it. Rivers are agents for carrying salts, but they don’t store salts themselves.The main culprit for why oceans are salty: rivers. Image credits: Jon Flobrant.
Rivers constantly gather more salts, but they constantly push it downstream. Influx from precipitation also ensures that the salt concentration doesn’t increase over time.
Meanwhile, the oceans have no outlet, and while they also have currents and are still dynamic, they have nowhere to send the salts to, so they just accumulate more and more salt. Which leads us to an interesting question.
So, are the oceans getting saltier?
Bodies of water can be classified by their salt content.
No, not really. Although it’s hard to say whether oceans will get saltier in geologic time (ie millions of years), ocean salinity remains generally constant, despite the constant influx of salt.
“Ions aren’t being removed or supplied in an appreciable amount,” says McKinley. “The removal and sources that do exist are so small and the reservoir is so large that those ions just stay in the water.” For example, she says, “Each year, runoff from the land adds only 0.00005 percent of total ocean salts.”
A part of the minerals is used by animals and plants in the water and another part of salts becomes sediment on the ocean floor and is not dissolved. However, the main reason why oceans aren’t getting saltier is once more geological.
The surface of our planet is in a constant state of movement — we call this plate tectonics. Essentially, the Earth’s crust is split into rigid plates that move around at a speed of a few centimeters per year. Some are buried through the process of subduction, taking with them the minerals and salts into the mantle, where they are recycled. The movement of tectonic plates constantly recirculates material from and into the mantle. Schematic of subduction (and some other associated processes). Image credits: K. D. Schroeder.
With these processes, along with the flow of freshwater, precipitation, and a number of other processes, the salinity of the Earth’s oceans remains relatively stable — the oceans have a stable input and output of salts.
But isolated bodies of water, however, can become extra salty.
Why some lakes are freshwater, and some are *very* salty
Lakes are temporary storage areas for water, and most lakes tend to be freshwater. Rivers and streams bring water to lakes just like they do to oceans, so then why don’t lakes get salty?
Well, lakes are usually only wide depressions in a river channel — there is a water input and a water output, water flows in and it flows out. This is called an open lake, and open lakes are essentially a buffer for rivers, where water accumulates, but it still flows in and out, without salts accumulating. Many lakes are also the result of chaotic drainage patterns left over from the last Ice Age, which makes them very recent in geologic time and salts have not had the time to accumulate.Beautiful glacial lakes such as this one are the remains of Ice Age melting. Image credits: K. D. Schroeder.
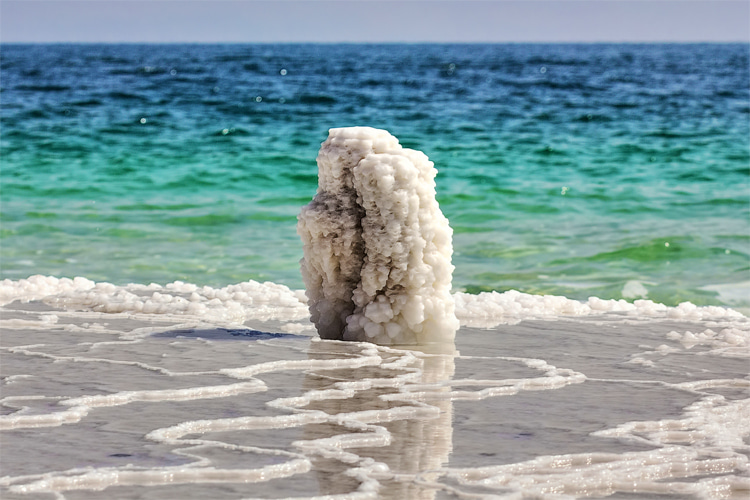
But when a lake has no water output and it has had enough time to accumulate salts, it can become very salty. This is called a closed lake, and closed lakes (and seas) can be very salty, much more so than the planetary oceans. They accumulate salts and lose water through evaporation, which increases the concentration of salts. Closed lakes are pretty much always saline.
We mentioned that world oceans are 3.5% salt on average. The Mediterranean Sea has a salinity of 3.8%. The Red Sea has some areas with salinity over 4%, and Mono Lake in California can have a salinity of 8.8%. But even that isn’t close to the saltiest lakes on Earth. Great Salt Lake in Utah has a whopping salinity of 31.7%, and the pink lake Retba in Senegal, where people have mined salt for centuries, has a salinity that reaches 40% in some points. The saltiest lake we know of is called Gaet’ale Pond — a small, hot pond with a salinity of 43% — a testament to just how saline these isolated bodies of water can get.Worker digging the salt in Lake Retba. Image in public domain.
It’s important to note that lakes are not stable geologically, and many tend to not last in geologic time. Some of the world’s biggest lakes are drying up, both as a natural process and due to rising temperatures, drought, and agricultural irrigation.
Salt can also come from belowHydrothermal vent. Image credits: NOAA.
We’ve mentioned that rock weathering and dissolving makes oceans salty, but there is another process: hydrothermal vents.
A part of the ocean water seeps deeper into the crust, becomes hotter, dissolves some minerals, and then flows back into the ocean through these vents. The hot water brings large amounts of minerals and salts. It’s not a one-way process — some of the salts react with the rocks and are removed from seawater, but this process also contributes to salinization.
Lastly, underwater volcanic eruptions can also bring salts from the deeper parts to the surface, affecting the salt content of oceans.
Links :
- SurferToday : Why is the ocean salty?
Rain and warmth trigger more melting in Greenland
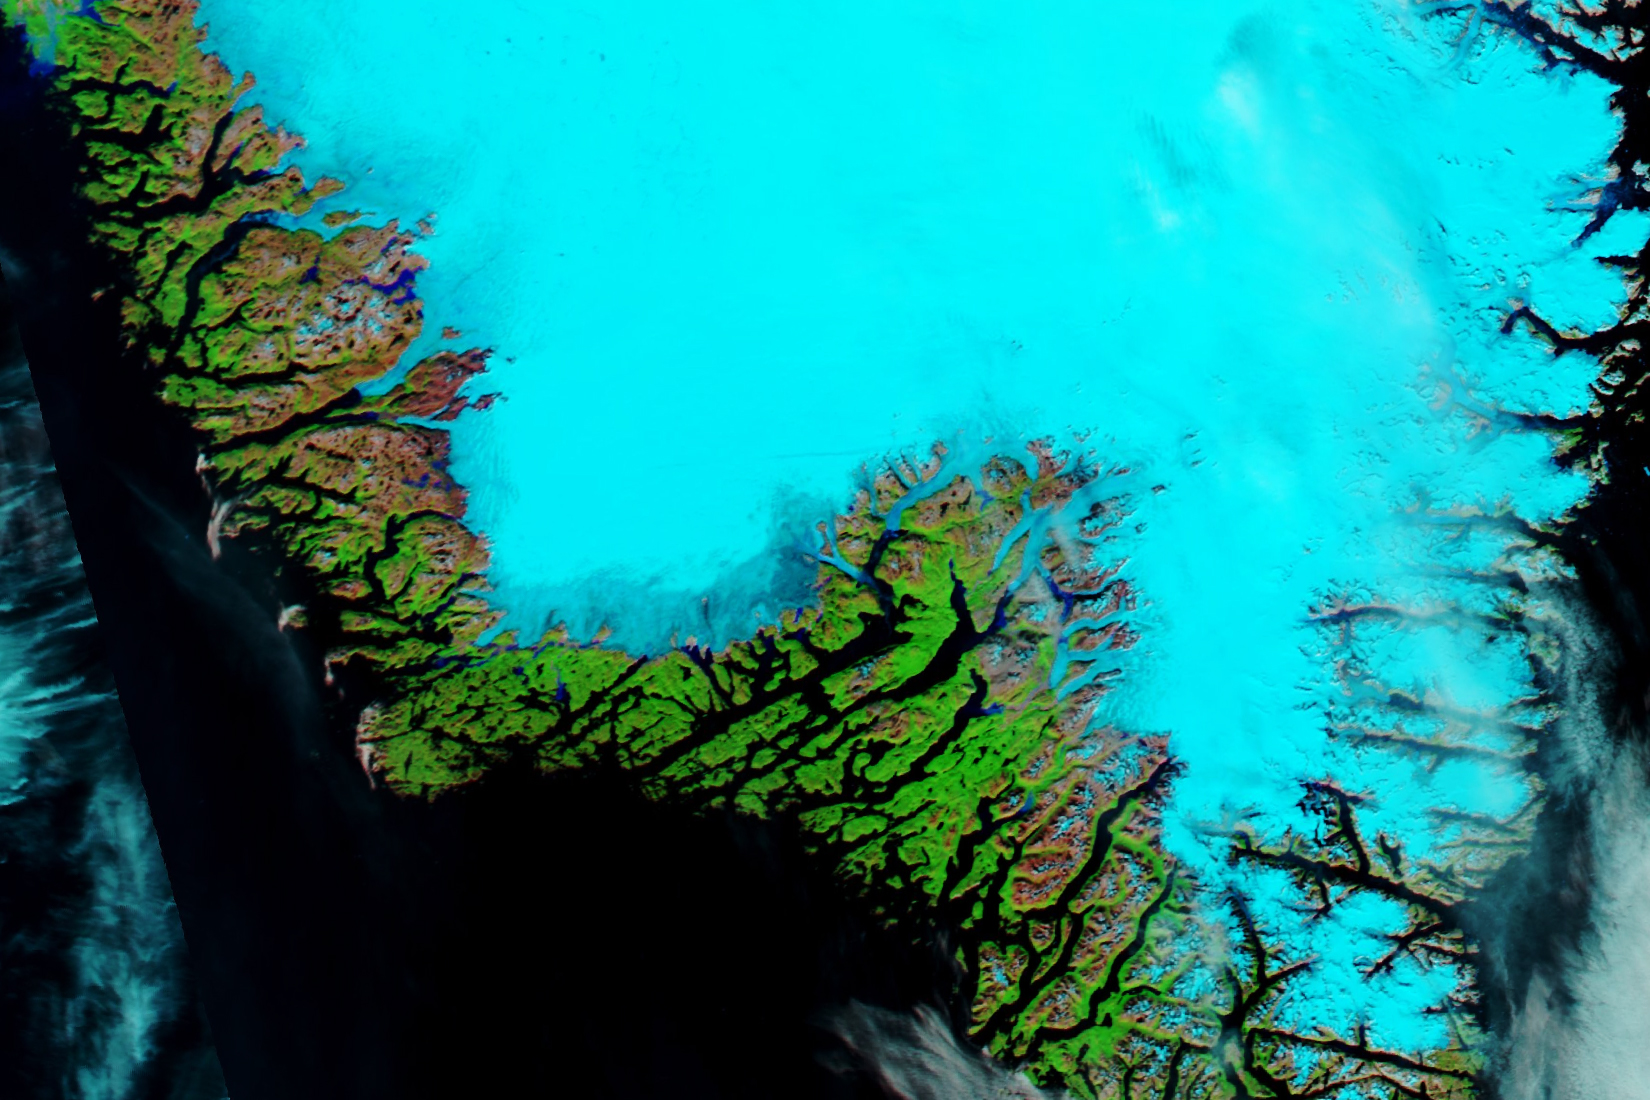
August 12, 2021
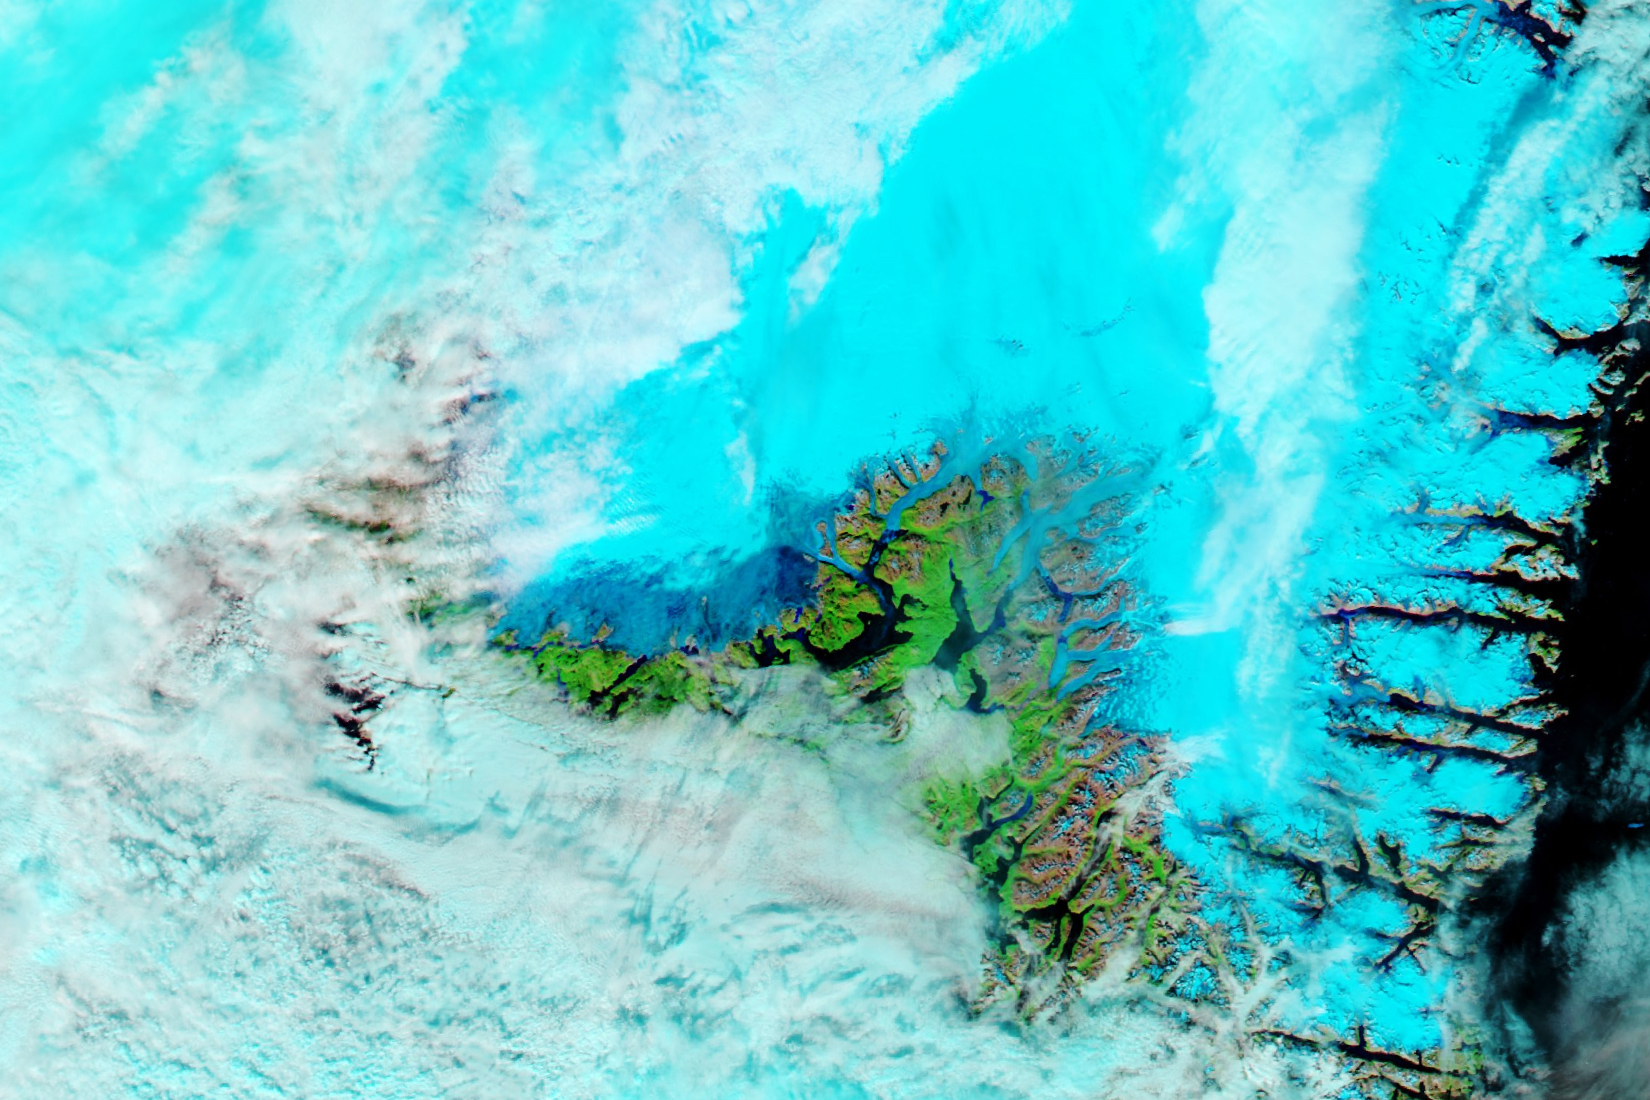
From The Guardian by Damina Carrington
Precipitation was so unexpected, scientists had no gauges to measure it, and is stark sign of climate crisis
Rain has fallen on the summit of Greenland’s huge ice cap for the first time on record.Temperatures are normally well below freezing on the 3,216-metre (10,551ft) peak, and the precipitation is a stark sign of the climate crisis.
Scientists at the US National Science Foundation’s summit station saw rain falling throughout 14 August but had no gauges to measure the fall because the precipitation was so unexpected.
Across Greenland, an estimated 7bn tonnes of water was released from the clouds.
The rain fell during an exceptionally hot three days in Greenland when temperatures were 18C higher than average in places.
As a result, melting was seen in most of Greenland, across an area about four times the size of the UK.
The recent report from the Intergovernmental Panel on Climate Change concluded it was “unequivocal” that carbon emissions from human activities were heating the planet and causing impacts such as melting ice and rising sea level.
The recent report from the Intergovernmental Panel on Climate Change concluded it was “unequivocal” that carbon emissions from human activities were heating the planet and causing impacts such as melting ice and rising sea level.
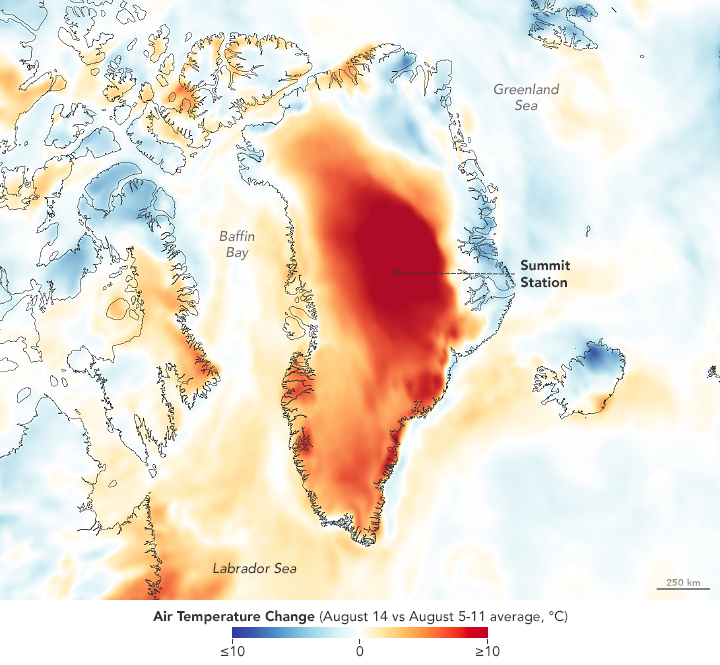
Air temperature change (August 14 vs August 5-11 average, °C)
In May, researchers reported that a significant part of the Greenland ice sheet was nearing a tipping point, after which accelerated melting would become inevitable even if global heating was halted.
Ted Scambos, a scientist at the National Snow and Ice Data Center at the University of Colorado, which reported the summit rain, told CNN: “What is going on is not simply a warm decade or two in a wandering climate pattern. This is unprecedented. We are crossing thresholds not seen in millennia, and frankly this is not going to change until we adjust what we’re doing to the air.”
Greenland also had a large-scale melting episode in July, making 2021 one of just four years in the past century to see such widespread melting. The other years were 2019, 2012 and 1995.
The rain and melt on 14-16 August came at the latest point in the year a major event has been recorded.
The cause of the July and August melting was the same – warm air being pushed up over Greenland and held there.
These “blocking” events are not uncommon but seem to be becoming more severe, according to scientists.
Global sea level would rise by about 6 metres if all of Greenland’s ice melted, although this would take centuries or millennia to occur.
But the trillions of tonnes lost from Greenland since 1994 is pushing up sea levels and endangering the world’s coastal cities.
Sea level has already risen by 20cm, and the IPCC said the likely range by the end of the century was a further 28-100cm, though it could be 200cm.
Greenland’s ice is melting faster than any time in the past 12,000 years, scientists have estimated, with the ice loss running at a rate of about 1m tonnes a minute in 2019.
Links :
Sunday, August 22, 2021
Which way will paper maps go in the future? Cartographer says they'll still be crucial, even with GPS
(ABC News: Lincoln Rothall)
From ABC by Bec Whetham
As a test, Anthony Stephens likes to ask "anybody under 30 years old who lives in the city" to name the suburb directly to the north of where they live.
"It is interesting the answers you get," Mr Stephens said.
"Sometimes we even get the question, 'What is north?'"
Our modern dependency on GPS has certainly challenged the cartographer, who has made and sold paper maps for more than 50 years.
His business, The Map Shop, used to produce Adelaide's street directories.
"We stopped printing those four years ago. You will never see a new Fuller's street directory again," Mr Stephens said.
(ABC News: Lincoln Rothall)
Prior to COVID, 40 per cent of his business was overseas maps.
He has sold 10 in the past nine months.
The message that his product is dying doesn't scare him.
He has heard it before.
First at a map conference in the 1970s, where it was predicted that there would be "no such thing as maps" by 1990.
"And then I attended another conference in San Diego in the 1990s and their message was there would be no maps by the year 2000," Mr Stephens said.
"Guess what? It's 2021 and there are still paper maps and we've got 14,500 different ones."
(ABC News: Lincoln Rothall)
Fortunately the shop has been able to fill some of the gap in demand with an increase in local and domestic maps, alongside its longstanding clients looking for topographical maps for commercial, emergency, or farming purposes.
Why maps are important
More than providing a route to travel or indicating where to find the nearest service station, Mr Stephens says maps are an important factor in human empathy.
"What's the use of listening to the news of doom and gloom if you don't know where the doom and gloom is in relation to you?" Mr Stephens said.
"It's as simple as that."
He has genuine concerns for young people who don't use maps, or know how.
"Because they're so used to looking at the screen on their phone, they only see that portion of the world."
He says maps are also an important record of time.
"[With] everything going online, there is then not a snapshot in time.
We're going to become the forgotten generation."
One of the shop's most popular items is a 100-year-old map of Adelaide, which features things like the Sir Ross Smith landing area.
"Of course all those maps were done under 'plane tabling', which involved a man going on top of a hill … triangulating the major features, then going to another hill and checking the coordinates and then sketching between them."
A modern day cartographer
What Mr Stephens once made by hand is now done with computers.
"We used to be known as plastic scratchers because we would actually work over a light table on a material where you would actually scratch out the plastic to mark out the roads and contours and drainage," Mr Stephens said.
"It still takes the same time to make the maps but the updating is a lot easier for us."
It is online mapping that has allowed modern-day cartographer Alex Broers to develop his love of art, culture and fantasy into a profitable business.
He hand draws "bespoke" maps, recreating Australian destinations that resemble maps of The Lord of the Rings' Middle Earth.
"I was making these maps initially as a personal hobby and passion, it was never a business to begin with," he said.
Alex Broers runs Cartography Chronicles, a business that makes old-age maps of Australian destinations.(Supplied: Alex Broers)
Map making an art and a science
In the middle of COVID, Mr Broers started his business Cartography Chronicles in response to commercial interest online.
While it's always preferable to travel to the places he's recreating, the process can be done from his home in Darwin.
"I'm very lucky that we have the internet these days and a lot of the resources that I need to actually make the maps are also online."
It's still a long process though.
"For one of my state maps, it does take me 60-70 hours of drawing and that doesn't factor in the research phase."
(Supplied: Alex Broers)
While the geographical points are accurate, some features — the mountain ranges in particular — are enlarged.
"Obviously they're not in proportion to real life purely because if they were you'd have a little 'x' on a map or a few contour lines.
"With my work I really wanted to bring to the forefront the geography of each region."
Sentimental attachment
Mr Broers is continually taken aback by the interest in — and emotional attachment to — his work.
"I think it's a real testament that Australians in general are very attached and proud of where they come from," he says.
While Mr Broers's maps may not be made for navigation, they do evoke a personal reference for people.
Alex Broers (pictured) and Anthony Stephens are travellers.
Mr Broers grew up in Bahrain and then lived in UK and Oman before moving to Australia.
Mr Broers grew up in Bahrain and then lived in UK and Oman before moving to Australia.
(Supplied: Alex Broers)
"[They] almost connect the dots for people … [the map] triggers different memories depending on what area you look at."
The future of map making
While Mr Broers's personal style of map making may be keeping the art of cartography alive, Mr Stephens hopes traditional topographical maps will continue into the future.
"[Companies] … like Google rely on that base data so you can have your electronic version.
If that base data is not being developed then your electronic data is going to get out of date as well," Mr Stephens said.
"How can you develop a country if you haven't got up-to-date maps?"
It's a skill Mr Broers appreciates too.
"I don't know many people who are making cartography maps like the likes of Anthony," he said.
While GPS is an aid to a map, he says it's not a replacement.(ABC News: Lincoln Rothall)
"I do feel like it's a slowly dying art because of GPS, Google Maps and everything else [but] I still think there's a need for those handmade accurate maps."
The amazing life of sand : deep look
There's a story in every grain of sand: tales of life and death, fire and water.
If you scooped up a handful of sand from every beach, you'd have a history of the world sifting through your fingers.
See the unseen at the very edge of our visible world.
If you scooped up a handful of sand from every beach, you'd have a history of the world sifting through your fingers.
See the unseen at the very edge of our visible world.
How does sand form?
Sand can be anything that has been worn down until it’s reduced to some tiny, essential fragment of what it once was: a granite pebble from the mountains; coral from the sea; obsidian from a volcano; even skeletons of microscopic sea animals.
It's also a technical term.
Bigger than sand, that’s gravel, smaller? Silt.
It's also a technical term.
Bigger than sand, that’s gravel, smaller? Silt.
By studying the composition and texture of sand, geologists can reconstruct its incredible life history.
“There’s just a ton of information out there, and all of it is in the sand,” said Mary McGann, a geologist at the United States Geological Survey in Menlo Park, CA. McGann recently took part in a comprehensive research project mapping sand’s journey into and throughout San Francisco Bay.
Patrick Barnard, another USGS geologist who helped oversee the project, said that it will help scientists understand how local beaches are changing over time.
In particular, Barnard wants to understand why beaches just south of San Francisco Bay are among the most rapidly eroding beaches in the state.
In particular, Barnard wants to understand why beaches just south of San Francisco Bay are among the most rapidly eroding beaches in the state.
From 2010-2012, Barnard and his team sampled beaches, outcrops, rivers and creeks to track sand’s journey around the bay.
They even collected sand from the ocean floor.
The researchers then carefully analyzed the samples to characterize the shapes, sizes, and chemical properties of the sand grains.
They even collected sand from the ocean floor.
The researchers then carefully analyzed the samples to characterize the shapes, sizes, and chemical properties of the sand grains.
Barnard said the information provides a kind of fingerprint, or signature, for each sample that can then be matched to a potential source.
For example, certain minerals may only come from the Sierra Mountains or the Marin Headlands.
For example, certain minerals may only come from the Sierra Mountains or the Marin Headlands.
“If we’ve covered all of the potential sources, and we know the unique signature of the sand from these different sources, and we find it on a beach somewhere, then we basically know where it came from,” explained Barnard.
And those species aren’t the only things finding their way into the sand.
Manmade materials can show up there, too.
Manmade materials can show up there, too.
McGann has found metal welding scraps and tiny glass spheres (commonly sprinkled on highways to make road stripes reflective) in sand samples from around the bay.
“All of these things can get washed into our rivers or our creeks, or washed off the road in storm drains,” explained McGann.
“Eventually they end up in, for example, San Francisco Bay.”
“Eventually they end up in, for example, San Francisco Bay.”
By piecing together all of these clues – the information found in the minerals, biological material and man made objects that make up sand – the researchers ended up with a pretty clear picture of how sand travels around San Francisco Bay.
Some sands stay close to home.
Rocky sand in the Marin Headlands comes from nearby bluffs, never straying far from its source.
Rocky sand in the Marin Headlands comes from nearby bluffs, never straying far from its source.
Other sands travel hundreds of miles.
Granite from the Sierra Nevada mountains careens down rivers and streams on a century-long sojourn to the coast.
Granite from the Sierra Nevada mountains careens down rivers and streams on a century-long sojourn to the coast.
In fact, much of the sand in the Bay Area comes from the Sacramento and San Joaquin rivers, with local watersheds also playing an important role in transporting sand to the beach.
Although this project focused on San Francisco Bay, the same techniques could be used to study other coastal systems, he added, revealing the incredible life stories of sand from around the world.
Subscribe to:
Posts (Atom)