Saturday, October 11, 2014

Volvo Ocean Race: a test of skills, not boats


From NYTimes by Christopher Clarey

Long before Charlie Enright found a way to convince a Norwegian race director and a Turkish businessman that he deserved their faith and, above all, money, he was an elementary school student in East Providence, R.I.

 A brand new digitally restored version of the official film
for the 1973-74 Whitbread Round the World Race.

One of the learning tools in first grade was the Whitbread Round the World Race, later renamed the Volvo Ocean Race.
“We studied it as part of a geography class,” Enright said in an interview this past week.
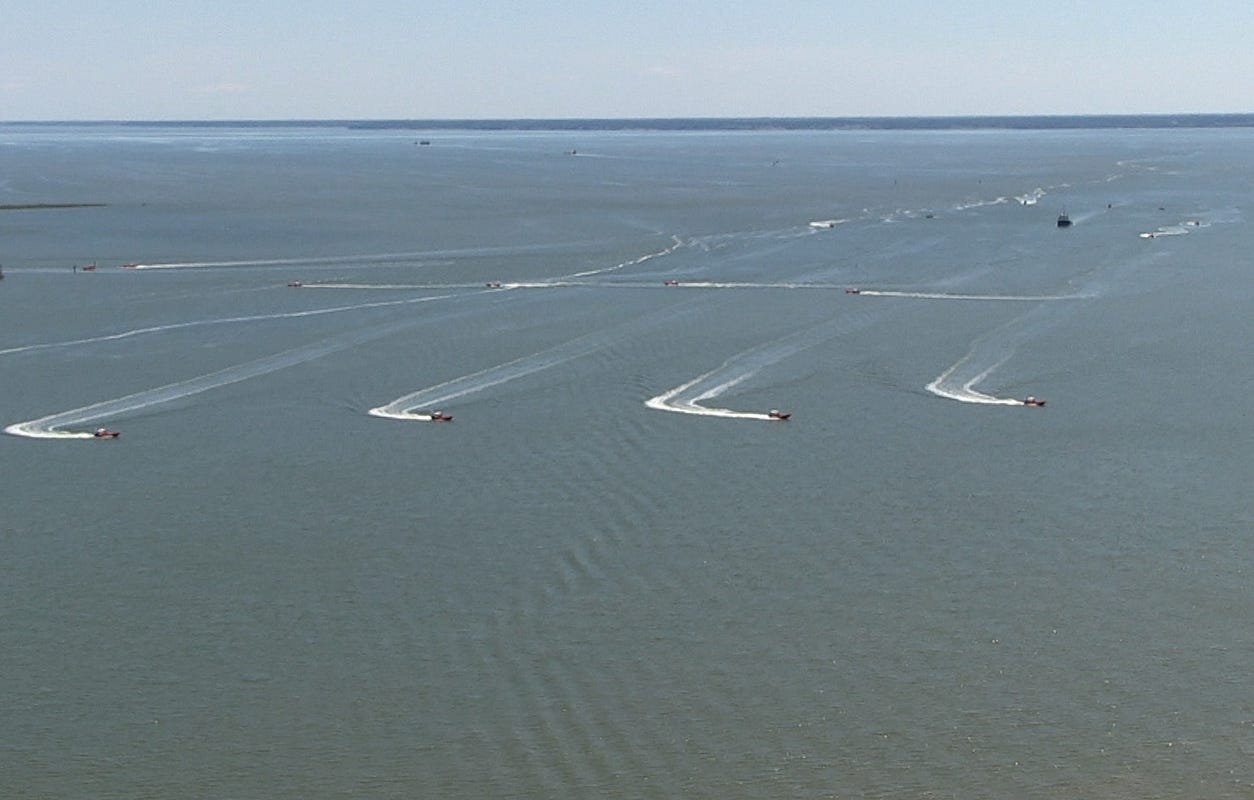
More than 20 years later, Enright is off to circumnavigate the planet for real as skipper of Team Alvimedica, one of seven yachts in the latest Volvo Race.
The fleet is to leave Alicante, Spain, for Cape Town on Saturday on what will be the first of nine legs in this triennial test of guts, smarts and salt-sprayed staying power.
Let the sleep deprivation begin.

Where the adventure begins


Make no mistake, however: The Volvo is still risky business.
In May 2006, the Dutch sailor Hans Horrevoets was washed overboard and died in the middle of a stormy transatlantic leg.
Last time around, on the first leg of the 2011-12 race, Puma Ocean Racing’s main mast broke into three pieces in the South Atlantic, nearly 2,000 nautical miles from Cape Town.
That mishap forced the American skipper Ken Read and his crew to seek safe harbor on Tristan da Cunha island, home to one of the most remote settlements in the world.
“Believe me, the Volvo’s still an adventure,” Read said this past week.
Read, the 53-year-old president of North Sails, is sitting out this edition, but his former North Sails employee Enright, who recently turned 30, is making his debut.

Enright and his 25-year-old teammate Mark Towill, who both sailed at Brown University and hunted down the funding against the odds to compete in the Volvo, are the leaders of a new wave of talent that has changed the face of the race.
And their emergence is directly linked to major change in the race itself.

A race around you

The original Whitbread was contested in all manner of ocean-going vessels, and teams have continued to have some latitude in boat design in subsequent class rules.
But faced with a sluggish global economy, spiraling costs and increasing sponsor resistance, the Volvo has switched to a one-design class for the first time this year.

That means all seven of the teams are using identical 65-foot boats that were produced in the same British shipyard.
“It’s truly one design, down to they are weighing everything we put on the boats to make sure some boats don’t have extra stacks that provide extra stability,” Oxley said.
“Everyone has the same software. No one is allowed to have bespoke software.”

“It’s like stepping on a sophisticated Laser,” he added, referring to the one-design class of dinghy.
The Volvo’s bold move is not without naysayers, some of whom fear that the lack of freedom will stifle the innovation that comes with teams searching for a design edge, however small.
But a one-design approach is undeniably cost-efficient with the teams now able to share the same shore crew and avoid sinking funds into research and development of boats and sails.


Knut Frostad, the Norwegian who is chief executive officer of the Volvo Race, said the team budgets for the last race ranged from 20 million euros to 35 million euros, or about $25 million to $44 million, over a two-year period.
This time, he said the budgets range from 9 million euros to 15 million euros.
Though there is only one more team this time than in 2011, when there was a record low of six, Frostad said there could well have been no boats and no race at all.
“If we had done nothing, if we had not changed, I’m very confident we wouldn’t have existed,” Frostad said.
“There were a few other changes we could have done instead, but I think this is the right thing.
“Now the sailors know it’s about them. It’s about nothing else. It’s about who can keep the team together and they can still go as fast as before but there are no excuses now.”

The changes have helped bring an all-women’s crew back to the event — the Swedish-backed Team SCA — for the first time since 2002.
The one-design rule also means that a late entry from Denmark — Team Vestas Wind — has a chance to be competitive to a degree it simply could not have been had it needed to build and develop its own boat.

“If I were still doing the race, I would miss the custom aspect of it,” Read said.
“I loved integrating the design and sailing teams, but for the race’s viability, I think one design was probably the only option, and I think they are very happy they did it.”

Enright and Towill are certainly delighted.
They met in 2007 after both made the cut for the documentary film project “Morning Light’’ in which a crew of young sailors, funded by Roy Disney, competed in the 2007 Transpacific race.
During that project, Enright and Towill heard inspirational tales from former Volvo Race winners like Stan Honey and Mike Sanderson.

The young Americans caught Frostad’s eye in 2011.
Though teams once came to the race on their own with their sponsors and backing in place, Frostad and Volvo organizers have become increasingly involved in identifying potential sponsors and connecting them with prospective sailors.
Though Enright and Towill courted American companies, Frostad eventually put them in touch with Alvimedica, a Turkish medical supply manufacturer looking to raise its profile globally.
The team is flying both Turkish and American flags during the race.

It has been quite a learning curve, and it is only going to get steeper as the Volvo rookies head off on the longest leg of their lives and then sail for the first time in the direction of the volatile Southern Ocean.
“They’re going to be a lot older and wiser when they get to Sweden in nine months,” Frostad said.
Meanwhile, back in Rhode Island, Enright’s wife Meris, a fifth-grade teacher, will be helping to organize a geography class of her own with a certain round-the-world race for a tool.
“She’s doing it with her kids this time around,” Enright said.

Links :

Friday, October 10, 2014

‘The other CO2 problem’: How acidic oceans will cost our economy billions

 Ocean Acidification - Revolution World Issue
An in-depth look at ocean acidification, carbon emission and ocean PH, narrated by Rob Stewart, Director of the film Revolution.
Stewart shows us how increased carbon emissions create greenhouse gas, global warming and the biggest threat to our planet and marine ecosystems, Ocean Acidification.

From ThinkProgress by Emily Atkin

The growing acidity of the world’s oceans could cost the global economy $1 trillion by 2100 if humans don’t stop putting so much carbon dioxide into the atmosphere, according to an extensive report compiled by 30 experts worldwide and released Wednesday by the U.N. Convention on Biological Diversity.

Oceans have absorbed so much carbon dioxide emitted from power plants, deforestation, manufacturing, and driving, that their acid levels have increased by a staggering 26 percent over the last 200 years, the report said.
The disruption of the ocean’s natural pH levels are directly impacting the health of marine life and ecosystems and scientists emphasize that if these trends continue unchecked, it could be both horribly detrimental for the world economy and largely irreversible for thousands of years.

 A Norwegin coral reef with gorgonian and stony corals in Norway.
Credit : AP photo, Geomar, Karen Hissman

“The oceans are facing major threats due to rising levels of carbon dioxide in the atmosphere,” said Braulio Terreira de Souza Dias, the Convention’s executive director, in a statement accompanying the report.
“In addition to driving global climate change, increasing concentrations of carbon dioxide affect ocean chemistry, impacting marine ecosystems and compromises the health of the oceans and their ability to provide important services to the global community.”

Wednesday’s report is intended to be the most up-to-date compilation of what we currently know about ocean acidification — one of the biggest and least talked about effects of global warming — and what we know so far about its effects.
It draws on hundreds of peer-reviewed papers published in the last few years to provide a comprehensive guide.

Here are some of its most important takeaways.

More than a quarter of all CO2 emitted is absorbed by the ocean


Not all greenhouse gas emissions from power plants and other sources end up in the atmosphere. According to the report, more than 25 percent of all carbon emissions are absorbed into the ocean.
When the carbon enters the ocean, it dissolves, forming carbonic acid.
The carbonic acid then dissociates, and forms bicarbonate ions and hydrogen ions. As the hydrogen ions increase, so does the ocean’s acidity.

The acidity that results does not mean that the ocean is actually acid, or falling below a pH level of 7.0.
The term “acidification” refers only to the process of the oceans becoming less alkaline than they were previously. It is possible, however, that oceans could eventually fall into the acid category if emissions keep rising over the next 100 years.

An acidic ocean hurts marine life, and therefore hurts the economy

 From left the right, this graphic shows the direct impacts of putting CO2 into the ocean, and how those impacts effect ecosystems, food security, and coastal protection, among other things.
 credit : CDB.INT

Increased ocean acidity impacts the ocean in a number of ways.
Directly, it can make it harder for coral and some plankton to produce their skeletons and shells, and increase the risk of those shells dissolving.
Acidification can also change the behavior of marine fish and some invertebrates, making them more susceptible to predators.
The U.N. study cited reef fish larvae as an example, observing that fish exposed to elevated CO2 lost their abilities to distinguish between different habitat types, to distinguish between kin and non-kin, and to smell predators.
Fish, the report said, become “no longer able to learn.”

In all, acidification harms ocean ecosystems, which is bad for humans because ocean ecosystems “help create human well-being and economic wealth,” the report says.
Specifically, ocean ecosystems support a number of industries: commercial fishing, shellfishing, tourism, leisure and recreation.
Reduced coral health can impact their natural defense of erosion, making it more costly to maintain coastlines.

The U.N. report admits that more research needs to be done on the extent of harm that will be done to these industries because of acidification, and the uncertainty makes it difficult to estimate the economic impacts.
At least one study, though, determined that the global economy would lose up to $1 trillion in services like coastline maintenance by 2011, just because of impacts on coral reefs.
Those estimated losses don’t include effects on tourism or other industries.

The economic impacts of ocean acidification are already being felt

Rising acidity levels in the oceans have posed a serious threat to shellfish, particularly oysters
Credit : AP photo, Ted S. Warren

The U.N. report cited “strong evidence” that acidification is already negatively impacting shellfisheries off the northwest coast of the U.S., partially because the pH of the water there is already so low.
Oyster hatcheries in Oregon and Washington, the report said, have been suffering high death rates in larvae — up to 80 percent — since 2006.
The pH of the hatchery’s water are “major factors” affecting that death rate, the study said.

The problem at one point threatened the viability of that industry, which the report says has a total economic value of about $280 million every year.
Fortunately, those businesses have been able to recover their operations for now.
“The oyster hatcheries have now adapted their working practices so that they avoid using very low pH seawater, either by re-circulating their seawater or treating their water during upwelling events,” the report said.
“With these new practices, the north-west coast oyster hatcheries are producing near to full capacity again.”

If we don’t stop acidification soon, fixing it could take thousands of years

This graphic shows how the pH level of the ocean would change 
in the “business as usual” scenario predicted by the IPCC.
credit : CDB.INT

One of the most jarring aspects of the U.N. report is its observations of historical evidence to see how long it would take to restore oceans to normal after an acidification period.
The Paleocene-Eocene Thermal Maximum (PETM), or about 56 million years ago, likely had carbon content closest to the content we have today, the report said.

It’s not a perfect analogy, the report says, as the carbon that was concentrated in the ocean 56 million years ago was naturally accumulated over thousands of years, not man-made over tens or hundreds of years like today.
Back then, an estimated 2000-3000 petagrams of carbon was released into earth’s atmosphere over 10,000 years.
Now, the IPCC predicts the world will release 5000 petagrams of carbon into the atmosphere over the next 500 years if we follow a “business as usual” scenario.
The geological record shows that it took approximately 100,000 years for the oceans to return to the pH level we now consider to be “normal” after the PETM.
That leads scientists to believe that, absent some sort of remedy, it could take a similar amount of time for our ocean to return back to normal as well.
“We can see that ocean acidification is not a short-lived problem,” the report reads, “and [it] could take many thousands of years to return to pre-industrial levels even if carbon emissions are curbed.”

Links :

Thursday, October 9, 2014

There's a chart for that

New York Harbor C.&G.S. 541

From Martha'sVineyard Mag by Remy Tumin

For two Island ferry captains, the end of paper nautical charts only makes them more precious.

Give Peter Wells a chart and he can go anywhere.
Forget a boat; all the Chappy Ferry captain needs is a nautical chart and he’s a world traveler.

The knickknacks, boats in the yard, and collectibles stacked around Wells’s Chappaquiddick home indicate this is someone who is intrigued by plenty of things, and for whom the imagination is easily accessible.
His charts are neatly stacked in large gray drawers, ready to pull out at a moment’s notice.
“The great thing about maps and charts is you can wander freely all over the earth,” he says.
“There’s no fence to stop you, no trespassing signs. It’s all information. And if you have information, you have access.”


Peter Wells, shown at the helm of the Chappy Ferry,
has collected nautical charts since he was in grade school

He has collected nautical charts since he was in sixth grade when he began working at Avery’s, a general store on Main Street in Edgartown that is now home to Sundog.
Charts were frequently updated to reflect changes in the location of buoys or obstructions, and old ones were taken out of circulation.


These changes were gold for a young Wells.
“When the new charts came out, I started taking some of the charts home because all we did was cut them up to make little memo pads,” he says.
“At home in the living room, I would lay out the charts of Long Island – there were six or eight of them, from New York to Cuttyhunk – and I’d lay them out. It was like you were up in a plane and you could see the world laid out at your feet.”

Wells had a flat trundle tray under his bed as a kid.
When the charts got wrinkled, he would take to the ironing board.
“My sisters would give me a lot of crap for that,” he laughs.
“Oh, Pete’s doing some ironing, take the curtains up there while he’s at it. I just wanted to flatten them out! It’s just a piece of paper, but look at all that stuff somebody’s drawn on there.”


Wells is shy to put a number to how many charts he’s amassed over the years.
In addition to his own collection, an uncle bequeathed him his collection just before he died.
Some of them are on display, but most are safely stashed away.
He pulls them out of their respective trays one by one like delicate sheets of tissue.
“If you go on the internet you can see this whole shoreline, but not in a big chunk like this,” he says.
“If you’re going to take a ship from the U.S. to Africa, you’d like to see both points on one chart.”

The chart in question is one he bought as part of a small spending spree after hearing the news last year that the federal government would no longer be publishing new paper charts, and would instead only offer them electronically through a print on-demand system.
“I just got this because it’s a shame they’re not going to be printing anymore,” he says.
“I was scared and it was an excuse to get it. Look at all the detail on this stuff. It’s a great thing.”

He also bought a chart of Balboa Island in California; a car ferry there is the model for the Chappy Ferry.
“I thought, well, I better get one of those because I’d like to go visit them someday,” Wells says.
“This way before you go there you can feel like you’ve already been there, you can look over the whole thing.”

And Lake Tahoe, another place he’d like to visit someday.
“There’s a ferry boat there, look at the depths – it’s four hundred feet deep,” he says, nearly breathless.
“Vineyard Sound only gets to one hundred feet deep.”

And Newfoundland: “Look at all the writing and little channels. There’s so much going on there and you can go there, just by having this in your lap.”

As it happens, Wells is not the only Vineyard ferry captain with a weakness for nautical charts. Captain David Dandridge of the Steamship Authority has been taking care of charts since the 1980s, when he worked on a research ship for Columbia University as second mate.
“That ship went all over the world, around and around. We had charts of the whole world onboard,” he says, rocking backward in his chair.
“In working with them I found there were all these charts, most of them published by the British Admiralty, that were using information and images from the nineteenth century. They were by far the most beautiful charts of all the ones we had.”


Captain David Dandridge of the Steamship Authority in his chart room.

As with most collectible items, Dandridge says finding a chart of interest can be challenging.
He’s dealt with old book dealers, poked around the antique shops, and traded some on and off over the years.
As a collector, he’s most interested in old charts from the nineteenth century.
But nonetheless, he sees the end of new paper charts* as a turning point.

“You can recognize it as an end of an era,” he says of the antique charts, which can run upwards of $1,000 today. “What the U.S. government did in terms of gathering data and turning it into a presentable utilitarian format was, in my mind, the pinnacle of government function.”

Preparing accurate charts of the coast began in 1807 when President Thomas Jefferson signed into effect “an act to provide for surveying the coasts of the United States.”
The new U.S. Office of Coast Survey was responsible for hydrographic surveys and producing nautical charts, mapping the entire coastline.
The Island’s own Henry Whiting was a topographer for the Survey between 1838 and 1897.
“The degree to which the coastal survey combined hydrographic and topographic information was without equal,” says Dandridge, and the charts from the late nineteenth century were “without comparison.”


It was slow, expensive, methodical work that only began with taking measurements and soundings. For instance, it took close to twenty years to gather the data and complete an 1870 chart of Block Island Sound in his collection.
“Charts had to be engraved on copper plates,” he says.
“Somebody had to draw the chart and that had to be transferred reversed onto a copper plate. Then a man had to cut out each little speck to create the copper plate form so the printing could be done.”

Dandridge has one chart that was once housed in the offices of the Survey itself in Washington, D.C. On the bottom of the chart is a handwritten note that says: “the engraving of this chart I was told cost $100 a square inch.”

Dandridge stores many of his charts, but keeps a few others on display throughout his Lagoon Pond home.
The stairway tells a story of oceans near and far.
From storage he brings out a large chart of Portugal.
The detailed lines hang from one end of the paper to the other like a rigging of a ship.
It is a nineteenth century chart with depths and coves labeled in perfect script.
“It’s representative of the end of the style of private printing,” he says.
“There’s different presentation of the lines and multiple compass roses, a more elaborate legend and a great many ports along that shore.”
“Why did we get away from this?” he asks.
“Isn’t that elegant?”

* Note : Reader Feedback
I'm sorry Capt. Wells was under the impression that NOAA is ending paper charts. We are not. The difference is that NOAA-certified companies are printing them instead of the federal government. The Office of Coast Survey still maintains and updates the full suite of over 1,000 paper charts (in digital format for printing or viewing). You can see them all -- and find a NOAA-certified paper chart distributor -- at nauticalcharts.noaa.gov -

Dawn Forsythe, NOAA Office of Coast Survey , Silver Spring

Links :

Wednesday, October 8, 2014

Beyond the Nobel: What scientists are learning about how your brain navigates

Edvard and May-Britt Moser's discoveries - in particular the "grid
cells" - which the magazine Science described as the most important finding
in the field for two decades - are quite remarkable.
They have shown how the brain calculates the position of the organism in its spatial environment, completely overturning prior conventional thinking in the field.

From BBC by James Gallagher

The Nobel Prize for physiology or medicine has been awarded to three scientists who discovered the brain's "GPS system".

UK-based researcher Prof John O'Keefe as well as May-Britt Moser and Edvard Moser share the award.
They discovered how the brain knows where we are and is able to navigate from one place to another.
Their findings may help explain why Alzheimer's disease patients cannot recognise their surroundings.
"The discoveries have solved a problem that has occupied philosophers and scientists for centuries," the Nobel Assembly said.


Place cells, discovered by John O’Keefe, reside in the brain’s hippocampus and become active when a rat is in a certain spot. In the nearby entorhinal cortex, grid cells, discovered by May-Britt Moser and Edvard Moser, fire at regularly spaced intervals as an animal moves through space, forming a hexagonal pattern. (see illustration)

Inner GPS

Prof O'Keefe, from University College London, discovered the first part of the brain's internal positioning system in 1971.
On hearing about winning the prize, he said: "I'm totally delighted and thrilled, I'm still in a state of shock, it's the highest accolade you can get."

His work showed that a set of nerve cells became activated whenever a rat was in one location in a room.
A different set of cells were active when the rat was in a different area.
Prof O'Keefe argued these "place cells" - located in the hippocampus - formed a map within the brain.
He will be having a "quiet celebration" this evening and says the prize money "should be used for the common good".

Mapping

In 2005, husband and wife team, May-Britt and Edvard, discovered a different part of the brain which acts more like a nautical chart.
These "grid cells" are akin to lines of longitude and latitude, helping the brain to judge distance and navigate.

They work at the Norwegian University of Science and Technology in Trondheim.
Prof May-Britt Moser said: "This is crazy, this is such a great honour for all of us and all the people who have worked with us and supported us."
The Nobel committee said the combination of grid and place cells "constitutes a comprehensive positioning system, an inner GPS, in the brain".

They added: "[This system is] affected in several brain disorders, including dementia and Alzheimer's disease.
"A better understanding of neural mechanisms underlying spatial memory is therefore important and the discoveries of place and grid cells have been a major leap forward to advance this endeavour."

'Cognitive revolution'

Dr Colin Lever, from the University of Durham, worked in Prof O'Keefe's laboratory for ten years and has already dreamt on two occasions that his former mentor had won the award.

He told the BBC: "He absolutely deserves the Nobel Prize, he created a cognitive revolution, his research was really forward thinking in suggesting animals create representations of the external world inside their brains."
"Place cells help us map our way around the world, but in humans at least they form part of the spatiotemporal scaffold in our brains that supports our autobiographical memory.
"The world was not ready for his original report of place cells in 1971, people didn't believe that 'place' was what best characterised these cells, so there was no great fanfare at that time.
"But his work on hippocampal spatial mapping created the background for discovering grid cells and with grid cells, the world was prepared and we all thought wow this is big news."

Links :
  • Wired : Beyond the Nobel: What Scientists Are Learning About How Your Brain Navigates
  • NYTimes : Nobel Prize in Medicine Is Awarded to Three Who Discovered Brain’s ‘Inner GPS’
  • NYTimes : Is GPS All in Our Heads?
  • BostonGlobe : Do our brains pay a price for GPS?
  • NPR : The GPS in your head may work a lot better than that phone

Tuesday, October 7, 2014

Different depths reveal ocean warming trends

 Inaccurate temperature readings of Southern Hemisphere oceans have led to global warming being underestimated.
The team studied rising temperatures of the southern hemisphere over the decades between 1970 and 2004, and recommended increasing estimates of the rate of ocean warming by between 48% and 152%.

From BBC by Jonathan Webb

The deeper half of the ocean did not get measurably warmer in the last decade, but surface layers have been warming faster than we thought since the 1970s, two new studies suggest.

Because the sea absorbs 90% of the heat caused by human activity, its warmth is a central concern in climate science.
The new work suggests that shallow layers bear the brunt of ocean warming.
Scientists compared temperature data, satellite measurements of sea level, and results from climate models.
Both the papers appear in the journal Nature Climate Change.

The Antarctic Ocean is a remote place where icebergs frequently drift off the Antarctic coast and can be seen during their various stages of melting.
This iceberg, sighted off the Amery Ice Shelf, also has bands of translucent blue ice formed by sea or freshwater freezing in bands between layers of more compressed and white glacial ice.
Image by Andrew Meijers/BAS

Underestimation
 
Specifically in the Southern Hemisphere where fewer measurements have been made, a team of researchers from the Lawrence Livermore National Laboratory in California investigated long-term warming in the top 700m of the ocean.

They wanted to compare published warming rates, based on the sparse temperature data recorded directly from southern waters, with what could be predicted based on more detailed observations in the north, together with climate models and precise sea-level measurements.

Sea levels across the planet are accurately assessed by satellites, which bounce radio waves off the ocean surface.
And sea level changes are closely related to ocean temperature, because the water expands as it warms up.

By combining these calculations, the scientists found that the rate of upper-ocean warming between 1970 and 2004 had been seriously underestimated.
That inaccuracy is specific to the Southern Hemisphere, but is big enough, the scientists suggest, that global upper-ocean warming rates are also "biased low" - to the tune of 24% to 55%.
The researchers say the underestimation probably arose simply from the scarcity of measurements in the south.
"It's likely that due to the poor observational coverage, we just haven't been able to say definitively what the long-term rate of Southern Hemisphere ocean warming has been," said lead author Dr Paul Durack.
"It's a really pressing problem - we're trying as hard as we can, as scientists, to provide the best information from the limited observations we have."

Dr Jan Zika, an oceanographer at the University of Southampton, agreed that Dr Durack's work highlighted the need for more data.
"It could be that the heat uptake by the ocean is a stronger contribution than we previously thought," he told BBC News.
Storage of heat in the oceans is the best explanation scientists have for the recent "'slowdown'" in the rise of global surface temperatures.
Dr Zika added that the heat content of shallow layers is a particular concern, as that warmth is more likely to return to the atmosphere.
"If it were getting really deep down, then we might think that it's basically stuck there," he said.

Obscure depths
 
Meanwhile, at depths greater than 2km, temperatures appear relatively stable - at least as far as changes can be detected.
That was the outcome of the second study, in which a team from the California Institute of Technology made thorough use of the vastly improved data coverage that has been delivered by the Argo programme of remote, floating probes.

 Akin to having a fleet of miniature research vessels, the global flotilla of more than 3,600 robotic profiling floats provides crucial information on upper layers of the world's ocean currents.
Photo by Alicia Navidad/CSIRO.

These devices started to be deployed in 1999 and there are now more than 3,600 of them adrift in our planet's oceans.
Argo "floats" only record temperatures down to about 2km beneath the surface, so the Caltech researchers used that information to calculate the overall amount of heat absorbed by the upper 2km of the oceans (approximately the top half).
Then, by subtracting that quantity of heat from the total ocean warming indicated by satellite observations of sea level, they estimated how much the deeper half of the ocean (below 2km) had warmed up.
The result: once the high level of uncertainty associated with the calculations was taken into account, there was no change detected in the deep.
"Combining those different observations, we ended up with a large uncertainty in our estimate," explained Dr William Llovel, the study's lead author.
"But on the other hand, it is a global estimate. We're not using just a few observations from the deep ocean itself."

 Global mean sea-level variations :
The estimates are observed variations by satellite altimetry (blue), ocean mass contributions based on GRACE data (solid black) and steric sea level based on in situ observations (red).

In a commentary for Nature Climate Change, Dr Gregory Johnson and Dr John Lyman, both from the National Oceanic and Atmospheric Administration in Seattle, US, said the results pointed to a crucial gap in ocean measurements.
They suggested that clearer conclusions would come from the next generation of floating probes, known as Deep Argo.
The first such device was launched in 2013 and plunged 6km beneath the waves off Puerto Rico; two other prototypes were deployed off the New Zealand coast in June 2014.
"It is time to close the deep-ocean measurement gap and reduce the uncertainties in global planetary energy and sea-level budgets," wrote Dr Johnson and Dr Lyman.

Dr Zika agrees. "There are very clear, very plausible explanations for how the ocean could be taking up heat and offsetting global warming," he told the BBC.
"But to attribute exactly where that heat's going, and whether it'll pop back out or not, is going to take more observations. We need to get those in place."

Adapting to a Changing Ocean: A Global Society Perspective
David Victor is a professor of international relations and director of the Laboratory on International Law and Regulation at UC San Diego.
His research focuses on highly regulated industries and how regulation affects the operation of major energy markets.
He is the author of Global Warming Gridlock, which explains why the world hasn’t made much diplomatic progress on the problem of climate change and the search for new strategies.

Links :

Monday, October 6, 2014

NZ Linz update in the Marine GeoGarage

Coverage NZ Linz Marine GeoGarage layer

As our public viewer is not yet available
(currently under construction, upgrading to Google Maps API v3 as v2 is officially no more supported),
this info is primarily intended to
our iPhone/iPad universal mobile application users
(Marine NZ on the App Store) 
and our B2B customers which use our nautical charts layers
in their own webmapping applications through our GeoGarage API.  


5 charts has been updated in the Marine GeoGarage
(Linz September update published October 3rd, 2014 (Updated to NTM Edition 19)

  • NZ541 Mayor Island to Okurei Point
  • NZ542 Motiti Island to Pehitari Point
  • NZ5113 Plans in Rangaunu Bay
  • NZ5124 Plans in the Bay of Islands
  • NZ5413 Approaches to Tauranga
Today NZ Linz charts (183 charts / 323 including sub-charts) are displayed in the Marine GeoGarage.

Note :  LINZ produces official nautical charts to aid safe navigation in New Zealand waters and certain areas of Antarctica and the South-West Pacific.


Using charts safely involves keeping them up-to-date using Notices to Mariners
Reporting a Hazard to Navigation - H Note :
Mariners are requested to advise the New Zealand Hydrographic Authority at LINZ of the discovery of new or suspected dangers to navigation, or shortcomings in charts or publications.

US Navy to deploy armed, robotic patrol boats


From The Telegraph

Technology adapted from Nasa's rovers on Mars could transform how the American navy operates, officials say

The US Navy says it will soon use armed, robotic patrol boats with no sailors on board to escort and defend warships moving through sensitive sea lanes.
The technology, adapted from Nasa's rovers on Mars, will transform how the American navy operates, and is sure to raise fresh questions and concerns about the widening role of robots in warfare.

  During the demonstration as many as 13 Navy boats, using an ONR-sponsored system operated autonomously or by remote control during escort, intercept and engage scenarios.

The Office of Naval Research on Sunday released the results of what it called an unprecedented demonstration in August involving 13 robotic patrol craft escorting a ship along the James River in Virginia.
In a simulated scenario, five of the robotic patrol boats guarded a larger ship, while eight others were ordered to investigate a suspicious vessel.
The unmanned patrol boats then encircled and swarmed the "target," enabling the mother ship to move safely through the area.

 This Tuesday Aug. 12, 2014 photo provided by the U.S. Navy shows an unmanned 11-meter rigid hulled inflatable boat (RHIB) from Naval Surface Warfare Center Carderock, as it operates autonomously during an Office of Naval Research demonstration of swarmboat technology held on the James River in Newport News, Va
(AP Photo/U.S. Navy, John F. Williams)

The demonstration, conducted over two weeks, was designed to "replicate a transit through a strait," naval research chief Rear Admiral Matthew Klunder told reporters in a recent briefing.
"It could be the straits of Malacca, it could be the straits of Hormuz."
The demonstration was a "breakthrough" that goes far beyond any previous experiment, he said, adding that similar robotic patrol craft likely will be escorting US naval ships within a year.
The patrol craft, 11-yard long vessels known in the military as rigid hulled inflatable boats, are usually operated by three or four sailors.
But outfitted with the robotic system, a single sailor could oversee up to 20 of the vessels.

The inflatable boat operates autonomously
during an Office of Naval Research demonstration of swarmboat technology

There were no shots fired in the demonstration but Rear-Adml Klunder said the robotic craft can be outfitted with non-lethal equipment, such as lights and blaring sound, as well as 50-caliber machine guns.
And the vessels could fire on an enemy ship if ordered to do so by a sailor.
"We have every intention to use those unmanned systems to engage a threat," the admiral said.
"There is always a human in the loop of that designation of the target and if so, the destruction of the target."


For the demonstration, researchers had fail-safe systems in place to avoid any mishaps.
If communications with the patrol craft broke off, the vessels would go "dead in the water," said programme manager Robert Brizzolara.
And if the boats malfunctioned in some way, there were two separate communications links that could be used to halt the vessel.
Unlike drone aircraft, such as the famed Predator and Reaper planes, the robotic boats are more autonomous and can carry out directions without having to be operated by a human at every step.
"The excitement about this technology is it is autonomous," Rear-Adml Klunder said.
"So we're not talking about people having to drive with toggle switches."


The boats move in sync with other unmanned vessels, selecting the best route while sensing obstacles.
The US military sees the innovation as saving sailors' lives and strengthening the navy's edge.
But sceptics have warned of the dangers from the spread of armed robots – without sufficient rules and debate about their use.
The technology, which the navy has dubbed CARACaS, or Control Architecture for Robotic Agent Command and Sensing, is "very low-cost" and can be installed easily on the patrol boats or other ships, Rear-Adml Klunder said.

Eight unmanned high-speed maneuvering surface targets, at right, lead the way as five unmanned surface vehicles escort the Relentless.

"We're talking thousands [of dollars]. We're not talking millions to adapt what we already have – existing craft in our fleet," he added.
"So we're not going out and buying new patrol craft."
Evoking images from science fiction with fleets of robots waging war, Rear-Adml Klunder said the system could eventually be installed on larger naval ships.
And the robotic patrol craft could be used to transport teams of special operation forces, which already use the manned version of the boats.


Other government agencies and private firms are also taking a keen look at the unmanned boats.
"We're putting it out there to save sailors and marines' lives, to protect ships, to protect harbors and ports," Rear-Adml Klunder said.
The military unveiled the technology around the 14th anniversary of the attack on the USS Cole off the coast of Yemen.
The October 2000 attack, in which a small boat with explosives detonated near the US destroyer, killed 17 sailors and wounded 39 others.
"If we had this capability on that day, I'm sure we would have saved that ship," Rear-Adm Klunder said.

Links :

Sunday, October 5, 2014

Image of the week : 35,000 walrus converge on Alaska beach as sea ice retreats

Female Pacific walruses and their calves traditionally spend summers far from shore, diving for benthic invertebrates over the shallow continental shelf waters of the Chukchi Sea.
These female walruses and their calves prefer to rest between forage bouts on sea ice drifting above their feeding grounds.
However, in recent years loss of summer sea ice over the continental shelf has forced many walruses to travel to the northwest coast of Alaska where they haul-out on shore to rest.
This large herd of walruses hauled out near Pt. Lay Alaska in August of 2011.
(USGS)

From CNN by Brad Lendon

Arctic ice is dwindling, the waters of the North Pacific Ocean are the warmest on record and tens of thousands of walruses have taken notice, "hauling out" on an Alaskan beach in numbers never seen before.
Photos taken by scientists working for the National Oceanic and Atmospheric Administration show more than 35,000 walruses gathered, or hauled out, on a beach near the village of Point Lay, on the Chukchi Sea in northwest Alaska on Saturday.


The walruses are forced onto land when sea ice, which they use to rest between dives for food, disappears, according to NOAA. A report on Flight 240 of the Aerial Surveys of Arctic Marine Mammals, run by the National Marine Mammal Laboratory, shows no sea ice spotted on Saturday, but it showed 35,036 walruses on the beach near Point Lay, including 36 dead ones.


The number of walruses had mushroomed from an aerial survey only four days earlier, when just 1,500 were spotted at the haul-out near Point Lay.
About 50 dead walruses were spotted in that count.
A NOAA release from 2013 calls the large haul-outs a relatively new phenomenon.
Last year, a NOAA survey counted about 10,000 walruses on the beach near Point Lay.
In 2011, about 30,000 came ashore.
The large haul-outs were first noticed in 2007, NOAA said. (see USGS)

Aerial photography of a huge group of Pacific walruses that grew to an estimated 35,000, above, on Sept. 27, from 1,500 on Sept. 23, (previous picture).
Credit Corey Accardo/NOAA

"The massive concentration of walruses onshore -- when they should be scattered broadly in ice-covered waters -- is just one example of the impacts of climate change on the distribution of marine species in the Arctic," Margaret Williams, the World Wildlife Fund's managing director of the Arctic program, said in a statement.

Point Lay, near where the walruses gathered, is on the Arctic Ocean coast just above the Bering Sea. The WWF says other large haul-outs have been reported to the west of Alaska on Russian shores.
A report from the National Snow and Ice Data Center on September 22 said Arctic sea ice had reached its lowest extent of the year on September 17, the sixth-lowest amount of Arctic sea ice on record.


Tracking Pacific Walrus: Expedition to the Shrinking Chukchi Sea Ice

"We are witnessing a slow-motion catastrophe in the Arctic," Lou Leonard, vice president for climate change at the WWF, said in a statement last month.
"As this ice dwindles, the Arctic will experience some of the most dramatic changes our generation has ever witnessed. This loss will impact the annual migration of wildlife through the region, threaten the long-term health of walrus and polar bear populations, and change the lives of those who rely on the Arctic ecosystem for their way of life."

This year's ice report and massive walrus haul-out come the same month that a NOAA report said sea surface temperatures across a vast expanse of the North Pacific are 5.4 degrees Fahrenheit (3 degrees Celsius) higher than normal.
"Not since records began has the region of the North Pacific Ocean been so warm for so long," the NOAA report says.
A heat map accompanying the NOAA report shows deep red in the Bering Sea, indicating the biggest difference from normal in that expanse of water.
 
Links :
  • The Guardian : Are walrus at risk from climate change?
  • USGS : Walrus radio tracking