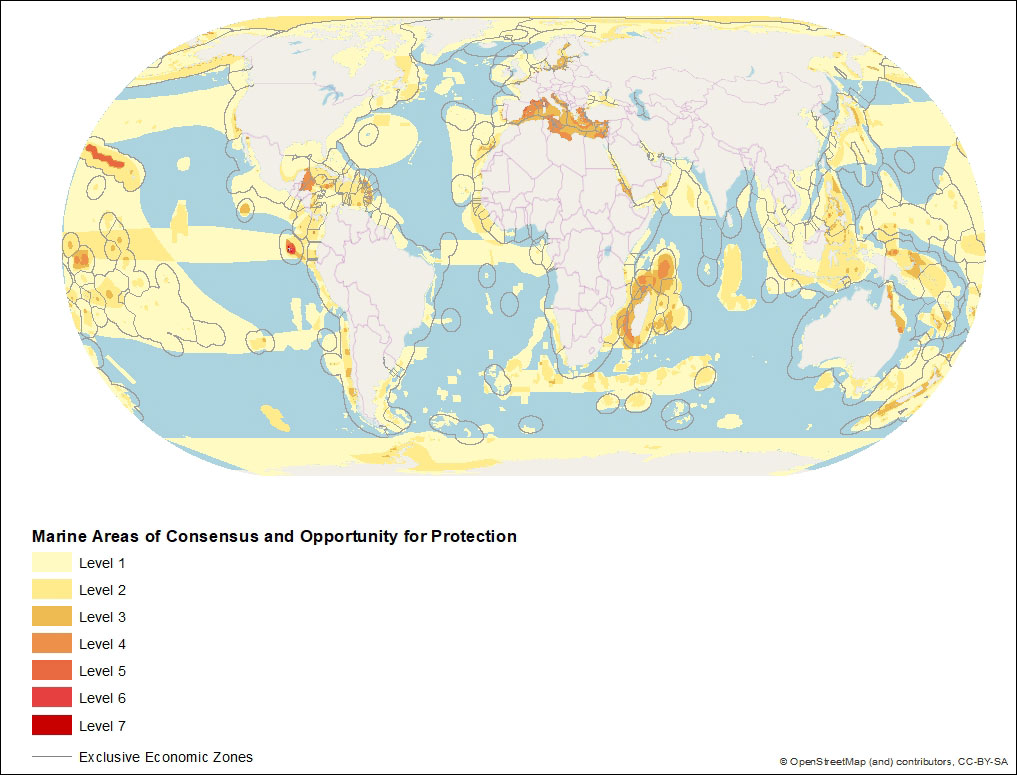
A new map shows areas of the ocean that conservationists agree are in need of protection.
Countries around the world have committed to protecting 10 percent of the planet’s coastal and marine areas by 2020 as part of the United Nations’ Sustainable Development Goals.
But it is not always easy for countries to agree on where the protected areas should be so they have the biggest conservation impact.
“The world has agreed to make ocean protection a priority, but how can we make sure it is effective?” asks Ellen Pikitch, who studies ocean conservation at Stony Brook University in New York.
“The diplomats say they need guidance.”
Pikitch and her colleagues were asked to create a map to help guide discussions about which areas are most in need of protection.
They collected 10 different maps identifying priority areas for conservation made by various UN agencies and conservation groups and overlaid them to see where the organizations agreed and checked which are already part of marine protected areas (MPAs).
The team found that 55 percent of ocean areas were identified as important by at least one organization and 14 percent were flagged by two to seven groups.
Of that 14 percent, the vast majority are not yet protected.
Many of the areas with a strong consensus of being a priority for protection, but little actual protection, are found in the Mediterranean Sea, the Caribbean Sea, around Madagascar and southern Africa, and in the part of the western Pacific Ocean known as the Coral Triangle.
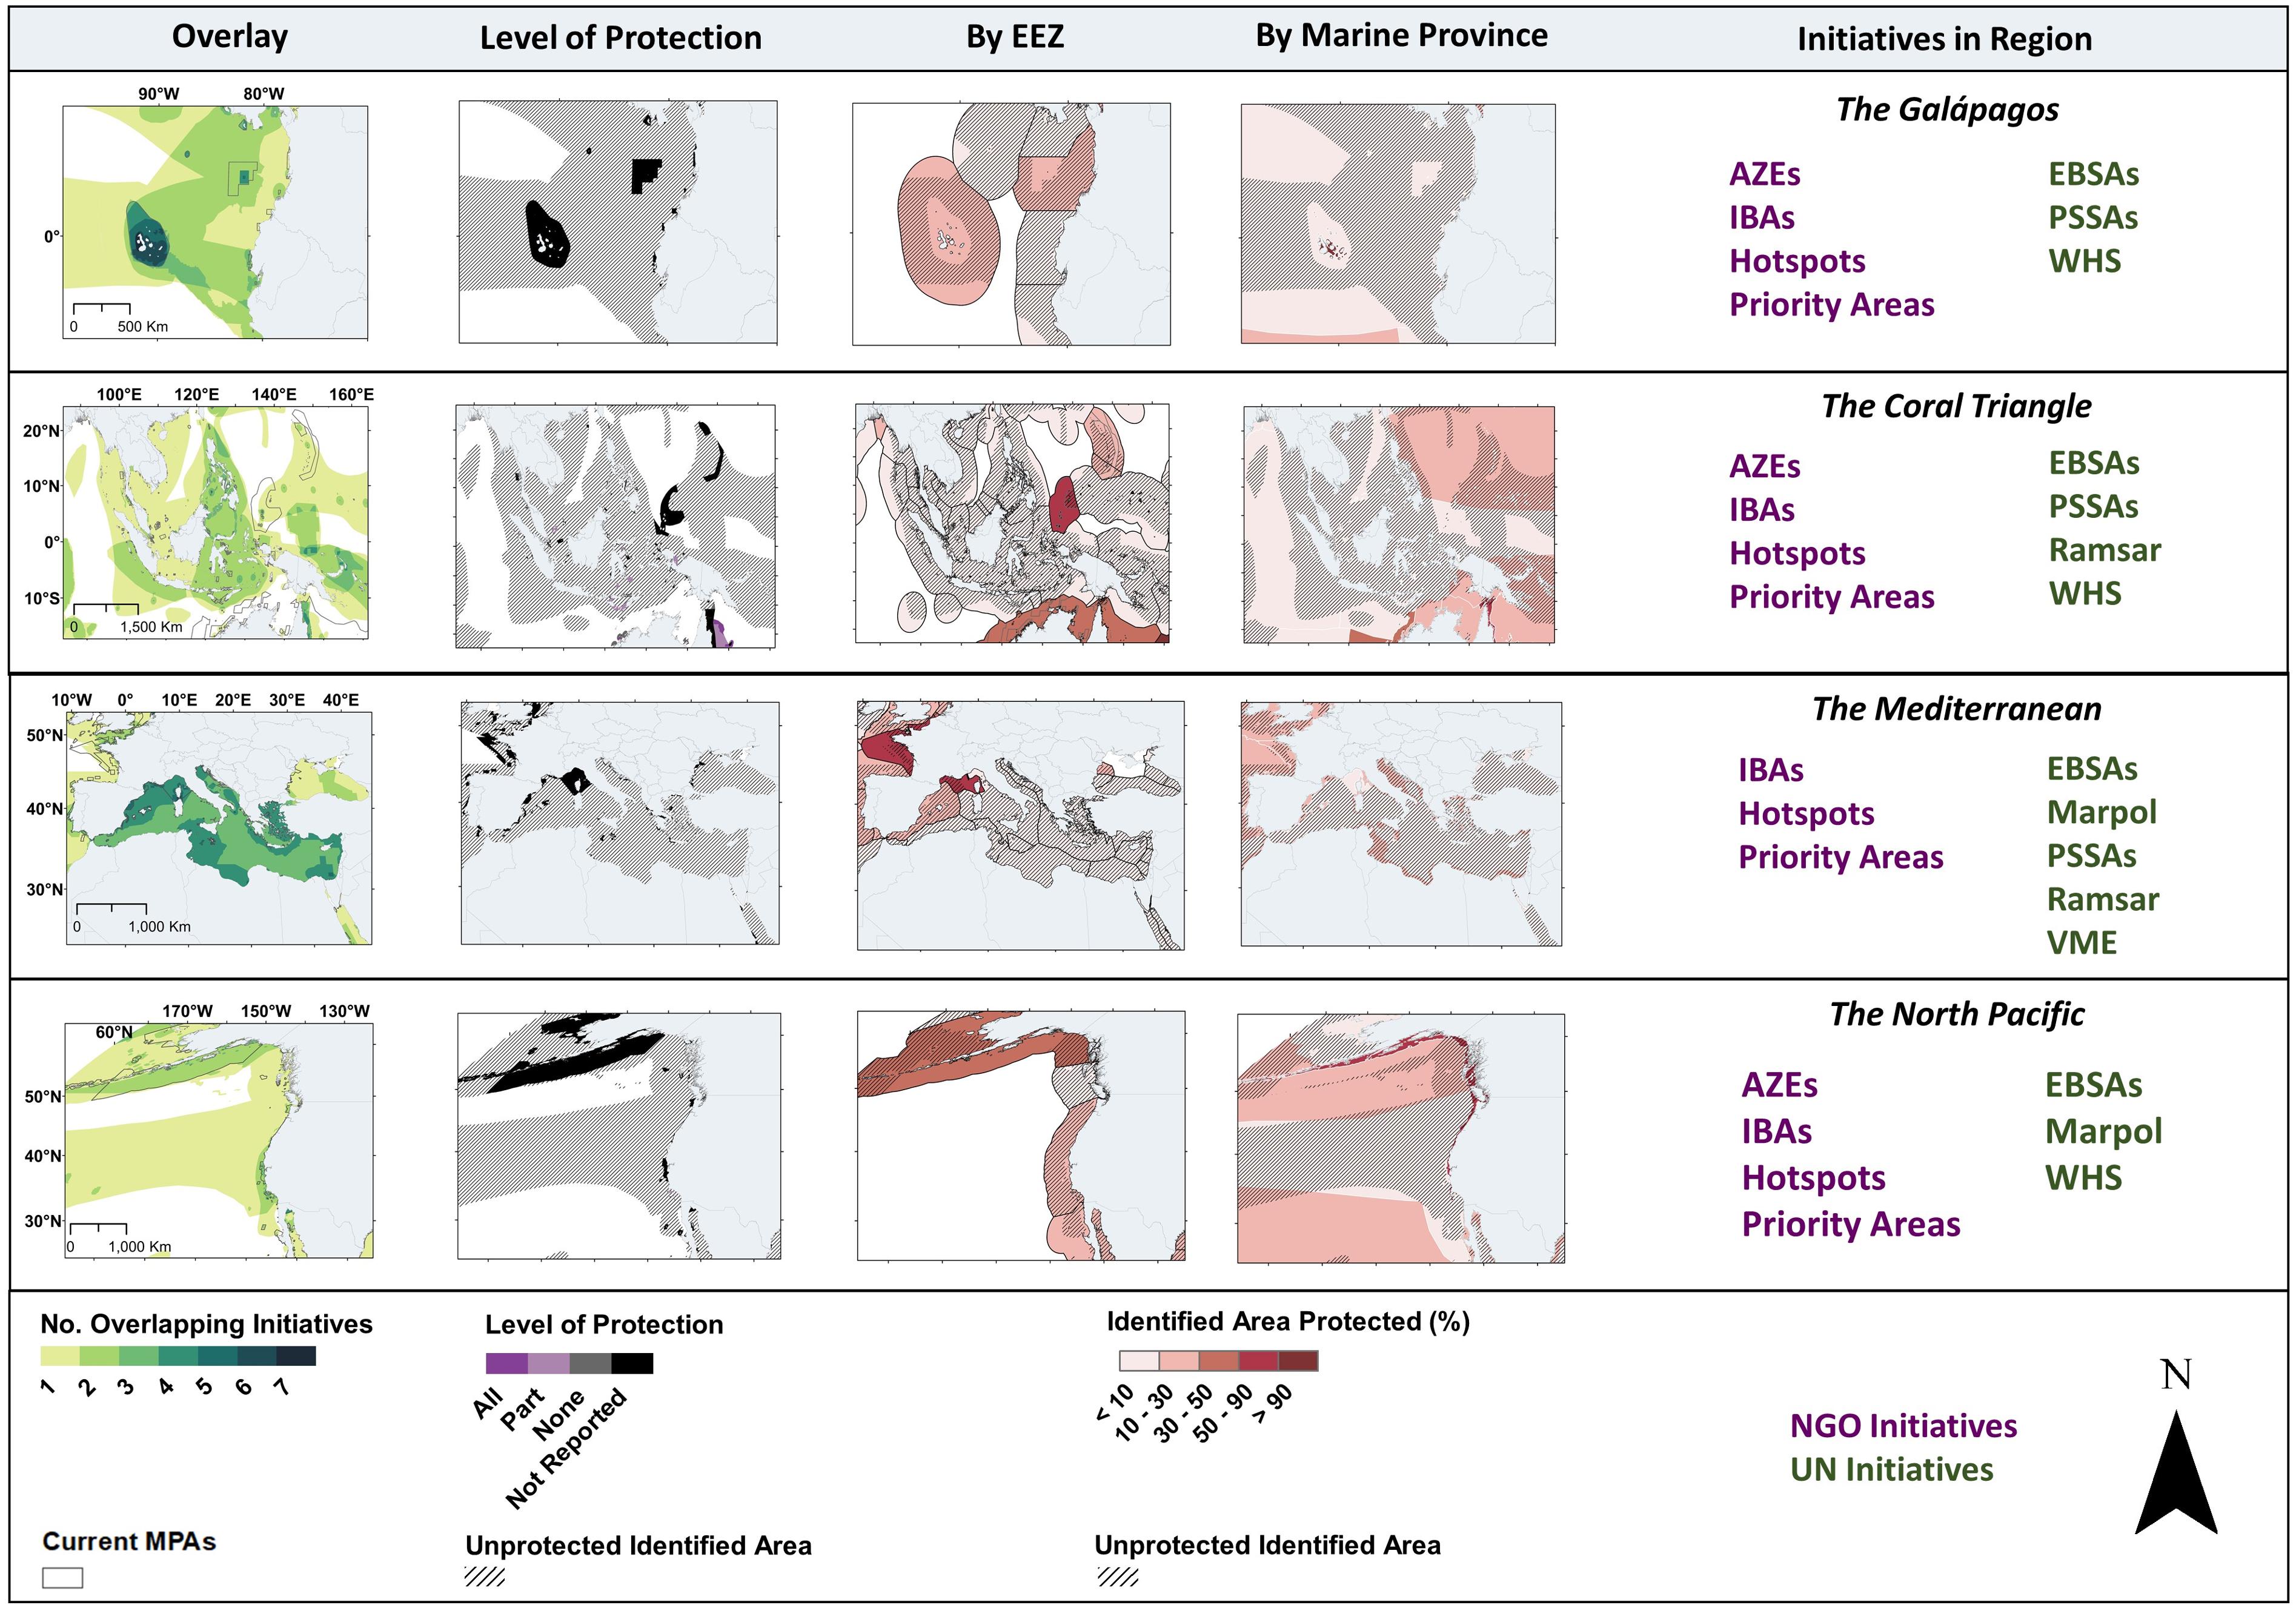
Examples of important marine areas with opportunities for stronger, more representative, and/or more widespread protection.
Areas were identified as important by six United Nations and four non-governmental organization initiatives that vary in purpose and scope.
For each region, information is provided on the number of overlapping initiatives, on the strength of current protection, on identified areas within marine provinces and on identified areas within EEZs, Exclusive Economic Zones
Pikitch will present the map, which was published in October, to the United Nations on December 4.
She hopes it will help provide guidance to those working on ocean protection by showing them where the opportunities are.
“Any organization can use this information to justify why an area should be protected or to find areas to work on,” she says.
Anna Metaxas, an oceanographer at Dalhousie University in Halifax, says the map will be useful when it comes to trying to protect parts of the high seas that are beyond national jurisdictions.
At the national level, many countries tend to follow their own priorities rather than scientific recommendations, she notes.
And in many places, such as in the Mediterranean, protecting priority areas will require cooperation among neighboring states—something that has rarely happened.
“When international organizations select areas based on conservation features, they often transcend borders,” she says.
“I don’t think the world is ready for that.”
Emily Darling, a conservation scientist with the Wildlife Conservation Society in Toronto, says that while the researchers were focused on MPAs, it is also important to appreciate that MPAs are just one tool for protecting the oceans, and they’re not always the most effective or appropriate.
MPAs work best when they have strong protections, such as preventing all fishing, but that often means local people lose access to the resources in those areas, which can cause conflict.
Maps like this one should be used, she says, not just for designating non-fishing MPAs but also for targeting areas that might benefit from softer protections that still allow for local resource use. Links :
Earth's climate is changing, and the study of oceans is vital to understanding the effects of those changes on our future.
For the first time, U.S and European agencies are preparing to launch a 10-year satellite mission to continue to study the clearest sign of global warming — rising sea levels.
The Sentinel-6/Jason-CS mission (short for Jason-Continuity of Service), will be the longest-running mission dedicated to answering the question: How much will Earth's oceans rise by 2030?
By 2030, Sentinel-6/Jason-CS will add to nearly 40 years of sea level records, providing us with the clearest, most sensitive measure of how humans are changing the planet and its climate.
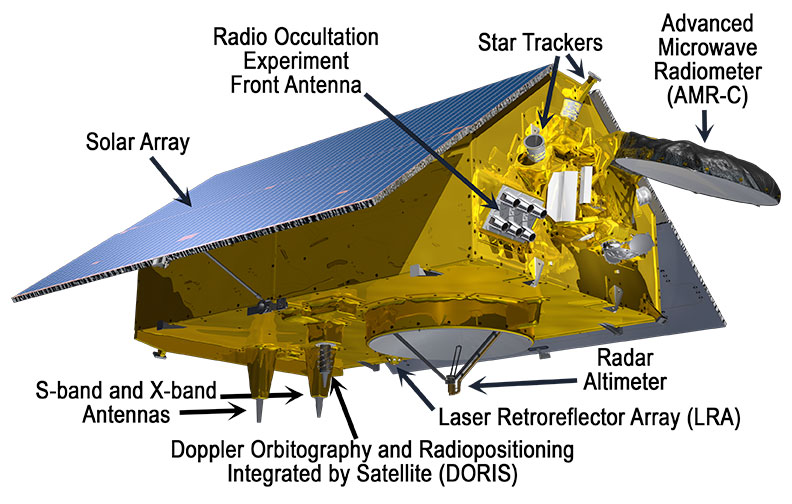
The mission consists of two identical satellites, Sentinel-6A and Sentinel-6B, launching five years apart.
The Sentinel-6A spacecraft was on display for the media on Nov.
15 for a last look in its clean room in Germany's IABG space test center.
The satellite is being prepared for a scheduled launch in November 2020 from Vandenberg Air Force Base in California on a SpaceX Falcon 9 rocket.
The Jason-CS/Sentinel-6 mission that will track sea
level rise, one of the clearest signs of global warming, for the next
10 years.
Sentinel-6A, the first of the mission's two satellites, is
shown in its clean room in Germany and is scheduled to launch in
November 2020.
Credits: IABG
Sentinel-6/Jason-CS follows in the footsteps of four other joint U.S.-European satellite missions — TOPEX/Poseidon and Jason-1, Ocean Surface Topography/Jason-2, and Jason-3 — that have measured sea level rise over the past three decades.
The data gathered by those missions have shown that Earth's oceans are rising by an average of 0.1 inches (3 millimeters) per year.
Sentinel-6/Jason-CS will continue that work, studying not just sea level change but also changes in ocean circulation, climate variability such as El Niño and La Niña, and weather patterns, including hurricanes and storms.
Global sea level rise is, in a way, the most complete measure of how humans are changing the climate," said Josh Willis, the mission's project scientist at NASA's Jet Propulsion Laboratory in Pasadena, California.
"If you think about it, global sea level rise means that 70% of Earth's surface is getting taller — 70% of the planet is changing its shape and growing.
So it's the whole planet changing.
That's what we're really measuring."
Decades of space- and ground-based observations have documented Earth's surface temperature rising at a rapidly accelerating rate.
The oceans help to stabilize our climate by absorbing over 90% of the heat trapped on the planet by excess greenhouse gases, like carbon dioxide, that have been emitted into the atmosphere since the start of the Industrial Revolution.
As the oceans warm, they expand, increasing the volume of water; the trapped heat also melts ice sheets and glaciers, contributing further to sea level rise.
The rate at which it is rising has accelerated over the past 25 years and is expected to continue accelerating in years to come.
Sentinel-6/Jason-CS will measure down to the millimeter how much global sea level rises during the 2020s and how fast that rise accelerates.
As the rate increases, humans will need to adapt to the effects of rising seas — including flooding, coastal erosion, hazards from storms and negative impacts to marine life.
Along with measuring sea level rise, the mission will provide datasets that can help with weather predictions, assessing temperature changes in the atmosphere and collecting high-resolution vertical profiles of temperature and humidity.
As with its Jason-series predecessors, Sentinel-6/Jason-CS will gather global ocean data every 10 days, providing insights into large ocean features like El Niño events.
However, unlike previous Jason-series missions, its higher-resolution instruments will also be able to provide data on smaller ocean features — including complex currents — that will benefit navigation and fishing communities.
"Global sea level rise is one of the most expensive and disruptive impacts of climate change that there is," said Willis.
"In our lifetimes, we're not going to see global sea level fall by a meaningful amount.
We're literally charting how much sea level rise we're going have to deal with for the next several generations."
Sentinel-6/Jason-CS is being jointly developed by the European Space Agency (ESA), the European Organisation for the Exploitation of Meteorological Satellite (EUMETSAT), NASA and the National Oceanic and Atmospheric Administration (NOAA) with funding support from the European Commission and support from France's National Centre for Space Studies (CNES).
NASA's contributions to the Sentinel-6 mission are science instrument payloads for the two Sentinel-6 satellites, launch services for those satellites, ground systems supporting the science instruments operations and support for the international Ocean Surface Topography Science Team.
AIS tracks from a number of vessels have appeared circling over Point Reyes near San Francisco even though the ships can be confirmed to be thousands of miles away.
False circling tracks from five vessels are shown here.
AIS data courtesy of Global Fishing Watch / Orbcomm / Spire.
The locations of twelve ships as reported by their Automatic Identification Systems (AIS) were thousands of miles in error.
Most were displayed as circling an area northwest of San Francisco according to the environmental non-profit SkyTruth.
The circling phenomena has been previously observed in GPS-based reporting systems for fitness trackers in China and Iran, and for shipboard systems near a variety of Chinese ports.
In all those cases, though, it was clear that the real location was fairly nearby the false and circling locations.
The colored lines show AIS tracks from five of the ships whose broadcast positions jumped suddenly to Point Reyes, California, northwest of San Francisco.
The time of the tracking disruption varies from less than one hour for one vessel to about two weeks for some others.
Two of the vessels (Princess Janice and Alkahfi Maryam) also have tracks appearing over land in North America.
The reason for this displacement is unknown although some of the vessels are in areas where GPS disruption has been reported (Eastern Mediterranean and Sea of Azov).
AIS data courtesy of Global Fishing Watch / Orbcomm / Spire.
In the most recent observations, the real locations of the ships were thousands of miles away.
Literally on the other side of the globe in most cases.
These findings were briefed at the annual meeting of the Resilient Navigation and Timing Foundation on the 5th of May.
The researcher, Bjorn Bergman of SkyTruth, said that he was able to verify the vessels’ approximate true location by examining the field of view of the satellite receiving the AIS position reports.
A satellite that could only see the Gulf of Guinea in West Africa, for example, received AIS information that placed the vessel offshore of Pt Reyes in northern California.
The vessels’ true locations were also confirmed by their position reporting before and after the “displacement” events.
Broadcast AIS positions from Princess Janice.
The track makes multiple jumps between a real location in an oil terminal on the coast of Nigeria (inset lower right) and false positions over the United States.
Over two weeks in June 2019 the false track initially circles over Point Reyes northwest of San Francisco before veering over the Pacific and over the interior of the United States.
More circling is seen around Salt Lake City Utah (inset upper right).
AIS data courtesy of Global Fishing Watch / Orbcomm / Spire.
When asked at the briefing if this was the result of GPS spoofing or some fault in the vessels’ AIS system, Bergman replied that he was uncertain.
It is fairly clear that previous vessel “circling” incidents in China were some form of GPS interference.
GPS-based fitness tracker reporting was similarly affected in the same area and at the same time.
There are, as of now, no similar supporting data for these long-range maritime displacement and circling events.
Analysis is also hampered by the low number of vessels involved.
Bergman has only found twelve instances of this kind of behavior.
Princess Janice broadcasts an AIS track over Point Reyes near San Francisco and over the Western United States from June 5 – 21, 2019 (see Image 3).
Analysis of the footprints for the satellites receiving these positions demonstrates that the vessel was actually within a region on the central Nigerian coast and adjacent Gulf of Guinea.
Frame 1: Location over the Earth’s surface (red dots) of satellites receiving false position messages.
Frame 2: Extent of satellite footprints for AIS reception (large red circles).
Frame 3: Density of satellite coverage overlap, areas of increasing density shown as Blue → Green → Yellow → White.
Frame 4: Area where all satellite footprints overlap (maximum coverage) shown in white.
The white shaded region on the central Nigerian coast contains the true location of the Princess Janice during the period when the vessel was broadcasting a false location track.
Analysis was done in Google Earth Engine using approximate satellite footprints of 5,000 km (3,100 miles) diameter.
Vessels showing a pattern of false circling AIS positions.
Reported
locations are where circling tracks appeared (mainly at Point Reyes
near San Francisco).
Real locations are where the vessel was determined
to be while broadcasting the false circling AIS track.
AIS data courtesy
of Global Fishing Watch / Orbcomm / Spire.
Further deepening the mystery is that the vessels are of much different types and operations.
Pilot boats, work boats, tugs, cargo, and passenger vessels have all been involved.
And these vessels have been located in every region of the world save North America.
The length of these disruptions has also varied greatly.
The shortest recorded was a reefer ship for less than half an hour.
A crew boat was “displaced” for over 16 days.
Most of the vessels reported circling positions off the coast of Northern California, though two were displaced to Madrid, one to the vicinity of Hong Kong and another to the Chinese city of Shanwei.
The vessel impacted for the longest time first reported a false position offshore of northern California.
Over the following days the false location drifted almost a thousand miles to the east moving inland as far as Utah.
The Russian flagged cargo ship Berezovets transits through the Sea
of Azov in June 2019 and has its AIS track jump suddenly to Point Reyes
near San Francisco (inset).
Incidents of documented GPS disruption
occurred in March 2019 east of the Bilosarai Spit and in July 2019 in
the city of Starohnatvka.
AIS data courtesy of Global Fishing Watch /
Orbcomm / Spire.
Bergman openly admits that he is at a loss to explain this phenomenon.
It seems to be related to GPS and the kind of “circle spoofing” previously observed in China and Iran.
Yet the lack of much commonality between the vessels and incidents makes any further deductions or inferences difficult.
For now, it remains a true mystery.
The RNT Foundation is encouraging anyone with insights or ideas to send them to inquires@RNTFnd.org to be shared with Mr. Bergman and other analysts.
Mr Bergman has also recently posted a short paper on these instances on SkyTruth’s website
A video of Bergman’s presentation at the RNT Foundation’s annual meeting is available below.
Russian prosecutors have ordered checks at "particularly dangerous installations" built on permafrost after a huge oil spill in the Arctic.
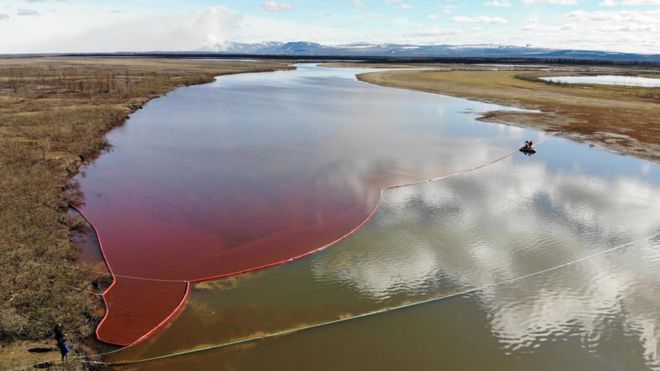
An emergency was declared after 20,000 tonnes of diesel leaked into a river when a tank at a power plant near the city of Norilsk collapsed last Friday.
Initial Russian inquiries suggest ground subsidence as the cause.
The plant is owned by a subsidiary of Norilsk Nickel, which is the world's leading nickel and palladium producer.
Arctic permafrost has been melting in exceptionally warm weather for this time of year.
What checks have been ordered exactly?
Russia's chief prosecutor, Igor Krasnov, gave orders for regional and environmental prosecutors to conduct a "thorough check" of "particularly dangerous installations" located on "territories exposed to permafrost melting".
The aim is to prevent a repeat of the incident at the plant near Norilsk.
A spokesman for Mr Krasnov's department told Russian media prosecutors would assess companies' adherence to safety laws, environmental monitoring and measures to prevent emergencies.
The effectiveness of state monitoring would also be assessed, he said. What is permafrost?
The term is used for ground that is frozen continuously for two or more years.
Some 55% of Russia's territory, predominantly Siberia, is permafrost and home to its main oil and gas fields.
A 2017 report to the Arctic Council, an international forum which includes Russia, warned that because of global warming and melting ice, foundations in permafrost regions could no longer support the loads they did as recently as the 1980s.
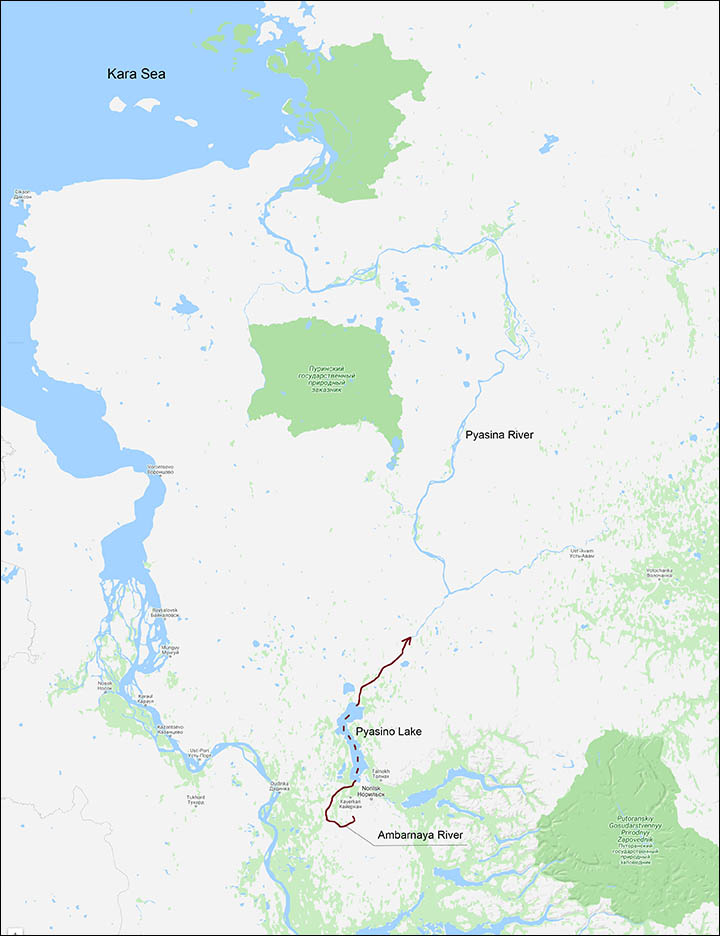
60km long Ambarnaya River flows into Lake Pyasino; the Pyasina River outflows this lake into the Kara Sea, part of the Arctic Ocean.
Pictures: social media, The Siberian Times
How bad was the spill?
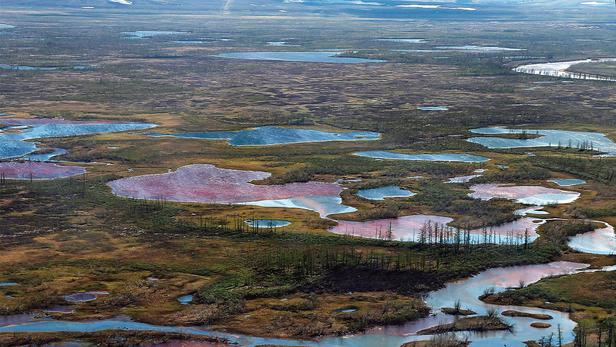
The leaked oil drifted some 12km (7.5 miles) from the site, turning long stretches of the Ambarnaya river crimson red.
The spill contaminated a 350 sq km (135 sq mile) area, state media report.
In a statement, Norilsk Nickel said the incident had been reported in a "timely and proper" way.
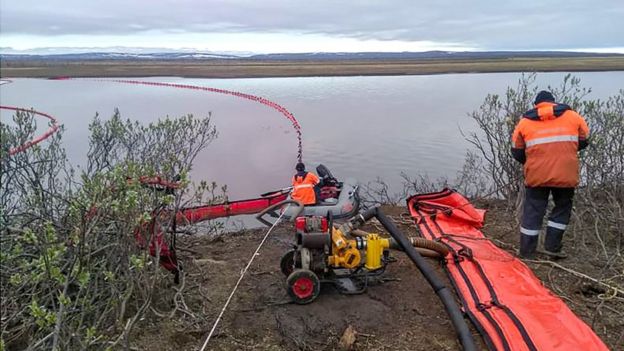
The state of emergency means extra forces are going to the area to assist with the clean-up operation.
The accident is believed to be the second largest in modern Russian history in terms of volume, an expert from the World Wildlife Fund, Alexei Knizhnikov, told the AFP news agency. What can be done to clear up the damage?
The incident has prompted stark warnings from environmental groups, who say the scale of the spill and geography of the river mean it will be difficult to clean up.
Greenpeace has compared it to the 1989 Exxon Valdez disaster in Alaska.
Experts have warned that the clean-up operation poses huge challenges
Oleg Mitvol, former deputy head of Russia's environmental watchdog Rosprirodnadzor, said there had "never been such an accident in the Arctic zone".
He said the clean-up could cost 100bn roubles (£1.2bn; $1.5bn) and take between five and 10 years.
Minister of Natural Resources Dmitry Kobylkin warned against trying to burn off such a vast quantity of fuel oil and has proposed trying to dilute the oil with reagents. Links :
The ocean could contribute much more to renewable energy creation, says a new report.
Scientists argue that ocean solutions should be incorporated into Green New Deal policies.
The World Economic Forum’s Virtual Ocean Dialogues is debating how the world’s oceans should be managed and protected.
Monday, June 8, is World Oceans Day, a global celebration honouring our oceans.
The
best way we can honour our oceans is to help save them, and understand
some of their biggest threats, which are climate change, plastic
pollution and overfishing.
Don’t overlook the power of the oceans to help combat climate change.
That is the message of a group of scientists who believe that the world’s oceans are too often viewed as victims of climate change – for example, rising sea levels or damaged coral reefs – rather than recognized as part of the solution.
Above-water-seascapes
(photo Dragus-Dumitrescu)
Policymakers around the world are developing strategies to offset climate change, with particular emphasis on renewable energy, food security, sustainable transport and restoring natural habitats like forests.
Such policies have been grouped together in the United States and elsewhere and referred to as the Green New Deal.
Here are four ways the scientists believe the ocean’s potential should be included in policies to tackle climate change, according to research they published in the journal Conservation Letters.
1. A focus on renewable energy
The ocean’s winds, waves and currents represent a massive source of clean energy that can reduce greenhouse gas emissions, while meeting electricity demand.
Offshore winds blow harder and more consistently than those on land, helping provide an uninterrupted supply of renewable energy. It is also windiest in the afternoon and evening, when available renewable energy from solar declines, but daily electricity demand is at its highest.
On top of this, new technology to harness the energy of waves and currents has great potential to contribute to the generation of renewable energy.
2. Sustainable transport
Much of the world’s global trade is transported at sea.
And while greenhouse gas emissions from this are relatively high, there are many solutions to help make sea travel more sustainable.
The report says that emissions could be reduced by more than 75% by using a combination of currently available technologies, including changing hull designs, switching to liquified natural gas, biofuels and wind power, or optimizing ship speed and capacity. 3. Food security
Marine fisheries remain one of the most sustainable sources of protein for human consumption and have a lower overall carbon footprint than many land-based food sources.
And there is further potential in aquaculture – the process of specifically growing or rearing fish or plants like seaweed in the oceans. 4. Restoring habitats
Restoring coastal habitats such as mangroves, tidal wetlands and kelp forests will help capture and store carbon dioxide, preventing it from entering the atmosphere.
In addition, coastal habitat restoration will help protect against floods or erosion, offsetting the impact of more extreme weather.