Saturday, June 28, 2025

Image of the week : a marine heatwave is ongoing in the Mediterranean Sea

 This 
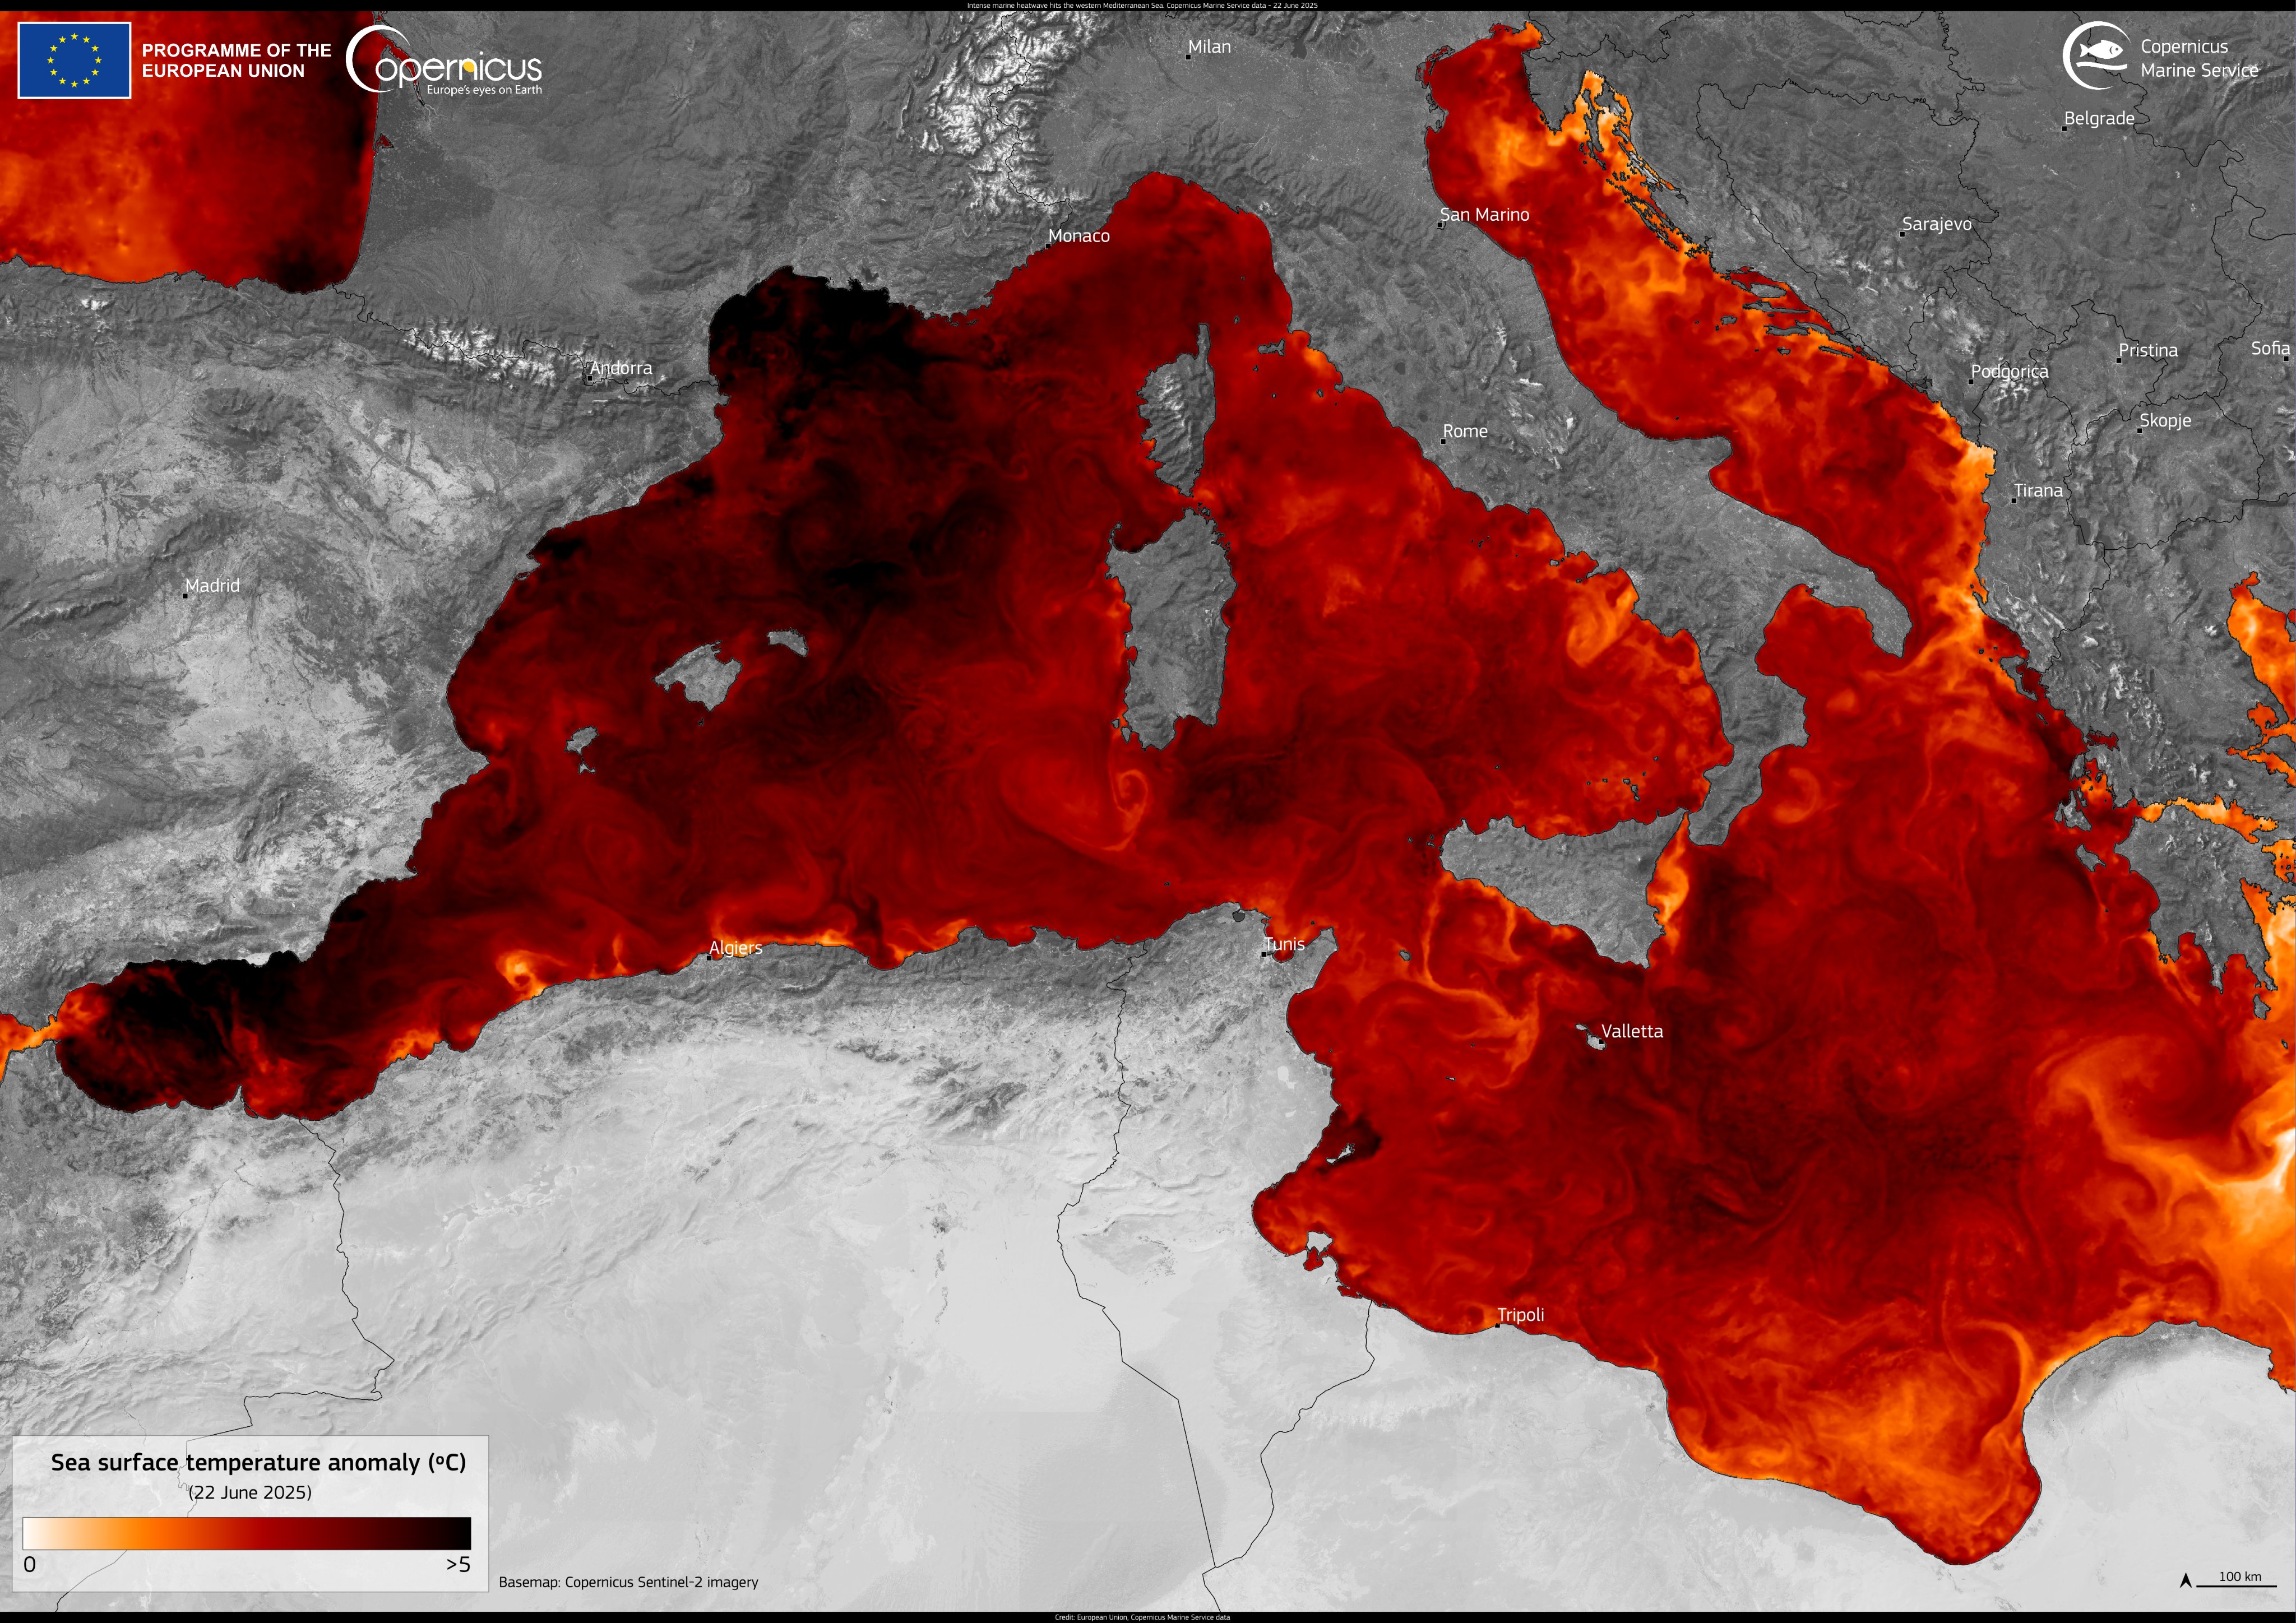
data visualisation, based on Copernicus Marine Service (CMEMS) data, shows sea surface temperature anomalies recorded on 22 June 2025.
Areas in dark red 🔴 indicate temperatures more than 5°C above the seasonal average.
The most intense warming was observed in the western Mediterranean basin, including the Balearic Sea and the Tyrrhenian Sea.
CMEMS delivers free, open-access marine data to support the monitoring of ocean health.
Tracking SST anomalies is essential to better understanding climate change impacts, anticipating extreme weather events, and managing risks to marine biodiversity and coastal communities.
 
Copernicus data show an important SST increase throughout the last week in parts of the western Mediterranean
 
The ongoing marine heatwave in the Mediterranean Sea 
is one of the largest marine anomalies observed globally
 

Friday, June 27, 2025

China's smart training ship starts intelligent navigation experiment voyage

 An aerial drone photo shows the vessel named "Xin Hong Zhuan" operated by China COSCO Shipping Corporation Limited docking at COSCO Shipping Heavy Industry Co., Ltd. in Dalian

From ChinaDaily by Xinhua
 
China's Xin Hong Zhuan, the world's first intelligent vessel designed for both research and maritime teaching practice, has set sail from Dalian, Liaoning province, Northeast China, on a landmark 4,000-nautical-mile voyage.

The voyage, which began on Monday, is part of a series of events celebrating China's National Maritime Day, which falls on July 11.

During approximately 30 days, the ship will visit six public-access port stops.
Its core mission involves pioneering intelligent navigation experiments - tackling busy traffic conditions near Haikou's Xinhai Port and navigating the complex, narrow channels of Yangpu Port, where constrained widths, variable depths, and intricate conditions traditionally challenge even skilled human crews.

China's Xin Hong Zhuan, the world's first intelligent vessel designed for both research and maritime teaching practice, sets sail from Dalian, Liaoning Province, northeast China.
Equipped with perception sensors and communication systems, including a weather routing system and electronic chart navigation, the vessel can reportedly autonomously adjust its course, avoid collisions, and respond to environmental changes in real time. 
Its design also supports the deployment of unmanned boats, drones, and research equipment.
 /CMG
 
The 69.8-meter long, 10.9-meter wide vessel, jointly built by Dalian Maritime University and China COSCO Shipping Corporation Limited, features six revolutionary intelligent systems developed entirely with domestic intellectual property.

Its semi-enclosed bow and stern are designed to deploy unmanned boats, drones, and research equipment.

Technologically, the six major intelligent systems integrate navigation, engineering, and electrical equipment into a cohesive autonomous platform, said Sun Feng, head of the research and development office at Dalian COSCO Shipping Heavy Industry Co, Ltd.

"Simply input the destination port at the console, and the ship can autonomously complete the voyage," said Sun. 
"Perception sensors deployed on board allow the vessel to make autonomous judgments and control adjustments based on the surrounding environment."


Advanced navigation and communication systems are provided by COSCO Shipping to support the ship's autonomous capabilities.
COSCO Shipping has provided the Xin Hong Zhuan with two intelligent communication and navigation products -- the weather routing system and electronic chart navigation equipment, according to Zhang Anming, general manager of COSCO Shipping (Guangzhou) Co, Ltd.
"From hardware chips to software algorithms, everything is independently controllable. The degree of intelligence reaches internationally leading levels and will strongly support navigation safety, efficiency, and the security of data and systems," Zhang added.

The ship has recently succeeded in autonomous navigation through a narrow channel under the control of its intelligent system, said Wang Guofeng, executive director of the unmanned ships collaborative innovation institute at Dalian Maritime University.
"The overall testing process also achieved key operations like autonomous collision avoidance and real-time route adjustment," he added.

Links :

Thursday, June 26, 2025

GeoAI in the marine domain

 GIS and GeoAI enhance maritime safety, decision-making, and economic benefits.
Hydrographic offices and chart producers leverage GIS for data management and automated chart production, while climate change monitoring organizations can use GeoAI to analyze decades of data for change detection.
(Image courtesy: Esri)
 
From Hydro by Matt Woodlief 

Cognitive object recognition, classification and change monitoring underwater

GeoAI is the application of artificial intelligence (AI) fused with geospatial data, science and technology to solve geographic-based problem sets.
GeoAI, therefore, is not a product to be bought and sold, but an integrated method, or pattern, for conducting spatial analysis using the power of computers.
The use of GeoAI on land has been widely publicized for use cases such as object detection (buildings, roads, trees), land use classification and change detection.
The application of GeoAI to the marine environment may be less apparent, but the basic uses of GeoAI – object detection, classification and change detection – can certainly be applied to the marine domain, both above and below the water.
These uses can be applied across a wide spectrum of marine-related activities, including chart production, marine security and environmental protection and monitoring.

Hydrographic offices have a mandate to protect life at sea.
To do this, they need to produce accurate navigational charts with timely updates.
However, accurate and timely have long been at odds.
Using an object detection model with a GIS, such as ArcGIS Pro, the path from data to chart can be automated.
The Esri GeoAI team set out to prove this use case in preparation for the 2020 User Conference.

Natural disasters or other regional phenomena can mean drastic changes are required to navigational charts.
In 2012, Hurricane Sandy devastated the area around Jamaica Bay, NY.
A post-disaster bathymetric survey identified numerous wrecks that were unaccounted for in the S-57 chart over this 100km2 area.
The Esri GeoAI team decided that a supervised classification method would be required, so they would need training samples to feed into the algorithm.
They enhanced the bathymetric surface with a shaded relief function to better highlight the elevation changes.
Using the built-in deep learning toolset in ArcGIS Pro, they used the collected training samples to train then execute the model, resulting in hundreds of new detections.
They then reviewed the detections to determine which required charting and which could be excluded.
Note that, while shipwrecks were the target in this experiment, other objects with a unique pattern could easily take their place.

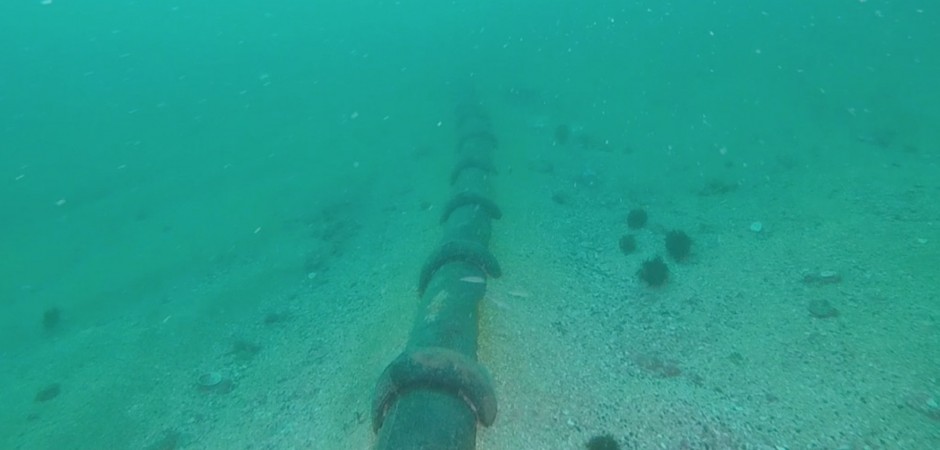
Shipwrecks detected from deep learning model.
Monitoring the natural environment


In addition to surveying for safe navigation, many hydrographic offices have an array of sensors collecting vast amounts of data to monitor the biology, chemistry and physical oceanography of their coastal waters.
For example, NOAA estimates that it collects about 20TB of data every day.
Models are required to sift through this information and alert humans when action is needed.

Canada’s Department of Fisheries and Oceans (DFO) regularly surveys Canadian Arctic waters to assess whale populations for stock assessment.
Aerial imagery is regularly collected and used in conjunction with satellite imagery for this purpose.
DFO and Esri Canada set out to see if there could be a use for GeoAI in the form of deep learning to detect Beluga whales from imagery.
Beluga whales were chosen to train the model because of their lighter colour and size, which makes them easier to detect than other Arctic marine mammals such as narwhals, walrus or seals.
They found that using an object identification model led to many false positives as the whales, floating sea ice and whitecaps all look similar.
Instead, they used pixel-based classification, which applies a similar process to object detection in that labelling and training are required, but these models segment out the pixels by value and location, grouping similar pixels into classes.
The models effectively do the tedious ‘panning and scanning’ for the human analyst and target areas of the imagery that need review and verification.
By employing these models, DFO hopes to be able to review imagery in the season it was collected, providing more timely information.
The model accuracy was estimated to be 80–85%.
Like all models, it can be tuned further with more training samples.
So, while not perfect, the models give analysts a major boost in efficiency, especially when they can be run inside a software suite already in use.

To give another example, identifying and monitoring the coastline is a monumental task, but one that allows scientists to gain an understanding of the effects of climate change.
When coupled with the estimate that nearly 15% or about one billion people live within ten kilometres of a coastline, this data collection is of great importance to our society.
The United Kingdom Hydrographic Office (UKHO) set out to establish a baseline extent of the global coastline with a greater accuracy than ever before.
Its combined use of data science techniques, machine learning (ML) algorithms and human expertise to solve a geographic problem is a notable use of GeoAI.
Because of the many variations of coastlines around the world, it used a pixel classification method called Otsu Thresholding, essentially segmenting the image into two categories: coastline and not coastline.
Using this method, it was able to produce a much more detailed coastline map than that previously available.
This more detailed map will allow for the finer-grain study of the effects of changing climate and the environmental impacts of natural phenomena such as shoreline erosion.

GeoAI is not just useful to ‘detect things’ in imagery.
In fact, machine learning and deep learning models are built into a variety of tools at the disposal of a GIS analyst.
Esri and Hypack partnered to complete a proof of concept where Esri forecasting tools would run on Hypack collected data to forecast where sedimentation would occur around the Port of Tuxpan, MX.
The idea was to use the 20+ years of bathymetric data to train the model to predict when and where sedimentation is occurring around the port area that could affect the size of vessels using the port.
This analysis used a deep learning technique called time series forecasting.
Time series forecasting searches for patterns and trends to use in making a prediction for a future value.
In this case, that was a value for the depth of the channel at that location.
Using this forecasted depth measurement to subtract from the safe navigational depth, Esri was able to predict where, when and how much sediment would need to be removed to keep the channel safe for navigation.

Results of time series forecasting.
Violet indicates areas where sedimentation above the threshold is likely to occur.


Protecting the blue economy

Continuing the theme of massive scale, it is estimated that 70% of global trade is carried by marine transportation.
One study by the United Nations concluded that the value of the blue economy is US$3–6 trillion every year.
There is obviously a lot at stake if the resources are not used equitably and sustainably.
One of the scourges of the blue economy is illegal, unreported and unregulated (IUU) fishing, the impacts of which have been widely studied.
Global Fishing Watch, an international non-profit organization, uses a GeoAI pattern by combining satellite imagery, big data feeds and machine learning to determine where and when IUU is taking place, and the participants.
It does this in near real time by analysing AIS and VMS feeds and satellite imagery object detections.
It also filters out non-fishing activities through analysis of the speed and direction of a given vessel and makes the data available for download and access via API.
This use of the GeoAI pattern gives anyone with an internet connection access to a massive global dataset.
Authorities can also use this data to monitor IUU in their economic zones.

Another example: about 30% of the world’s oil comes from undersea reserves.
While big spills dominate the news cycle, NOAA estimates that thousands of spills occur in US waters every year.
Fortunately, oil spills leave a pattern on the water that can be recognized by computer vision and used in a GeoAI pattern to indicate where an oil spill has occurred and its extent.
Models can then be used to predict where the oil will travel based on currents and other environmental factors.
Chen and Small (2022) used image/pixel classification techniques to isolate pixels containing oil from the non-tainted water.
The unique aspect of their study was to go beyond the visible spectrum and use the imagery collected from infrared sensors.
The result shows that oil can be detected from the surrounding seawater due to the contrast in thermal properties, indicating that GeoAI can go beyond the visible spectrum to detect anomalies that the human eye cannot.

When using high resolution drone imagery the model was able to identify whales that were partially or wholly submerged.

Risks and challenges for GeoAI in the marine environment

Using GeoAI patterns is not without risk or challenges.
The largest risk is misidentification or misclassification.
Even if a model reaches a confidence level average of 90%, that confidence level changes from feature to feature and pixel to pixel.
Human intervention is therefore required to verify the results of any output from the models.
In fact, subject matter expertise is required not only to interpret the results, but also to provide the training samples for the model.
In a similar vein, there is a real risk of misinterpreting or overestimating what a model is outputting, for example if the model was misconfigured or the analyst does not fully understand what the model is doing.
Take the case of the sedimentation research in Tuxpan, in which it was easy to conclude that the model reported dangerous levels of sedimentation in certain precise locations.
However, the nuance is important.
What the model is actually saying is that, based on past measurements, dangerous levels of sedimentation are statistically likely to happen in this location rather than somewhere else.
There are of course many additional factors that can cause this to change; the model can only use the data it is supplied with, which leads to the next major challenge: the lack of appropriate data.

Data needs to be appropriate for the application and the objects that need to be detected.
In the example of the oil spill detection, three-band RGB imagery would not have been appropriate as the near infrared (NIR) band was needed to detect the heat differences between the oil slicks and surrounding water.
Similarly, in the whales example, researchers needed a resolution of 30cm or better to detect whales.
A good rule is the pixel size needs to be smaller than the subject; that is, a 10m resolution will not be sufficient to detect Baluga whales, which average 4.6m in length.
On the topic of resolution, analysts need to be aware that finer resolution images require more computer resources for processing.
It may be determined during the project planning phase that, to balance resources and accuracy, the data needs to be resampled into a coarser resolution.
If using a pre-trained model, the analysis needs to understand which data was used to train the model and use the same data format and resolution, or else the model will produce unreliable and incorrect results or fail entirely.

Running AI/ML models in the GeoAI arena is a compute-intensive exercise.
To run GeoAI and deep learning workflows within the ArcGIS Platform, Esri recommends, at a minimum, a CPU with four cores, 8GB of RAM and a dedicated GPU with 4GB of memory.
The optimal requirement to run the processes on larger datasets is nearly double.
The machine will also need ample storage space to hold the base data, temporary output and final results.

Using GeoAI methodologies requires a significant investment in time.
The time spent labelling objects for deep learning processes or resampling datasets to fit the requirements of the model is not trivial.
In fact, most time will be spent preparing the data for the model.
Depending on the size, resolution and available computing power, models can take hours or days to run.
Keep in mind though: a single person may be able to process one image a day, but the machine can process hundreds, usually making the time invested in preparing the data worthwhile.

Reducing risks and challenges with GIS

The potential for GeoAI to help map and understand our oceans is compelling, but only if the risks and challenges can be mitigated.
GeoAI is focused on solving geographic problems, so it makes sense to select a GIS platform in which the analysis can be performed from start to finish.
The GIS can ingest images from satellites, aerial and drone-borne cameras, terrestrial scanners and sonar devices.
This flexibility allows the analyst to first explore the dataset to understand its format, resolution and pixel type, then focus on the application that would be best supported by this dataset.

Using the correct resolution for the object to be detected is the first step in preventing misclassification.
To begin exploiting the image, there are well-documented built-in tools and Python libraries so the analyst can select the best tool for the task at hand, whether that is labelling the objects for deep learning or running an object detection workflow.
These models usually require a few minor adjustments to account for the new data.
Additionally, GIS writes the results of the model directly to an interactive map, facilitating the QA/QC process.
Likewise, the GeoAI tools provide result metadata which helps assess the accuracy of the model.
Misclassification can also be avoided by including a human in the loop prior to publishing the results.

Desktop GIS, such as ArcGIS Pro, can access data directly from cloud storage, which eliminates having to move large amounts of data locally.
Furthermore, the use of spatial extent parameters available in the GIS-based tools let the analyst prepare smaller areas to test the models prior to running them on the entire dataset.
This can help mitigate some of the risk pertaining to available computing resources.
To help save time in the data preparation process, pre-trained models are available to establish baseline outputs and identify whether additional training samples are needed.

GeoAI has many fascinating use cases for the marine domain.
Hydrographic offices and chart producers can leverage the ability to detect objects and create an automated pipeline from data collection to chart production, and organizations monitoring the effects of climate change can automate the analysis of decades worth of data to find change.
The ongoing efforts of non-profit organizations can be enhanced by leveraging this new technology to protect Earth’s oceans from overfishing and contamination.
This is of course not without risk, but leveraging a modern GIS platform such as ArcGIS can greatly enhance the efficiency of the analyst to go from data to results.
GeoAI is an accessible method for almost anyone in the marine domain.

Links :

Wednesday, June 25, 2025

‘US, China, India can all fit into Africa’: On a quest to fix the world map

 
A man looks at a map of the world in Lisbon, Portugal 
[File: Armando Franca/AP]

From Aljazeera by Shola Lawal
 
Commonly used projections shrink the size of Africa, but experts have long debated whether creating a precise map is possible. 

When Abimbola Ogundairo saw a pretty wooden map she thought would be great decor for her walls, she did something most regular buyers wouldn’t think of: She messaged the manufacturers with a simple, yet charged question.

“Which map projection did you use?” she asked, referring to the method of representing maps on a flat plane.

The sellers never responded, but Ogundairo suspected they used a problematic projection.
Discouraged, she refused to place an order.

Ogundairo’s obsession with map projections is not random.
The 28-year-old is leading an African-led campaign to get more of global institutions and schools to immediately stop using the Mercator Map projection – the most common version of the world map that is generally recognised – because it shrinks Africa, and much of the Global South, while disproportionately enlarging the rich and powerful regions of the world.

Greenland, for example, is shown to be relatively the same size as Africa, but, in reality, can fit in the continent 14 times over.
Europe, portrayed as bigger than South America, is actually half its size.

Advocates like Ogundairo are pushing instead for “equal area” map projections, which they say more accurately represent the prominence of the African continent.

Since early May, Ogundairo, as lead campaigner at Africa No Filter, a nonprofit working to change negative perceptions of Africa, has hassled big institutions like the United Nations with a “Correct the World” campaign.
People are encouraged to sign an online petition to pressure their governments into compliance.
Most people, Ogundairo said, don’t know about the distortions and react with surprise and outrage.

“We’ve had a lot of, ‘Oh my God, I didn’t even know this was happening,’” Ogundairo told Al Jazeera.
“I have an uncle who decided to support this because I told him you can fit the US, China, and India into Africa, and he felt so betrayed. He was like ‘Oh my God, I had no idea.’”

Institutions have been harder to crack, Ogundairo said, but she expected some resistance to this sensitive, controversial topic.

For centuries, experts have debated the question: Can anyone accurately depict a three-dimensional, spherical world on a flat surface?
Is it possible to take a rounded object, like a football, for example, cut it up, paste it on a board, and have a precise representation?

Many experts conclude the answer is a resounding no.
Maps, they say, are inherently a lie, always compromising on something: Area, distance, or something else.
Others, though, argue that near-perfect maps exist and must be highlighted.

Ogundairo believes the commonly used Mercator map affects Africa and Africans negatively, and that its widespread use for centuries is connected to the many decades of colonialism the continent endured.
Now, she said, some 70 years after independence from colonial masters, is the time to press for change. 
“We live in a world where size is often equated with power,” Ogundairo said, adding that the Mercator map feeds tropes that Africa is a country.

“It has a damaging impact on the way we make decisions in our everyday lives, on how we make business decisions, the way we dream, and even the way non-Africans view the continent as a tourist destination and an investment destination.
It’s the most lingering lie about Africa,” she said.

A heated, centuries-long debate resurfaces

Cartographers as far back as the early 20th century knew the Mercator projection was problematic.

Developed by Flemish cartographer Gerardus Mercator in 1599, the projection was one of the first ever to represent arched, imaginary sailing courses as visible, straight lines.
Its simplicity for sea navigation cemented its popularity at the time, but its huge errors soon became hard to ignore.

“It preserves shapes and angles, and that’s good for navigation, but it’s terrible for scale,” geography professor Lindsay Frederick Braun of the University of Oregon said of the Mercator map.
The map is most suitable for local area mapping and is used by digital platforms like Google Maps.

When enlarged into a world map, though, Mercator becomes problematic, Braun said.
The map’s mistakes were not likely to be a conspiracy against Africa or the Global South, but its continued use, he added, is inherently political.

“Part of the reason Mercator got wide use is because it was widely available for nautical charts, but also because it rings true as a vision of the world to the people who were looking at it, the people whose countries are a little bigger.”

Several map projections over time have tried to fill Mercator’s gaps, but all of them compromise on one or more factors.
That has made it hard for social justice crusaders looking to support a projection that better represents the Global South. 
 
 
The Mercator projection is the most commonly used map 
[File: Stephane Mahe/Reuters]

One cartographer’s claims, though, shook the cartography world in 1973, causing an outpouring of condemnation on the one hand, and on the other, a loyal cult following.

German activist Arno Peters declared his Peters Projection as the “only” precise map, and the true alternative to the Mercator model.

Peters, whose parents had been imprisoned by Nazis and who focused on social inequalities as a journalist and academic criticised the Mercator projection as “Euro-centred”.

The fervour with which he and his supporters promoted the projection as a scientific feat and a social justice breakthrough bordered on what some called propaganda.
It caused concerned groups like the United States National Council of Churches to take notice and immediately adopt the map.

Critics, though, were quick to call out Peters on two things.
The map, observers pointed out, was only distorted differently: Where the Mercator projection makes areas near the poles appear much larger, the Peters projection relatively represents accurate sizes throughout, but slightly stretches areas near the equator vertically, and areas near the poles horizontally.

“There was also the fact that this map had already been presented by another cartographer decades ago,” Braun said, explaining the second problem.

Scottish scientist James Gall indeed first published an identical projection in a science journal in 1855, but it went unnoticed.
There is no proof, some researchers say, that Peters outrightly plagiarised Gall, but critics say his failure to credit the earlier researcher is still problematic.

In 2016, the debate resurfaced with renewed vigour after public schools in the US city of Boston switched to what many now refer to as the “Gall-Peters” projection.
Officials said the move was part of a three-year effort to “decolonise the curriculum”.
Teachers said they were amazed to see students questioning their view of the world after the switch.

However, many experts and map enthusiasts were annoyed by the fact that Boston chose Peters, and as such, gave the projection renewed relevance.

A perfect map?

Amid the Boston schools’ drama, one group of researchers decided they’d had enough of Peters and set out to do something.

Cartographer Bernard Jenny, who teaches immersive visualisation at Australia’s Monash University, said he was approached by Tom Patterson, a retired cartographer with the UN National Parks, for the task.
Together with software engineer Bojan Savric, the team in 2018 created an equal area map they called the “Equal Earth” projection.

That version, which sees Africa expand impressively, is increasingly seen as the closest thing to a perfect area map.
It’s the same one Ogundairo’s team is pushing for.

“But that’s maybe a slightly pretentious name,” Jenny laughed over a Zoom call, explaining that Equal Earth is still not a perfect representation of the Earth.
“We were just tired of the Peters resurgence and wondered why people would go with that when it’s not even the best in terms of anything,” he said.


The new projection tries to correct the Robinson projection, created in 1963 by American Arthur H Robinson.
Many scientists use Robinson’s map because it is more visually balanced, although it compromises on area, size and scale, and particularly enlarges areas close to the north and south poles.

“We tried to come up with a version of Robinson that does not distort area,” Jenny explained.
“So we stretched it in a way such that the different areas are not enlarged or shrunken.
So Greenland is 14 times smaller than Africa on the globe, and it’s also 14 times smaller on the Equal Earth map.”

Jenny said the team never set out specifically to correct some of the most highlighted errors of the Mercator projection.
Subconsciously, though, he said, they knew they wanted their map to better represent historically distorted regions like Africa.
“I would guess any reasonable geographer would support that idea,” the scientist said.

Equal Earth rose in popularity after a NASA scientist saw it online right after it was published, and the organisation immediately switched to it.

The World Bank, too, has picked it up.
The institution, since 2013, has experimented with different projections, including the Robinson map, but in 2024 settled on the Equal Earth map.
“The World Bank Group is committed to ensuring accurate representation of all people, on all platforms,” a spokesperson told Al Jazeera.

Progress is slow but steady, Ogundairo of Africa No Filter said.
Prominent organisations changing their stances means a universal pivot is possible, she said.
Yet, there’s much more work to be done by Africans, she added.

Just as Mercator painted an image that prominently represented his part of the world, Africans, too, need to lead the way in pushing for what they want, Ogundairo said.
One missing factor is that Africans have not insisted enough on change, in her view.
It’s why her campaign is also urging African countries and the African Union to be particular about how they are represented on the map.

“It’s always going to start with us,” Ogundairo said.
“Unless you learn to tell your story, someone else will tell it for you.
We need to say, regardless of why they choose to do whatever it is they did, we see the truth.
This is the story we want to tell now.
This is how we want to show up visually on a map.”

Links :

Tuesday, June 24, 2025

Deep beneath the surface: The geopolitical imperative to secure undersea pipelines


From SmartEnergy by Ami Daniel, CEO and co-founder of Windward,   
 
Escalating risks against offshore energy infrastructure, such as undersea pipelines, and what practical actions can be taken in securing their protection.

Offshore energy infrastructure is the backbone of Europe’s power supply
Comprised of a web of pipelines, rigs, and subsea cables, these systems are a marvel of engineering and international cooperation
However, the EU is still heavily reliant on external sources for energy – a record 16.5 million metric tons of liquid natural gas imported from Russia traversed these pipelines in 2024 – and securing these pipelines against bad actors is critical.

Unfortunately, the risks are escalating, with recent incidents such as the Nord Stream pipeline sabotage and repeated undersea cable failures highlighting the danger to these critical global systems.

Threats to underwater energy infrastructure are not a new phenomenon
In 1944, the British military launched Operation Pluto, a project to construct an extensive network of undersea pipelines under the English Channel to avoid the risk of attacks on tankers by enemy forces
While the threats today have evolved significantly since WWII, the principle remains the same – offshore energy infrastructure is a critical asset that, if disrupted, can weaken economies and national security.

Whether malicious attacks or mere accidents, such incidents highlight the vulnerability of these assets
But given the difficulties in safeguarding them both from a physical and logistical perspective, what practical actions can be taken?

The emerging threat landscape


There are an average of over 100 undersea cable faults annually, many in high-risk regions
The Nord Stream explosions in 2022, for example, exposed the vulnerability of critical pipelines, while repeated cable disruptions in the Baltic Sea and near Taiwan show a rising trend of maritime incidents.

While not all of these incidents are confirmed to be malicious attacks, there has been a notable and concerning increase in “dark activity” near the sites of these incidents
A vessel that engages in dark activity – intentionally disabling its Automatic Identification System (AIS) signals to avoid detection – is effectively invisible to most global tracking systems and can undertake illegal activities virtually undetected
This tactic is frequently used by the “dark fleet”, a category of vessels, often operated by countries like Russia and China, that is involved in clandestine trade, sanctioned commodity transport, and other illicit maritime operations
According to Windward’s data, the dark fleet includes over 1,300 vessels.

While dark activity is commonly associated with illegal fishing or smuggling sanctioned commodities, the dark fleet’s growing presence near undersea energy infrastructure assets raises the concerning possibility that these ships are being used for sabotage or unauthorized interference
Unfortunately, enforcement is difficult in international waters
Jurisdiction is limited or complicated, and opaque vessel ownership makes accountability challenging
The result is that offshore infrastructure is exposed to intentional or accidental interference, such as the recent Ukrainian attack on an offshore gas platform used by Russian forces in the Black Sea. 
 
Evolving tactics

Threat risks are highest in shallow waters, where the act of anchor dropping and dragging can cause severe damage to undersea cables and pipelines.

For instance, the Chinese-owned vessel Shunxing 39 was implicated in severing an undersea fiber-optic cable near the shores of Taiwan, raising concerns about intentional sabotage
Windward’s internal data has additionally revealed that this vessel was transmitting as many as three different false identities in order to obscure its relation to the incident.


 Chinese fisheries research ship the Song Hang operating in the Sulu Sea on April 2.
Windward, which tracks global vessel behavior using artificial intelligence, published an analysis of ship-tracking data highlighting an "unmistakable" difference between the Song Hang's movements and the "natural, erratic" ones of known fishing vessels.
The Song Hang's grid-like paths last month, consistent with survey activity, were concentrated directly over and adjacent to Pacific undersea cables east of Japan and east of the Philippines.
Windward also cited other "red flags" linked to the vessel, including "discrepancies between its transmitted and registered IMO, an unclear ownership trail, and a moderate illegal, unreported, and unregulated fishing risk score."
photo : Philippine Coast Guard
 
This incident is just one example of the evolving tactics used by bad actors at sea as well as the challenging nature of monitoring and mitigating such incidents
Indeed, while all ships have anchors and therefore the potential to damage maritime infrastructure, recent reports reveal that Chinese engineers have filed patents for devices specifically designed to sever undersea cables.

The patent, filed in 2020 for a “dragging type submarine cable cutting device” by a team from China’s Lishui University, describes a method to quickly and cost-effectively cut submarine cables with a sharp, heavy device
The mere existence of patents for such devices indicates the potential threat of specialized tools capable of damaging critical undersea infrastructure
It’s an ominous development that exacerbates fears about the vulnerability of offshore energy assets, including oil and gas pipelines and rigs, to deliberate sabotage using advanced technologies.
 
The challenges of securing offshore infrastructure

Traditional security practices such as AIS monitoring, while relevant and useful, are insufficient on their own
Vessels can disable or manipulate signals and the surveillance capabilities they offer are reactive – rather than preventing incidents, they can only be investigated after the fact.

Another complication is that, while governments play a key role in maritime security, many maritime assets are privately owned, creating a gap in responsibility for which no single entity is fully accountable
This often leads to a “pass the buck” dynamic: governments expect private companies to handle security, companies look to governments for protection and enforcement, and the energy companies that manage this infrastructure face increasing pressure to invest heavily in security.

Many offshore facilities lie outside territorial waters, further obfuscating where enforcement responsibility falls
Consider that a significant portion of Europe’s offshore energy infrastructure is located beyond the territorial waters of any single country, often in Exclusive Economic Zones (EEZs) or international waters
While EEZs give countries certain rights over resource exploitation, they do not grant full sovereignty or law enforcement authority, making it difficult to take legal action against vessels suspected of interference or sabotage
No country has direct control in these areas, so security depends on voluntary cooperation between maritime stakeholders, which is often inconsistent and slow
Indeed, effective security for offshore energy assets requires collaboration between a slew of players including governments, international organizations, and private sector operators
However, coordination across these jurisdictions remains notoriously difficult due to differing geopolitical interests, regulatory standards, and enforcement capabilities.
 
Strengthening resilience

Any players with some level of responsibility for maritime security must implement robust monitoring mechanisms to track vessel activity around undersea pipelines and offshore platforms.

While government-led intelligence provides valuable insights into regional security risks, reliance on state authorities alone may leave energy operators exposed to blind spots in threat detection or enforcement
Accordingly, energy companies and other private stakeholders need to establish proactive security barriers to detect and respond to potential threats in real time.

The private sector is poised to help bolster security by investing in independent intelligence capabilities – proprietary maritime risk assessment tools, commercial satellite data, and private security partnerships
Their main challenge is transitioning from plain out vessel monitoring – which will create hundreds of alerts per day, to AI driven risk management which provides clear and reliable alerts based on well-defined risk profiles
Ultimately, a dual-layered approach that integrates both government and private intelligence is the most effective way to enhance situational awareness and provide a more comprehensive security framework
It is also likely that this approach will enable reinsurers to provide significant discounts to captive insurance policies with utility or energy companies.

Cross-border cooperation is also essential to tackle these growing maritime security challenges
Coordinated efforts are the best way to bridge jurisdictional gaps and facilitate rapid responses to security incidents
International organizations, including NATO and the European Maritime Safety Agency (EMSA), will play a key role in establishing standardized security protocols to protect vital infrastructure.

As infrastructure warfare becomes the next frontline of conflict, securing these critical assets must be a top priority.

Proactive collaboration

More than ever before, offshore energy infrastructure is a strategic target.

As threats continue to evolve, European energy companies, utilities, and policymakers must recognize the scale of the risk, take a proactive approach, and bolster collaboration between utilities, energy firms, and national security agencies
Failing to act today could bring about tomorrow’s devastating disruptions.
 
Links :

Monday, June 23, 2025

Seabed 2030 announces millions of square kilometers of new seafloor data on World Hydrography Day

Mapped seafloor is shown in blue, with red indicating new bathymetric data added in the last year
Credit: Seabed 2030

From Seabed20230

On World Hydrography Day, The Nippon Foundation-GEBCO Seabed 2030 Project has announced that 27.3% of the world’s ocean floor has now been mapped to modern standards
The increase in data represents more than four million square kilometres of newly mapped seafloor – an area roughly equivalent to the entire Indian subcontinent


This milestone comes at a pivotal moment

Just last week at the third UN Ocean Conference in Nice, the global ocean community united in a call for urgent, inclusive and transformative action – recognising the ocean’s central role in addressing some of the planet’s greatest challenges, from climate resilience to food security
Yet despite covering more than 70% of Earth’s surface, the ocean remains our least understood environment.

Established by the International Hydrographic Organization (IHO), World Hydrography Day raises awareness of the critical role hydrography plays in advancing our understanding of the ocean
This year’s theme, ‘Seabed Mapping: Enabling Ocean Action’, highlights how bathymetric data underpins the blue economy – supporting sustainable marine energy, coastal tourism and fisheries – and contributes to global efforts to protect biodiversity and tackle climate change.


Seabed 2030 is a collaborative project between The Nippon Foundation and the General Bathymetric Chart of the Oceans (GEBCO), which seeks to accelerate the complete mapping of the world’s ocean floor and compile all the data into the freely available GEBCO Ocean Map
As a flagship programme of the Ocean Decade, Seabed 2030 is helping to close one of the largest data gaps in ocean science

From improving tsunami early-warning systems to guiding the installation of undersea cables and identifying biodiversity hotspots, seafloor data enables informed, real-world action.

Over the past 12 months, Seabed 2030 has welcomed data contributions from 14 new organisations – including first-time contributions from five new countries: Comoros, Cook Islands, Kenya, Mozambique and Tanzania
With data now contributed by over 185 organisations worldwide, the project continues to galvanise global support towards a fully mapped ocean floor.

Commenting on the latest milestone, Seabed 2030 Project Director Jamie McMichael-Phillips said: “Mapping the seafloor is not just a scientific exercise – it’s a global imperative, foundational to everything from climate action and coastal resilience to sustainable development.

As we reach the midpoint of the UN Ocean Decade – a defining moment for ocean action – I urge governments, industry, research institutions and individuals alike to contribute to this global effort
Together, we can deepen our scientific understanding of the ocean and help secure the future of the blue planet.”

Executive Director of The Nippon Foundation, Mitsuyuki Unno, said: “The Nippon Foundation is committed to building on the achievements made through Seabed 2030 by continuing to support global collaboration to acquire bathymetric data, the promotion of innovative ocean mapping technologies, and the training of future ocean mappers.”

Chair of GEBCO Evert Flier added: “The progress captured in this update reflects the extraordinary value of global collaboration
Every contribution strengthens the GEBCO Grid – helping to complete the picture of the ocean and deliver benefits for science, society and the planet.”

All data collected and shared with the Seabed 2030 project is included in the free and publicly available GEBCO global grid
A joint programme of the IHO and the Intergovernmental Oceanographic Commission (IOC) of UNESCO, GEBCO is the only organisation with a mandate to map the entire ocean floor

Links :

Sunday, June 22, 2025

James Carew takes on giant waves at Nazaré

When everything aligned in Nazaré, Portugal, James Carew knew it was the day.
James chased what might be the biggest kitesurfing wave of his caree and possibly a world record. Experience the raw power, chaos, and beauty of Nazaré through James’s eyes as he battles wind, spray, and massive ocean walls in an unforgettable session.
This is not just about the ride, it's about reading the impossible, trusting your crew, and pushing limits when nature offers a once-in-a-lifetime shot.