Image courtesy of NOAA Ocean Exploration.
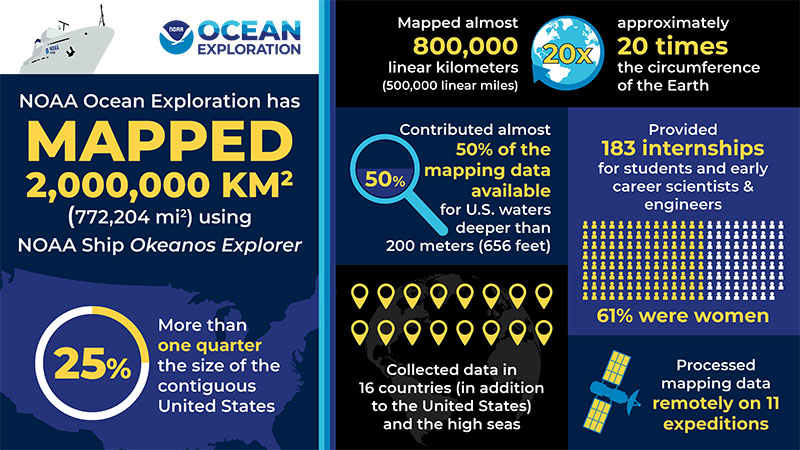
Two million square kilometers.
Or 772,204 square miles.
That’s more than one quarter the size of the contiguous United States.
And it’s the area of seafloor mapped by NOAA Ocean Exploration using the modern, high-resolution multibeam sonar system aboard NOAA Ship Okeanos Explorer since the ship was commissioned in 2008.
From 2008 through early November 2021, NOAA Ocean Exploration mapped 2 million square kilometers (772,204 square miles) of seafloor aboard NOAA Ship Okeanos Explorer. Okeanos Explorer is equipped with state-of-the-art multibeam sonar systems that use beams of sound to map the ocean floor.
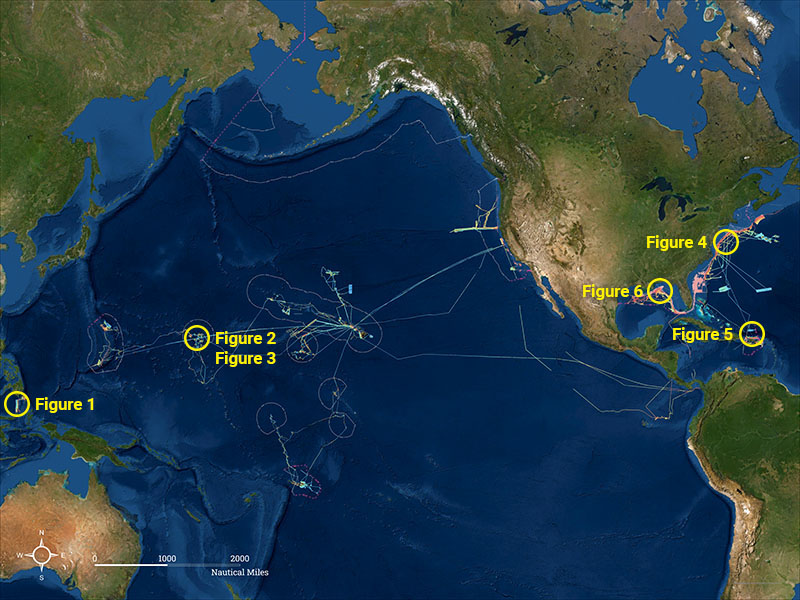
This map shows the cumulative multibeam mapping coverage.
The gray lines indicate the boundaries of the U.S. Exclusive Economic Zone.
Image courtesy of NOAA Ocean Exploration.
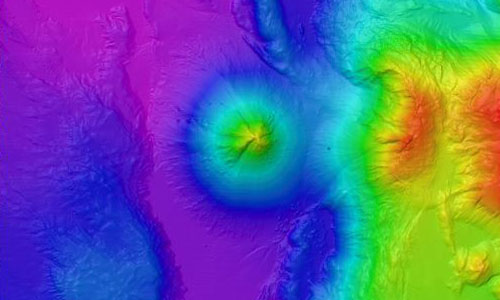
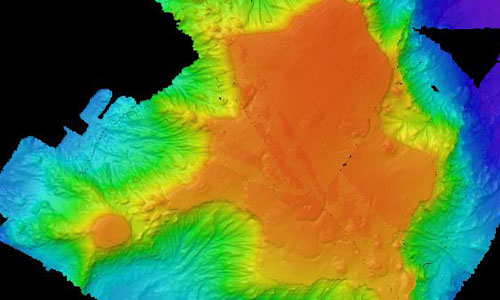
Figure 1: During the 2010 Indonesia-USA Deep-Sea Exploration of the Sangihe Talaud Region, NOAA Ocean Exploration mapped Kawio Barat, a volcano in the Celebes Sea of Indonesia, in detail for the first time. The conical volcano is over 3,000 meters (9,843 feet) tall and is the site of black smoker hydrothermal vents and chemosynthetic communities.
Image courtesy of NOAA Ocean Exploration.
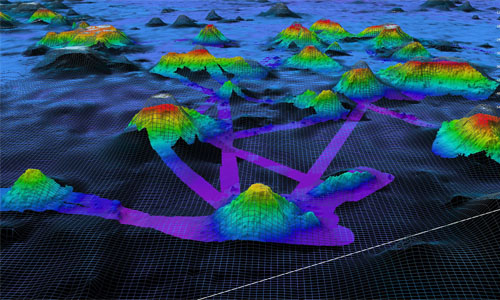
Figure 2: Three NOAA Ocean Exploration mapping expeditions in 2016 focused on mapping the numerous seamounts in the U.S. Exclusive Economic Zone around Wake Island in the Pacific Ocean. Each time we learned something new about their height, size, and type.
The “wireframe” in this image shows the predicted bathymetry of the seamounts based on satellite data. After we mapped them with the modern sonar system on NOAA Ship Okeanos Explorer, we found many to be flat topped guyots with tops hundreds of meters higher or lower than predicted.
Image courtesy of NOAA Ocean Exploration.
Figure 3: Three NOAA Ocean Exploration mapping expeditions focused on mapping the numerous seamounts in the U.S. Exclusive Economic Zone around Wake Island in the Pacific Ocean.
One seamount, seen here, was found to be a guyot larger than the state of Rhode Island.
Image courtesy of NOAA Ocean Exploration.
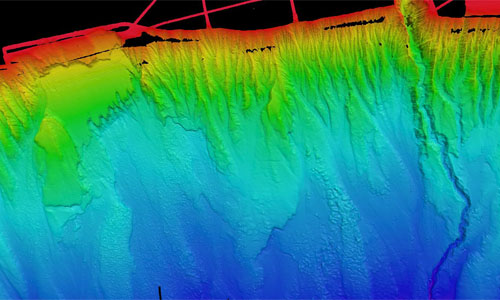
Figure 4: During the Atlantic Canyons Undersea Mapping Expeditions campaign, NOAA Ocean Exploration and partners focused on canyons and landslides, mapping every major submarine canyon from North Carolina to the U.S.-Canada maritime border in high resolution.
Image courtesy of NOAA Ocean Exploration.
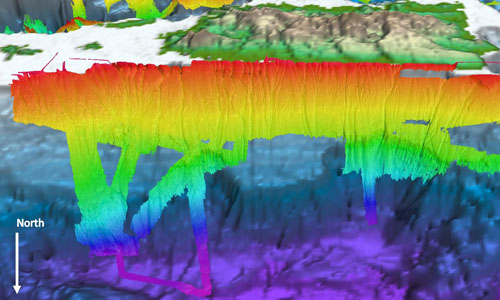
Figure 5: While exploring the waters off Puerto Rico during Océano Profundo in 2015, NOAA Ocean Exploration mapped a section of the tilted carbonate platform, which includes several major canyons, north of the island.
Our modern high-resolution bathymetry is seen here overlaid on satellite data of the territory and the surrounding waters. Image courtesy of NOAA Ocean Exploration.
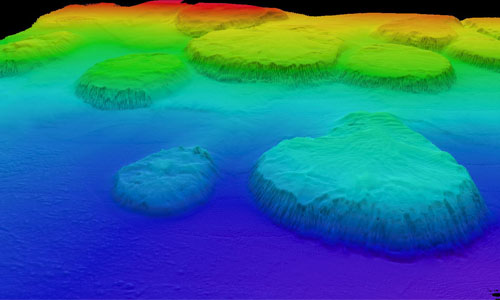
Figure 6: In 2012, NOAA Ocean Exploration mapped these salt domes in the Gulf of Mexico.
Salt domes are formed when mounds or columns of salt beneath the seafloor push rocks and sediments above them upward into hill-like structures that rise from the seafloor.
Salt domes have been associated with oil and gas seeps as well as a variety of marine life, including chemosynthetic communities, making them important features to locate and document.
Image courtesy of NOAA Ocean Exploration. Download largest version (519 KB).
Why We Map
There’s so much to thank the ocean for. From the air that we breathe to the food on our plates to the climate that makes our planet habitable
Nevertheless, so much of our ocean, the deep ocean in particular, remains unexplored.
Exploration leads to discovery, and the first step in exploration is mapping.
Exploration leads to discovery, and the first step in exploration is mapping.
Seafloor mapping provides a sense of the geological features and animals of our deep ocean and sets the stage for discoveries to come.
But, it’s not just about the thrill of discovery.
Deep-ocean seafloor mapping has many benefits.
Broadly, it provides insight into geological, physical, and even biological and climatological processes, helping us better understand, manage, and protect critical ocean ecosystems, species, and services for the benefit of all. In addition, it supports navigation, national security, hazard detection (e.g., earthquakes, submarine landslides, and tsunamis), telecommunications, offshore energy, and more.
NOAA Ocean Exploration’s Role
For years, NOAA has been leading efforts to complete seafloor mapping in U.S. waters, and NOAA Ocean Exploration has been leading these efforts in deep waters (below 200 meters, 656 feet).
Now, all of this work is being done in support of the National Strategy for Mapping, Exploring, and Characterizing the United States Exclusive Economic Zone (national strategy), which calls for completing mapping of the U.S. Exclusive Economic Zone by 2040 (waters deeper than 40 meters (131 feet) by 2030 and the near shore by 2040).
As such, mapping is a critical part of every NOAA Ocean Exploration expedition on Okeanos Explorer. In addition, decisions about where we go and where we dive all start with a map.
As such, mapping is a critical part of every NOAA Ocean Exploration expedition on Okeanos Explorer. In addition, decisions about where we go and where we dive all start with a map.
We pursue every opportunity to collect and archive data from largely unmapped areas of the seafloor using the ship’s suite of modern sonars.
Over the years, mapping data collected aboard the ship in the Atlantic, Pacific, and Indian oceans as well as the Gulf of Mexico and Caribbean Sea have revealed numerous new features and spurred major discoveries.
Seamounts, trenches, canyons, ridges, banks, hydrothermal vents, brine pools, methane seeps, coral mounds, shipwrecks — we’ve mapped them all and more.
NOAA Ocean Exploration has been mapping the seafloor of the Blake Plateau off the Southeast United States aboard NOAA Ship Okeanos Explorer (left) since 2011.
As a result of this mapping, NOAA Ocean Exploration and partner scientists discovered mounds of extensive, dense populations of the deep-sea, reef-building coral Lophelia pertusa (middle and right) — some in areas previously believed to be flat and featureless.
These mounds have been growing for thousands, perhaps millions, of years and provide shelter and habitat to a variety of marine life.
Now, at 28,047 square kilometers (10,829 square miles), this area is considered to be the largest known deep-sea coral province in U.S. waters, possibly the world.
Additional mapping data collected with the support of NOAA Ocean Exploration (not shown here) have contributed to a near complete map of the deep waters of the Blake Plateau, an area of interest for the National Strategy for Mapping, Exploring, and Characterizing the United States Exclusive Economic Zone.
Images courtesy of NOAA Ocean Exploration.
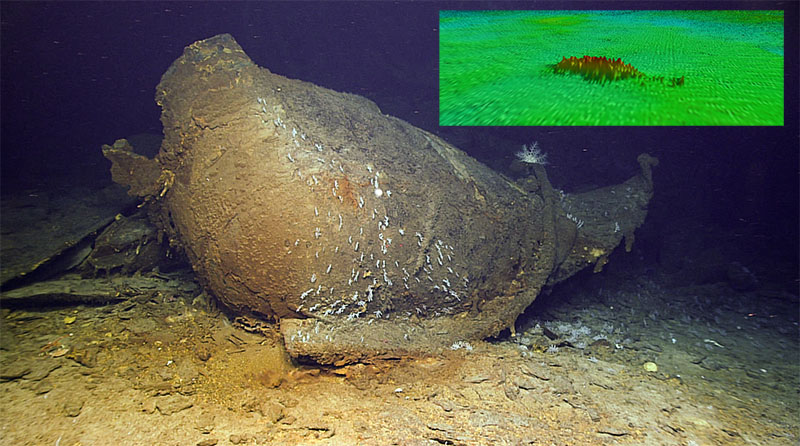
NOAA Ocean Exploration also uses the multibeam sonar system on NOAA Ship Okeanos Explorer to search for shipwrecks and other submerged cultural resources that help us better understand the past. An anomaly in seafloor mapping data (inset) turned out to be a shipwreck, likely the World War II-era oil tanker SS Bloody Marsh.
Images courtesy of NOAA Ocean Exploration, 2021 U.S. Blake Plateau Mapping 2 (inset) and Windows to the Deep 2021.
The free and publicly accessible data collected aboard Okeanos Explorer have been used by countless scientists, ocean resource managers (e.g., managers of fisheries and marine protected areas), and students.
These data also contribute to Seabed 2030 , a collaborative, international effort to produce the definitive map of the world ocean floor by 2030.
Always Evolving Technologies
Mapping technologies have come a long way in recent decades, and NOAA Ocean Exploration is consistently at the forefront of the deep-ocean mapping community in testing and implementing new and emerging technologies.
In 2008, NOAA Ocean Exploration and NOAA’s Office of Marine and Aviation Operations outfitted Okeanos Explorer with a state-of-the-art deepwater multibeam sonar system — the very first of its kind in the world — capable of collecting high-resolution mapping data across large areas.
And, in 2021, we replaced this system, again with the first of its kind, to enable even greater mapping data quality and coverage.
In addition, NOAA Ocean Exploration recently piloted the remote processing of mapping data in the cloud, allowing mappers and interns to participate from shore.
What’s Next
Seafloor mapping is difficult, time consuming, and expensive.
To meet the ambitious goals set by the national strategy and Seabed 2030, the mapping community is going to need to increase the pace, efficiency, and affordability of seafloor mapping.
Organizations will need to work together, leverage their resources and expertise, and increase the use of new tools and technologies like autonomous vehicles, innovative telepresence technologies, and the cloud.
Yes, 2 million square kilometers is a lot, and it’s an accomplishment to be proud of, but approximately 50% of the seafloor beneath U.S. waters remains to be mapped to modern standards.
Yes, 2 million square kilometers is a lot, and it’s an accomplishment to be proud of, but approximately 50% of the seafloor beneath U.S. waters remains to be mapped to modern standards.
NOAA Ocean Exploration is up to the challenge, and we will continue to evolve our operations, on Okeanos Explorer and through other mechanisms, to help meet it.
With so much to map, it’s a good time to be an ocean explorer.
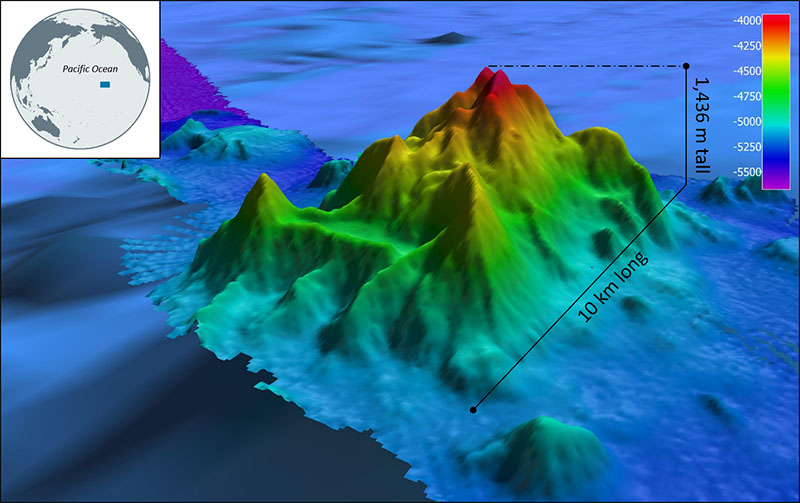
This seamount was mapped for the first time during NOAA Ocean Exploration’s 2016 Hohonu Moana expedition on NOAA Ship Okeanos Explorer.
Subsequently, the seamount was named Okeanos Explorer Seamount to honor the ship for its key role in the discovery.
Image courtesy of NOAA Ocean Exploration, 2016 Hohonu Moana. Download largest version (629 KB).
This milestone was met on November 1, 2021, on the Blake Plateau off the coast of the Southeast United States during the Windows to the Deep 2021 expedition.
Published: November 15, 2021
Contributed by: Christa Rabenold, NOAA Ocean Exploration
Relevant Expedition: Windows to the Deep 2021

No comments:
Post a Comment