Saturday, February 8, 2020

Map of the week – Argo floats

Access the map
The data in this map were provided by EMODnet Physics. 

This week, the All Atlantic Ocean Research Forum showcases the remarkable Atlantic marine research that is being done through international cooperation made possible by the 2014 Galway Statement on Atlantic Ocean Cooperation (EU - US - Canada) and the 2017 Belém Statement on Atlantic Ocean Research and Innovation Cooperation (EU - Brazil - South Africa).
While a lot of progress is being made towards an All-Atlantic Ocean Research Alliance, the forum also focusses on the many future challenges in an ocean threatened by a changing climate and the destruction of marine biodiversity.
One of the main challenges is to communicate ocean research to society, industry and decision makers so that it can inform policies that reduce humanity’s impact on the climate and ocean ecosystems.
One accomplishment of international cooperation on ocean research is the Argo float program
The Argo project is run by over 30 nations from all continents that maintain an array of almost 4000 free-floating buoys within the world’s ocean. 
These so called ‘argo floats’, which look like human sized wine bottles, have the unique ability to sink to a water depth of 2000 metre and return to the sea surface while collecting information on seawater properties like temperature, salinity and velocity.
When a buoy reaches the surface, this information together with its position, is sent to open marine data initiatives like EMODnet Physics, where it is freely available only hours after it has been collected.
Together with other oceanographic instruments like drifting buoys, ferry boxes and underwater gliders, Argo floats contribute to the Global Ocean Observing System (GOOS) which enables scientists to better understand and predict climate change, allows for improved operational services like weather forecasts and tsunami warning systems, and permits the assessment of marine ecosystem health.
The map of the week shows the near real-time positions of all the Argo floats that are currently drifting around in the ocean.
By clicking on a particular float, you can learn which country and institution deployed it and what kind of information it is collecting.

Friday, February 7, 2020

The African coastline is a battleground for foreign fleets and artisanal fishers

Illustration by Mark Garrison

From Hakai Magazine by Kimberly Riskas 

It’s illegal and dangerous for industrial boats to encroach on fishing zones reserved for local communities.


Africa’s coastal waters have long been attractive to industrial fishing fleets from around the world. But as valuable fish stocks dwindle, these large vessels are creeping shoreward and illegally crossing into zones reserved for small-scale fishing communities.
Keeping the big boats out is important for regulating catches—but it’s also a matter of life and death for artisanal fishers.

“Every year, collisions with industrial vessels kill over 250 artisanal fishers in West Africa alone,” says Dyhia Belhabib, principal investigator of fisheries at the nonprofit Ecotrust Canada.
Across Africa, she adds, the toll may be as high as 1,000 deaths a year.


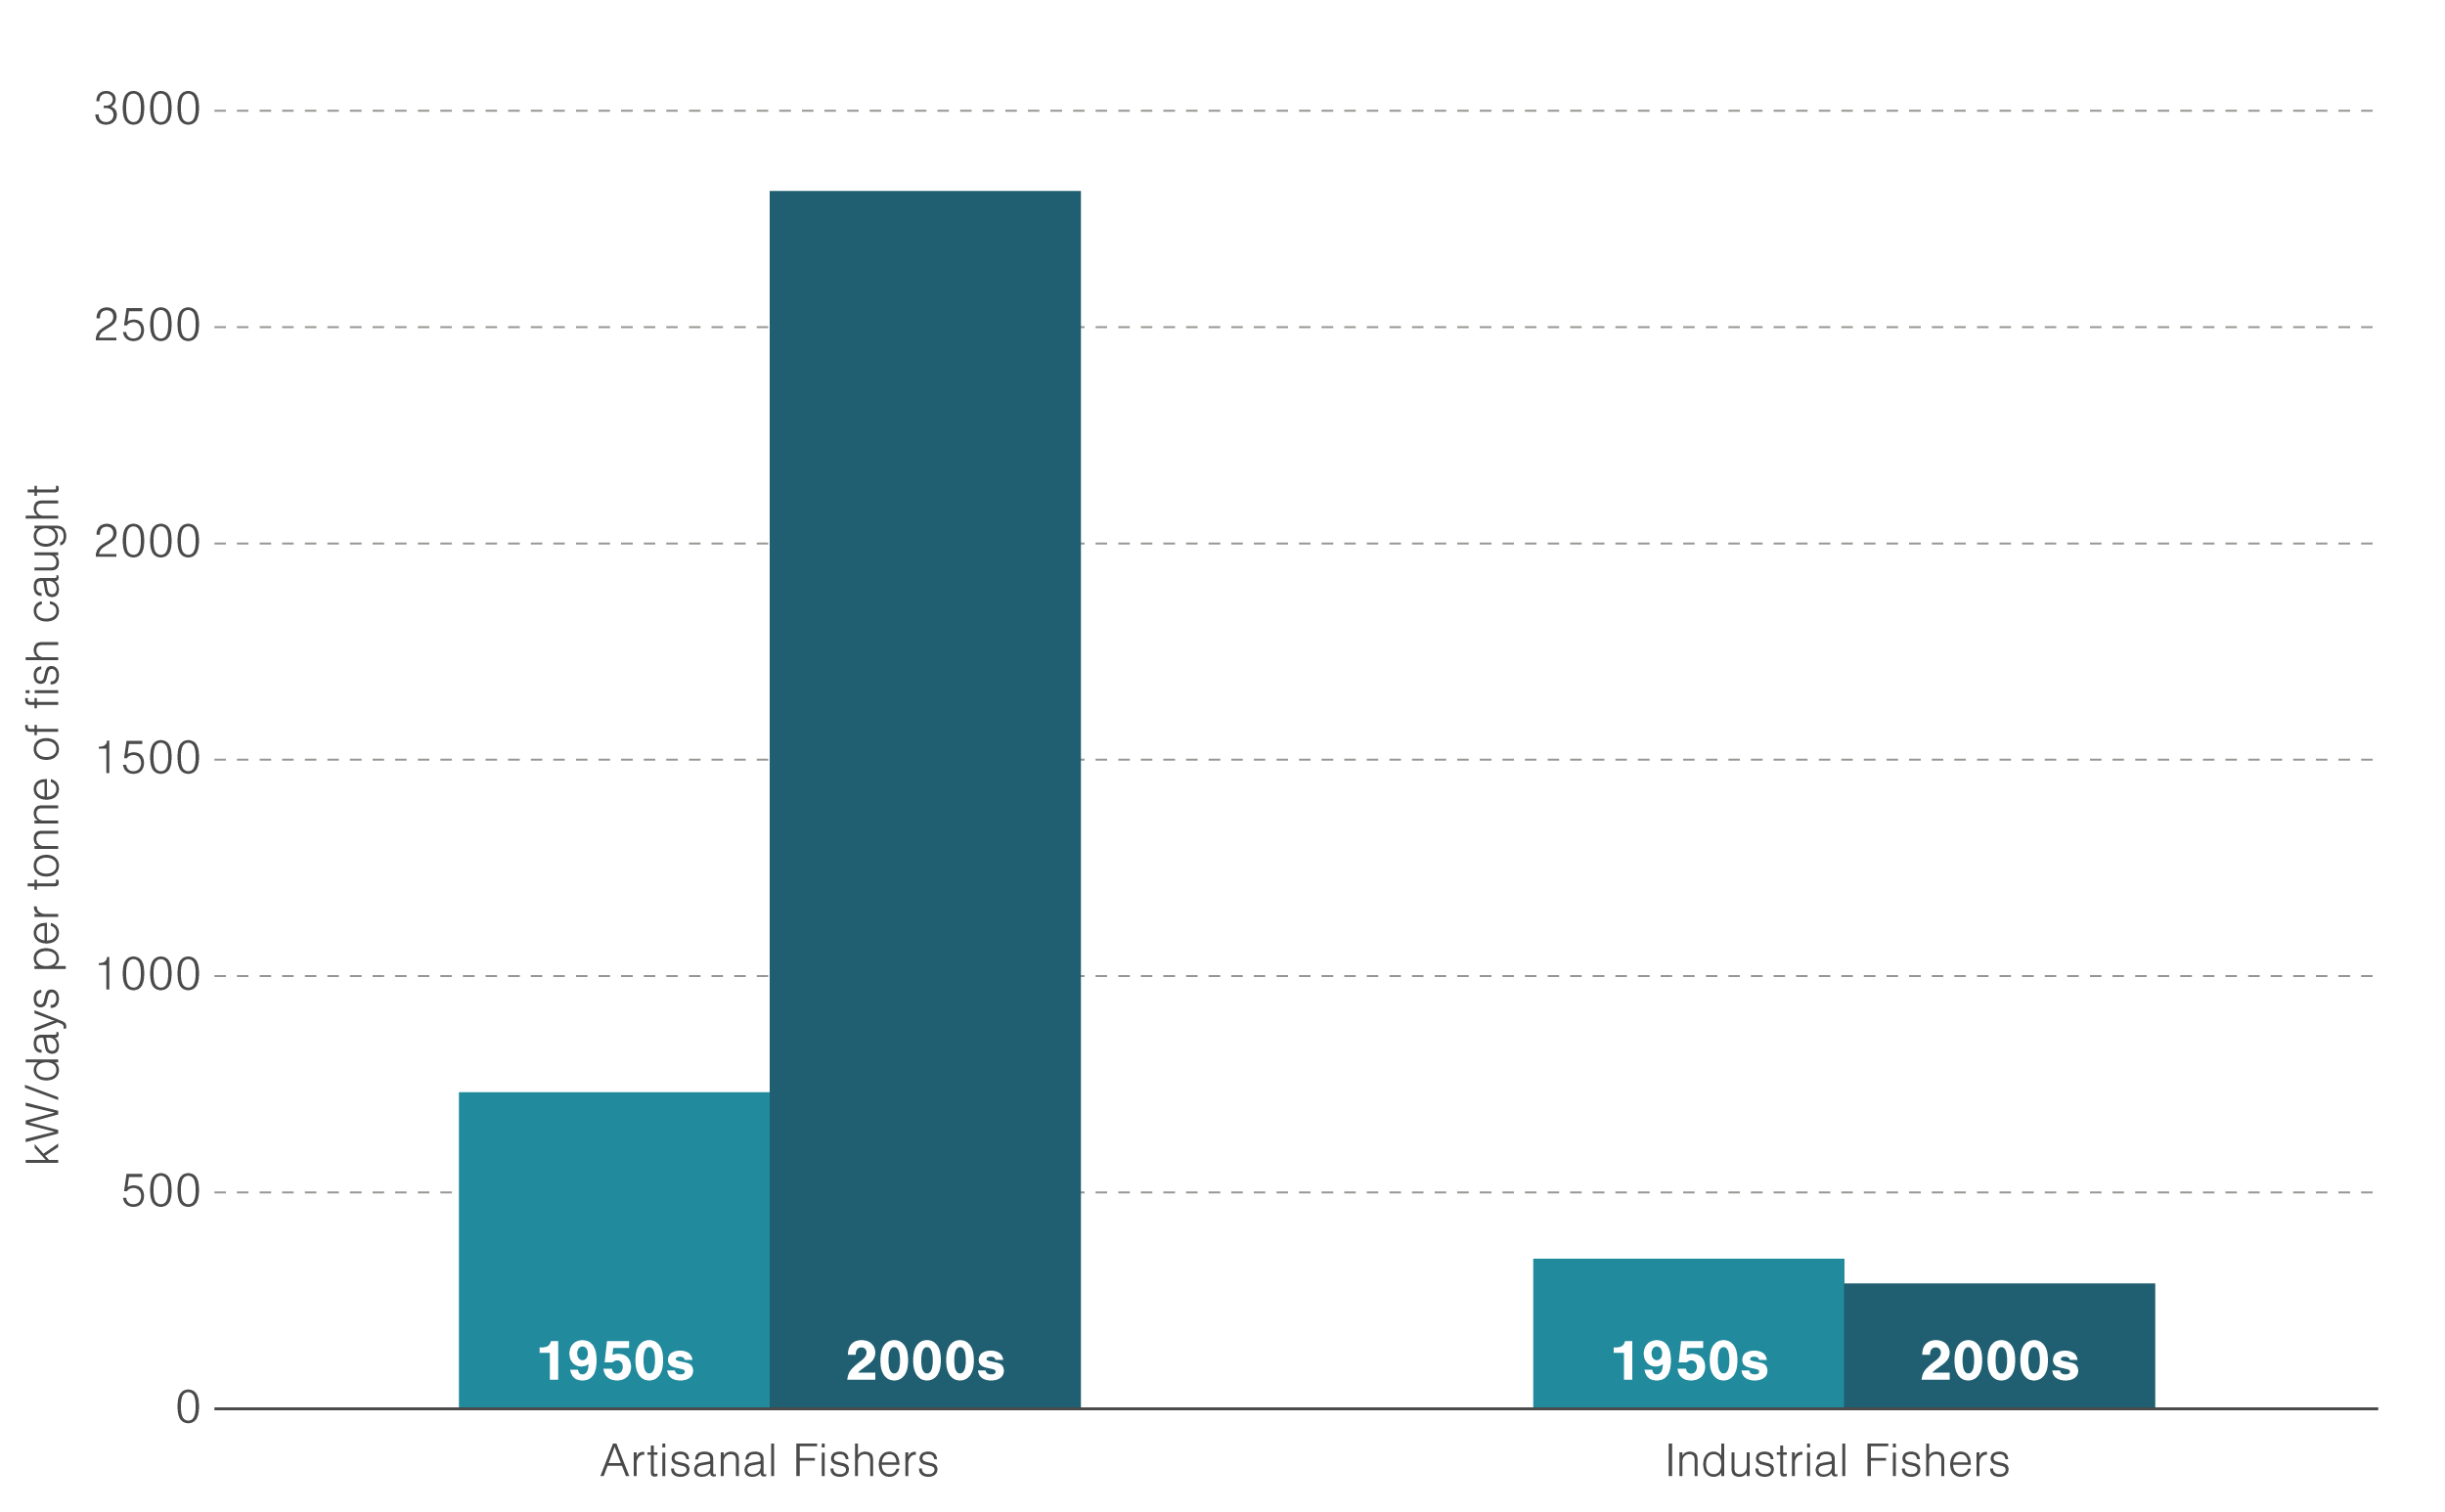
The researchers tracked how much energy is needed to catch a fish—whether that’s the horsepower of a fishing boat motor, or the effort of a person casting a net.
They found that while industrial fishing is becoming more efficient, artisanal fishers are having to spend more energy to catch fish than they used to.
Illustration by Mark Garrison

In a new study, Belhabib and her colleagues use publicly available data to unmask the identities of these marauding vessels.

Industrial fishing boats are required to carry an automatic identification system (AIS), which broadcasts information about a ship’s location, size, and nationality.
Looking at four years of satellite AIS signals in African waters, the researchers saw where each ship fished and for how long.

They found that from 2012 to 2016, industrial vessels in African waters spent nearly six percent of their time illegally fishing in protected artisanal zones.
That figure soared for nations that lack enforcement resources, like Somalia, where a staggering 93 percent of industrial fishing occurred in areas reserved for small-scale fishers.


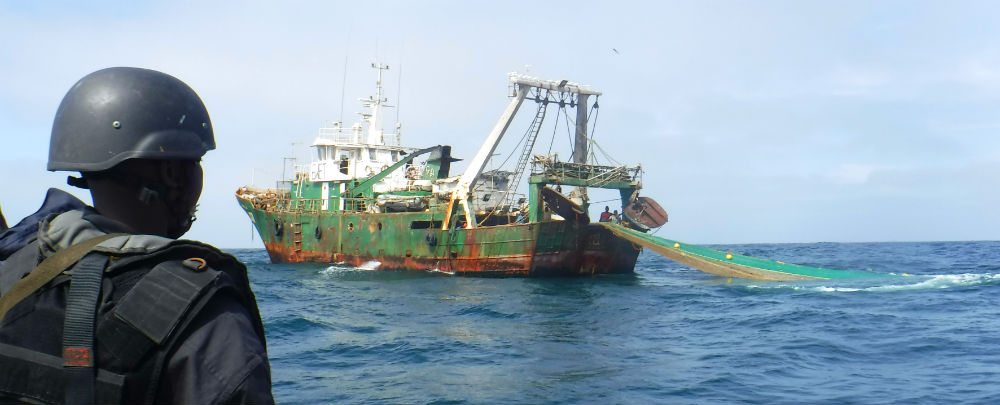
Senegalese Navy personnel board a fishing vessel

Industrial ships flying African flags—particularly from Ghana—were the worst offenders, followed by ships from South Korea, the European Union, and China.

But the high number of ships from Ghana is likely misleading.
A recent investigation revealed that much of Ghana’s national fleet is owned and operated by Chinese companies.
The practice of reflagging boats—when foreign vessels assume the flag of a different country, often one that has lax fishing standards—makes it difficult to enforce penalties for illegal fishing, such as denying permits or subsidies.
“Some of these intruding vessels have criminal pasts, have collided with other boats, have fished illegally,” says Belhabib.
“Maybe high-risk vessels shouldn’t be allowed to have a license to begin with.”

Some African nations, such as Sierra Leone and Guinea, are already using AIS data to catch vessel incursions in real time, says Belhabib.
Yet other countries’ strong industrial fishing lobbies are opposing efforts to expand fleet surveillance.

For local communities already struggling with pollution and climate change, illegal industrial fishing “is an additional stressor that depletes fisheries resources,” says Ifesinachi Okafor-Yarwood, a research consultant for Colorado-based One Earth Future who was not involved in the study.
This has far-reaching implications for social development and the attainment of multiple sustainable development goals.
“Fish is not just a source of protein,” Okafor-Yarwood explains.
“It also provides income to pay for healthcare and education.”

Links :

Thursday, February 6, 2020

US (NOAA) layer update in the GeoGarage platform

6 nautical raster charts updated

The world’s oceans are speeding up — another mega-scale consequence of climate change

A boy plays at the South Kingstown Town Beach in South Kingstown, R.I. Scientists are warning that all across the globe, ocean currents are speeding up their pace.
(Salwan Georges/The Washington Post)

From The Washington Post by Chris Mooney

Three-quarters of the world’s ocean waters have sped up their pace in recent decades, scientists reported Wednesday, a massive development that was not expected to occur until climate warming became much more advanced.

The change is being driven by faster winds, which are adding more energy to the surface of the ocean.
That, in turn, produces faster currents and an acceleration of ocean circulation.

It’s the latest dramatic finding about the stark transformation of the global ocean — joining revelations about massive coral die-offs, upheaval to fisheries, ocean-driven melting of the Greenland and Antarctic ice sheets, increasingly intense ocean heat waves and accelerating sea level rise.

“The Earth is our patient, and you look for symptoms of how it is reacting to anthropogenic greenhouse gas forcing,” said Michael McPhaden, a National Oceanic and Atmospheric Administration researcher and one author of the new study in Science Advances.
“This is another symptom.”

The new research found that 76 percent of the global ocean is speeding up, when the top 2,000 meters of the ocean are taken into account.
The increase in speed is most intense in tropical oceans and especially the vast Pacific.

Scientists aren’t certain of all the consequences of this speedup yet.
But they may include impacts in key regions along the eastern coasts of continents, where several currents have intensified.
The result in some cases has been damaging ocean hotspots that have upended marine life.

Ocean currents are speeding up faster than scientists predicted
The orange shading indicates regions with accelerating ocean circulation, and the blue shading denotes regions with decelerating the ocean circulation.
Shijian Hu

The study was led by Shijian Hu, a researcher with the Chinese Academy of Sciences, who worked with McPhaden and other experts in China, Australia and the United States.
The researchers used a global network of devices called Argo floats, as well as other data sets, to reach their conclusions.

They found a global increase in wind speed over the ocean of about 2 percent per decade since the 1990s, which translates into about a 5 percent increase per decade in the speed of ocean currents.

Since these currents do not move very fast to begin with, the change would not be noticeable from, say, the bow of a ship.
One current, the Pacific’s South Equatorial Current, typically moves at about a mile per hour, so the speed increase over one decade would only be to around 1.05 miles per hour, McPhaden said.

Still, taken across the entire planet, this represents an enormous change and a tremendous input of wind energy.
And it was not expected to happen yet.

A warming climate appears to be altering global currents, reconstructed here from satellite and ship readings.
NASA/Goddard Space Flight Center Scientific Visualization Studio

The study notes that in extreme climate warming scenarios, a speedup of global winds also occurs — but the change was expected to peak at the end of this century, after vastly more warming than has happened so far.
This suggests the Earth might actually be more sensitive to climate change than our simulations can currently show, McPhaden said.

The researchers admit they cannot prove that the change they’ve detected is driven solely by greenhouse gases.
The oceans, particularly the Pacific, have natural cycles that drive them as well.
However, they argue that the changes that have occurred are “far larger than that associated with natural variability.”

And this is not happening in isolation — multiple large changes have been detected in the world’s oceans of late.
“It’s analogous to the changes in sea level in terms of the accelerated rise over the last 25 years,” McPhaden said.
“And these may be connected, and likely are.”

Having detected a massive global change, the researchers say they have not yet teased out the local consequences.
But they are bound to be substantial.
“Perhaps the most important consequence is the increased redistribution of heat around the planet that stronger circulation would bring,” said Alex Sen Gupta, an ocean and climate expert at the University of New South Wales in Sydney, who commented on the study but was not involved in the research.
“This would affect temperature distributions and could affect weather patterns — but more work would be needed to make these links.”

Another ocean and climate expert, Edward Vizy of the University of Texas at Austin, said he suspected the scientists were onto something with their findings but also that the change may not be as large as they are reporting.
“I’m sure our ocean observations have improved in the early 2000s, so I wonder how much of the change in the ocean reanalyses is a reflection of the inclusion of this information,” he said.

So far, when it comes to the effect of climate change on ocean currents, the largest amount of attention has been paid to the North Atlantic region.
Here, a major current system — the Atlantic Meridional Overturning Circulation, or AMOC — is moving not faster, but slower.

This circulation, however, is not driven simply by winds — it is also propelled by the density of cold seawater, which determines how much water can sink and flow back southward in the deep ocean.
So, the results are not necessarily contradictory.

In related research, McPhaden and his colleagues have found that around the globe, a key set of ocean currents, which are located on the western side of ocean basins, have been shifting their movements and in some cases, intensifying.
As they’ve done so, these currents have often left behind zones of extreme warming as they transport warm waters to new places.

These changes, too, are being driven by shifting ocean winds, so they could be connected.

Waves crash near the shore in Cloudy Bay on Bruny Island in Tasmania, Australia.
(Bonnie Jo Mount/The Washington Post)

Off the eastern coast of Australia and Tasmania, for example, a current called the East Australian Current has intensified and pushed farther southward, bringing warmer waters to the Tasmanian coast and devastating the native kelp forest ecosystem that had once thrived there.
The new study shows a marked current intensification in this region.
“There is a compelling logic that says that these are related,” McPhaden said.

The current study does not focus on local impacts, however, but rather, on the global picture.
“It’s just sort of taking the pulse of the planet,” McPhaden said.
“It’s a surprise that this kind of result comes out so robustly.”

Links :
Wednesday, February 5, 2020

How the ocean is gnawing away at glaciers

The glacier front of 79 North Glacier is about 100 m thick and pushes against small islands which bulge the ice (left). The sea ice produces magical shapes and patterns (right).
Winds blowing down from the glacier push it slightly away from the glacier front.
(Photo: Janin Schaffer, Alfred-Wegener-Institut)

From AWI

The Greenland Ice Sheet is melting faster today than it did only a few years ago.
The reason: it’s not just melting on the surface – but underwater, too.
AWI researchers have now found an explanation for the intensive melting on the glacier’s underside, and published their findings in the journal Nature Geoscience.


The glaciers are melting rapidly: Greenland’s ice is now melting seven times faster than in the 1990s – an alarming discovery, since climate change will likely intensify this melting in the future, causing the sea level to rise more rapidly.
Accordingly, researchers are now working to better understand the underlying mechanisms of this melting.
Ice melts on the surface because it is exposed to the sun and rising temperatures.
But it has now also begun melting from below – including in northeast Greenland, which is home to several ‘glacier tongues’.
Each tongue is a strip of ice that has slid down into the ocean and floats on the water – without breaking off from the land ice.
The longest ice tongue, part of the ‘79° North Glacier’, is an enormous 80 km long.
Over the past 20 years, it has experienced a dramatic loss of mass and thickness, because it’s been melting not just on the surface, but also and especially from below.

Collecting measuring instruments is a particular challenge in ice-covered regions.
Here the "Mummy Chair" is used to fasten a rope with an anchor hook at the anchoring which is to be collected.
If this is successful, the anchoring is gently pulled out of the water on deck of the POLARSTERN by a crane.
(Photo: Richard Jones, Alfred-Wegener-Institut)
To measure ocean temperatures and current velocities at one location for more than a year, measuring instruments are strung together on a rope that is fixed to the ocean floor.
Buoyancy balls (orange) ensure that the so-called anchoring is in the water and does not fall to the bottom.
When the anchoring is to be recovered, it is pinged by an acoustic signal and then drifts back to the ocean surface (due to the buoyancy balls) from where we collect it.
(Photo: Andreas Preußer, Alfred-Wegener-Institut)
Too much heat from the ocean

A team led by oceanographer Janin Schaffer from the Alfred Wegener Institute, Helmholtz Centre for Polar and Marine Research (AWI) in Bremerhaven has now identified the source of this intense underwater melting.
The conclusions of their study, which the experts have just released in the journal Nature Geoscience, are particularly unsettling because the melting phenomenon they discovered isn’t unique to the 79° North Glacier, which means it could produce similar effects elsewhere.

The POLARSTERN in front of a part of the glacier tongue which reaches far into the land and swims on the ocean for 80 km.
In the summer of 2016, the POLARSTERN was the first ship ever to sail to the edge of the 79 North Glacier in northeast Greenland.
The wind had pushed away all sea ice, and thus the otherwise ice-covered region was completely ice-free for one week.
This enabled us to measure the ocean and the ground accurately.
(Photo: Nat Wilson, Alfred-Wegener-Institut)

For the purposes of the study, the researchers conducted the first extensive ship-based survey of the ocean floor near the glacier, which revealed the presence of a two-kilometre-wide trough, from the bottom of which comparatively warm water from the Atlantic is channelled directly toward the glacier.
But that’s not all: in the course of a detailed analysis of the trough, Janin Schaffer spotted a bathymetric sill, a barrier that the water flowing over the seafloor has to overcome.
Once over the hump, the water rushes down the back of the sill – and under the ice tongue.
Thanks to this acceleration of the warm water mass, large amounts of heat from the ocean flow past the tongue every second, melting it from beneath.
To make matters worse, the layer of warm water that flows toward the glacier has grown larger: measured from the seafloor, it now extends 15 metres higher than it did just a few years ago.
“The reason for the intensified melting is now clear,” Schaffer says.
“Because the warm water current is larger, substantially more warmth now makes its way under the ice tongue, second for second.”


Sketch of the cavity circulation and water masses at the 79 North Glacier
(Graphic: Janin Schaffer, Alfred-Wegener-Institut)

Other regions are also affected

In order to determine whether the phenomenon only manifests at the 79° North Glacier or also at other sites, the team investigated a neighbouring region on Greenland’s eastern coast, where another glacier, the Zachariæ Isstrøm, juts out into the sea, and where a large ice tongue had recently broken off from the mainland.
Working from the surface of an ice floe, the experts measured water temperatures near the ocean floor.


On the 80 km long and 20 km wide glacier tongue, torrential meltwater streams make their way towards the ocean
(Photo: Janin Schaffer, Alfred-Wegener-Institut)

According to Schaffer: “The readings indicate that here, too, a bathymetric sill near the seafloor accelerates warm water toward the glacier.
Apparently, the intensive melting on the underside of the ice at several sites throughout Greenland is largely produced by the form of the seafloor.”
These findings will ultimately help her more accurately gauge the total amount of meltwater that the Greenland Ice Sheet loses every year.

Links :

Tuesday, February 4, 2020

What is a Rossby wave?


Rossby waves naturally occur in rotating fluids.
Within the Earth's ocean and atmosphere, these planetary waves play a significant role in shaping weather.
This animation from NASA's Goddard Space Flight Center shows both long and short atmospheric waves as indicated by the jet stream.
The colors represent the speed of the wind ranging from slowest (light blue colors) to fastest (dark red).

From NOAA

Oceanic and atmospheric Rossby waves — also known as planetary waves — naturally occur largely due to the Earth's rotation.
These waves affect the planet's weather and climate.

Oceanic Rossby Waves

Waves in the ocean come in many different shapes and sizes.
Slow-moving oceanic Rossby waves are are fundamentally different from ocean surface waves.
Unlike waves that break along the shore, Rossby waves are huge, undulating movements of the ocean that stretch horizontally across the planet for hundreds of kilometers in a westward direction.
They are so large and massive that they can change Earth's climate conditions.
Along with rising sea levels, King Tides, and the effects of El Niño, oceanic Rossby waves contribute to high tides and coastal flooding in some regions of the world.

Rossby wave movement is complex.
The horizontal wave speed of a Rossby (the amount of time it takes the wave to travel across an ocean basin) is dependent upon the latitude of the wave. In the Pacific, for instance, waves at lower latitudes (closer to the equator) may take months to a year to cross the ocean.
Waves that form farther away from the equator (at mid-latitudes) of the Pacific may take closer to 10 to 20 years to make the journey.
The vertical motion of Rossby waves is small along the ocean's surface and large along the deeper thermocline — the transition area between the ocean's warm upper layer and colder depths.
This variation in vertical motion of the water's surface can be quite dramatic: the typical vertical movement of the water's surface is generally four inches or less, while the vertical movement of the thermocline for the same wave is approximately 1,000 times greater.
In other words, for a four inch or less surface displacement along the ocean surface, there may be more than 300 feet of corresponding vertical movement in the thermocline far below the surface!
Due to the small vertical movement along the ocean surface, oceanic Rossby waves are undetectable by the human eye.
Scientists typically rely on satellite radar altimetry to detect the massive waves.

Atmospheric Rossby Waves

According to the National Weather Service, atmospheric Rossby waves form primarily as a result of the Earth's geography. Rossby waves help transfer heat from the tropics toward the poles and cold air toward the tropics in an attempt to return atmosphere to balance.
They also help locate the jet stream and mark out the track of surface low pressure systems.
The slow motion of these waves often results in fairly long, persistent weather patterns.

 Links :

Monday, February 3, 2020

British Isles & misc. (UKHO) layer update in the GeoGarage platform

see GeoGarage news 

 Satellite imagery used to keep nautical charts up to date
courtesy of : UKHO

Scientists create cyborg jellyfish with swimming superpowers

This artist illustration shows what the robotic-hybrid jellyfish look like.
Rebecca Konte/Caltech

From CNET by Amanda Kooser

They're like regular jellyfish, but faster and more awesome.

Darth Vader and RoboCop now have some cyborg company in the form of superpowered jellyfish. Researchers at the California Institute of Technology have developed a swim controller that turns regular jellyfish into speed demons.

The device enhances a jellyfish's natural pulsing motion that it uses to move around in the water.
"The new prosthetic uses electrical impulses to regulate -- and speed up -- that pulsing, similar to the way a cardiac pacemaker regulates heart rate," Caltech said in a release on Wednesday.

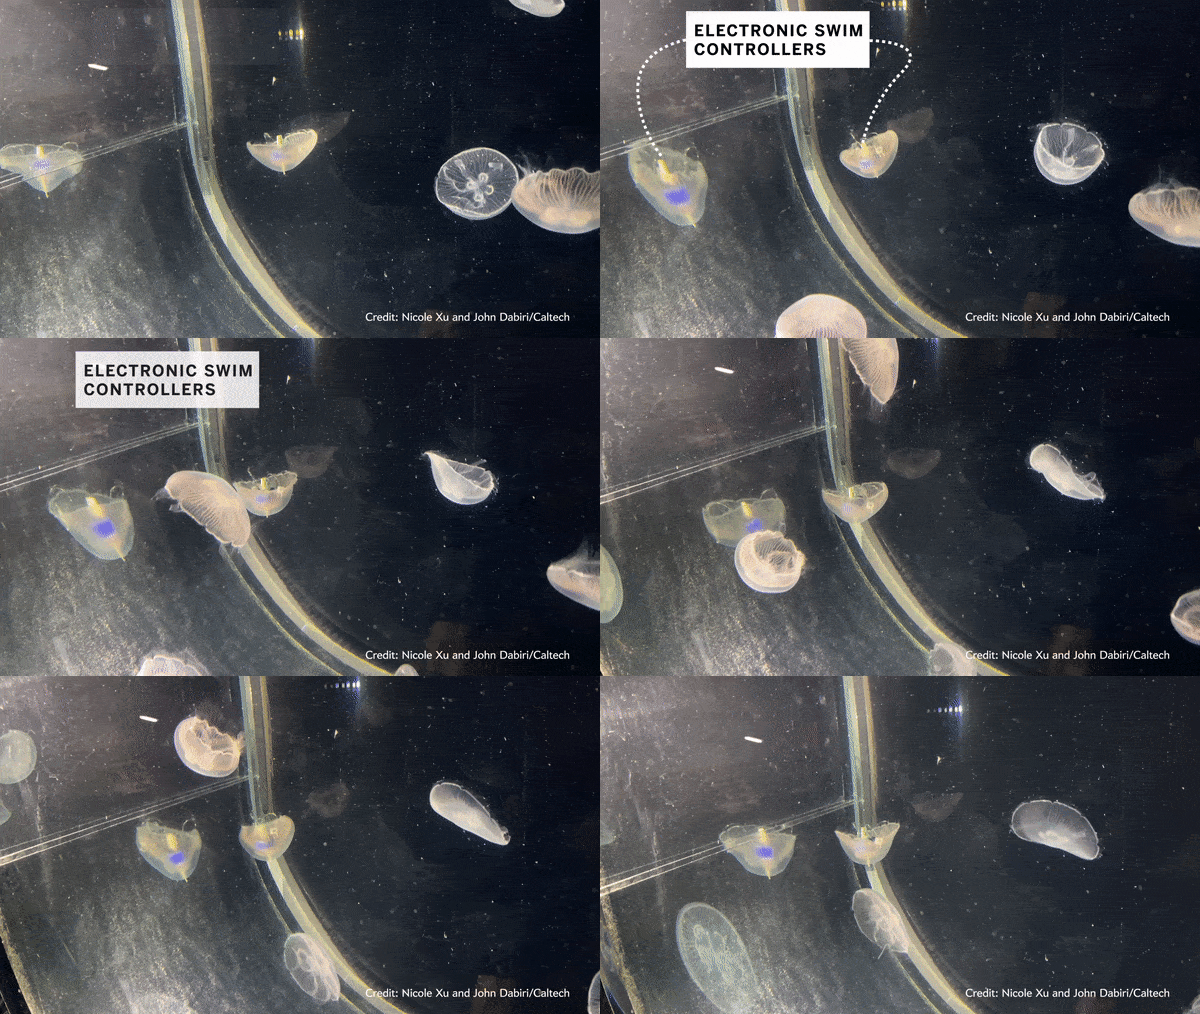
Researchers fitted some moon jellyfish with a prosthetic “swim controller”
Credit: Nicole Xu and John Dabiri Caltech

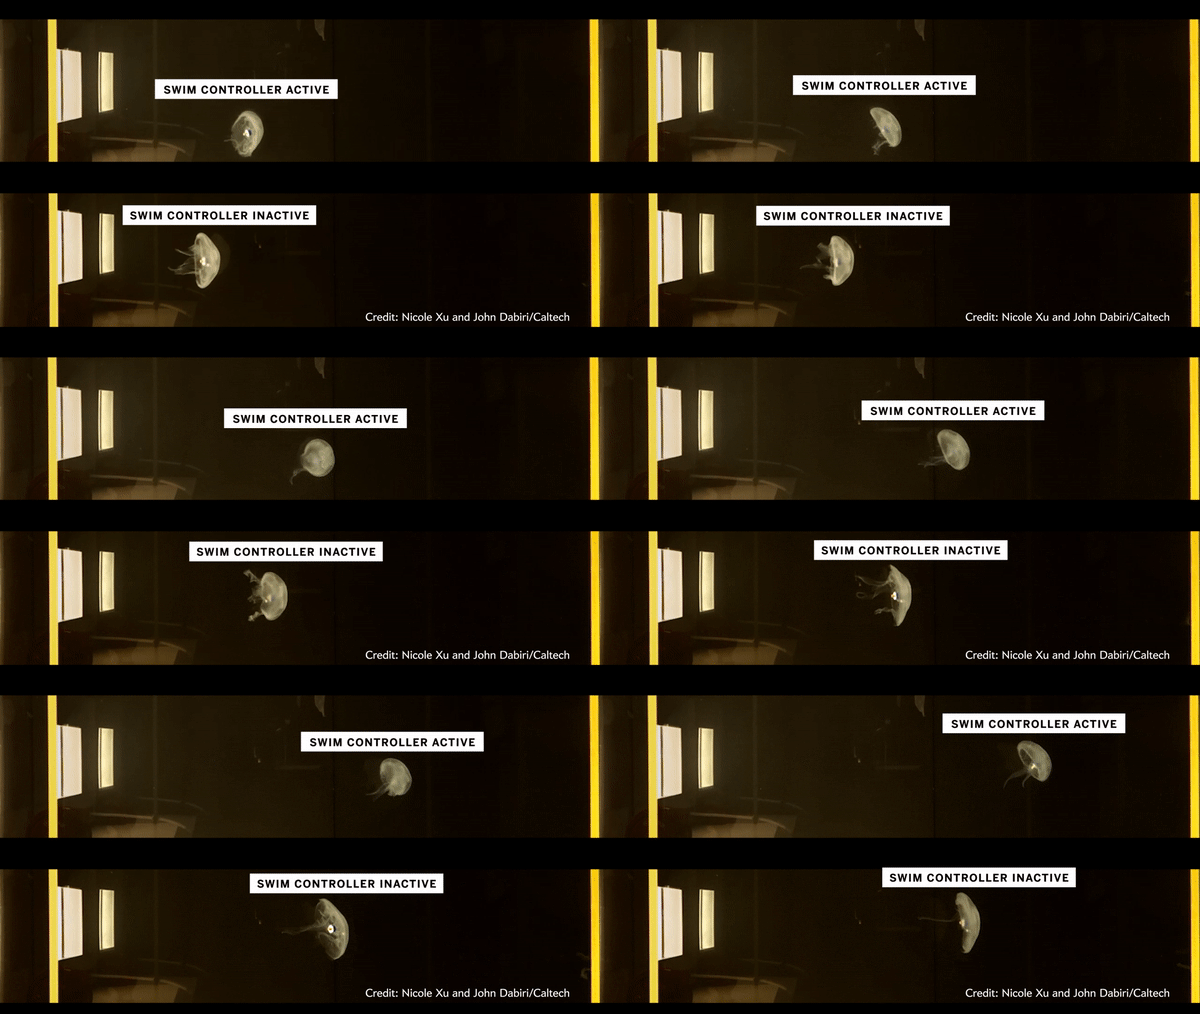
The electronic swim controller made the modified jellyfish swim nearly three times faster than their normal speed
Credit: Nicole Xu and John Dabiri Caltech 

The microelectronic prosthetic propels the cyborg jellyfish to swim almost three times faster while using just twice the metabolic energy of their unmodified peers.
The prosthetics can be removed without harming the jellyfish.

The research team published its findings in the journal Science Advances on Wednesday.

The scientists aren't making superpowered jellies just for fun.
The cyborg invertebrates could potentially carry sensors into the ocean to gather data from otherwise hard-to-reach locations.

Engineers at Caltech and Stanford University have developed a tiny prosthetic that enables jellyfish to swim faster and more efficiently than they normally do, without stressing the animals.
The researchers behind the project envision a future in which jellyfish equipped with sensors could be directed to explore and record information about the ocean.

The Navy funded a jellyfish-inspired robot project in 2012, but the biohybrid approach has some advantages.
The cyborgs don't have the power limitations of full-on robots and don't need to be tethered to an external power source.

"If we can find a way to direct these jellyfish and also equip them with sensors to track things like ocean temperature, salinity, oxygen levels, and so on, we could create a truly global ocean network where each of the jellyfish robots costs a few dollars to instrument and feeds themselves energy from prey already in the ocean," said Caltech engineer and research lead John Dabiri.

It sounds like sci-fi, but an army of cyborg jellies may play a role in the future of ocean exploration and monitoring.

Links :

Sunday, February 2, 2020

Nomad Africa

A visual experiment featuring surfer Alex Smith and the wild, eccentric landscapes of Africa.