
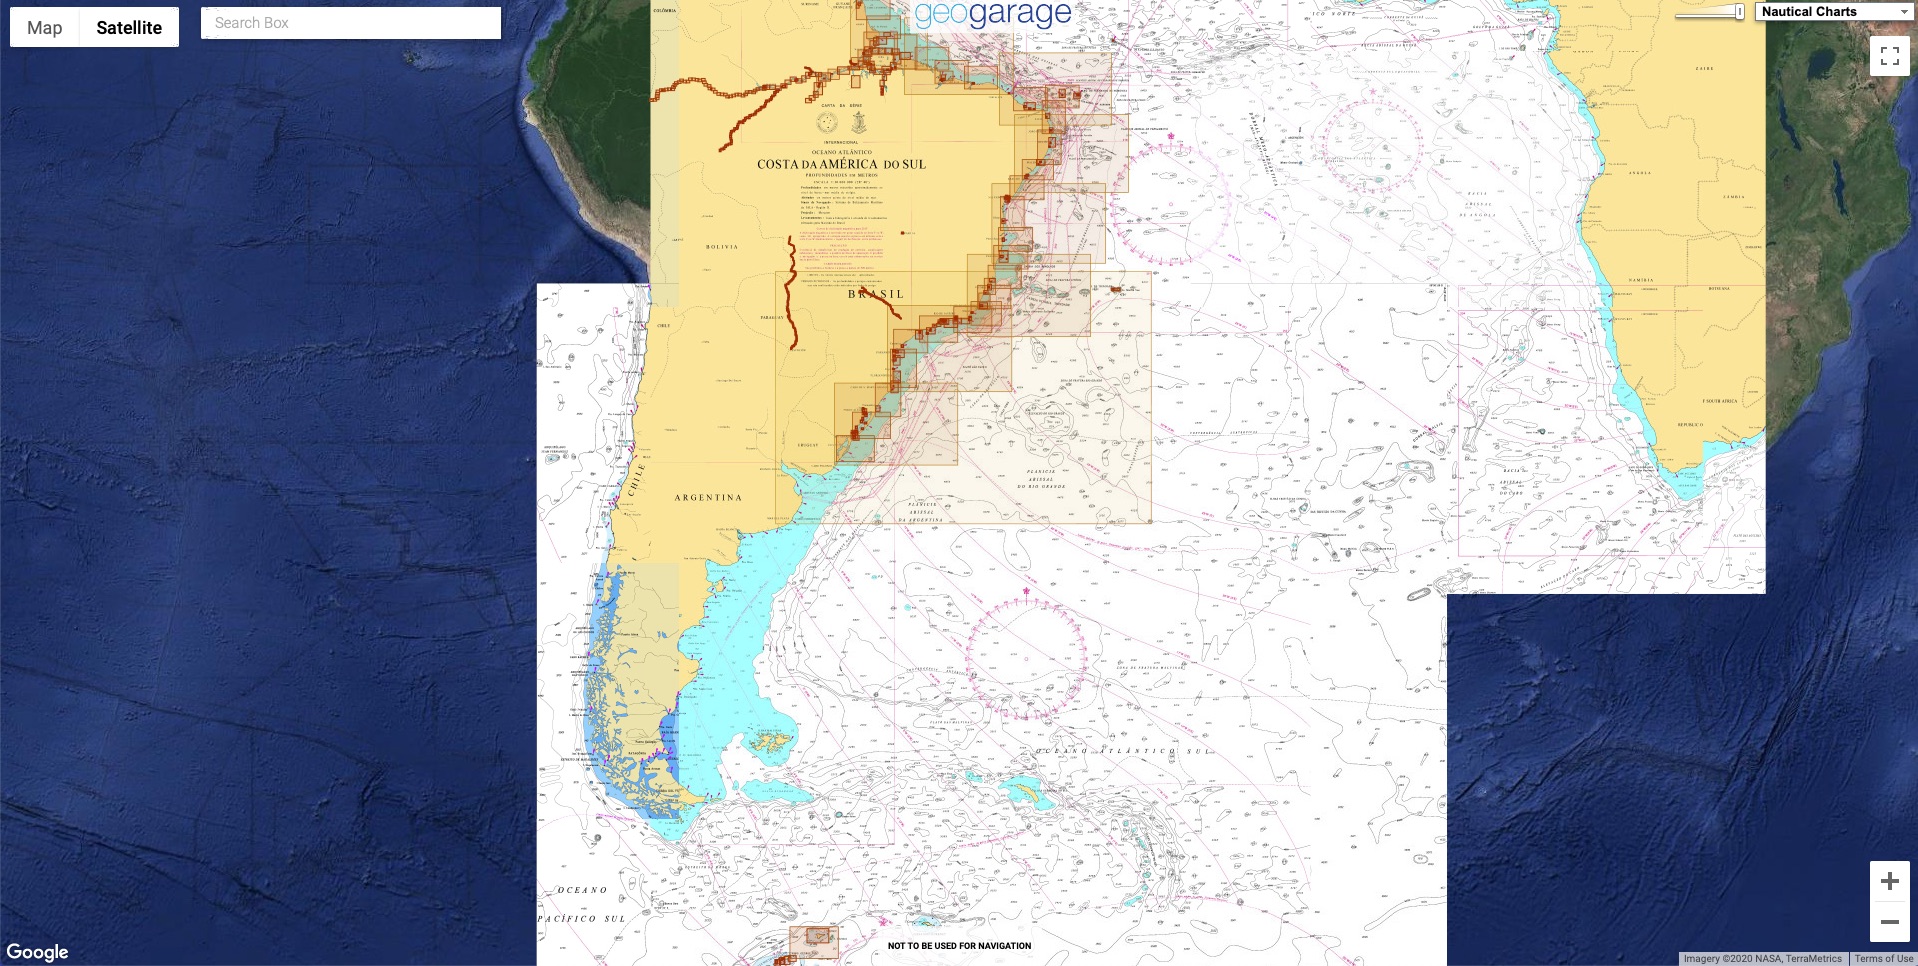
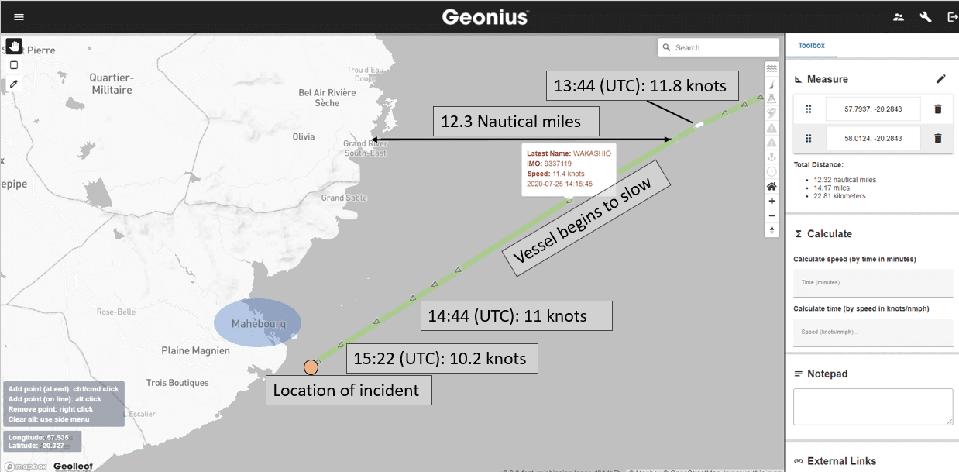
Rasterized ENC display with the GeoGarage online platform :
Similary with RNC raster charts, a lot easier to see if you’re leaving the intended scale
(Dubrovnik HHI Croatia)
From IHO
Executive summary
This information paper focuses on the importance of understanding ENC compilation scale and the safety implications of using ENC data beyond its intended usage, during both the Electronic Chart Display and Information Systems (ECDIS) route planning and checking and route monitoring phases of navigation.
The paper provides ECDIS users with information regarding the process Hydrographic Offices employ to transform the physical world into a 2D Electronic Navigational Chart (ENC) that can be used in an ECDIS.
Within the paper the following topics are covered:


ECDIS safety checking function
Since July 2018 all SOLAS vessels of 500GT and upwards are required to be using ENCs created by Hydrographic Offices in type-approved ECDIS equipment.
IMO Performance Standard for ECDIS (11.4.6) requires;
Where passage planning is conducted on ECDIS, use of the route checking function is a key component of the overall process of checking the suitability of a planned route and complements the visual check of that route.
The route checking function is dependent upon a number of parameters set by the Mariner as part of setting up the ship’s ECDIS for the voyage.

The ECDIS safety checking function verifies the user-defined safety corridor against the entire chart database in the ECDIS for dangers, not just against the extent of visual point symbols displayed on screen.
Example 2:
In the second example (Figure 5), the planned route lies 55m further to the west.

Given the size of the reef in the examples, it must be stressed that it would typically warrant capture by the cartographer as an area feature within an ENC compiled at the scale of the examples; and only at significantly smaller compilation scales would it be captured as a point feature.
A similar scenario and associated safety implications equally applies to the ECDIS look-ahead function and XTD once the ship is underway and monitoring along the planned route.
ENC over-scaling
A key difference to note between charted area features and point features on an ECDIS display is that area features change size in proportion to the scale at which the ENC is being viewed, whereas point feature size remains constant irrespective of display scale (see Figure 2); in other words they are not enlarged as viewing scale is increased.
Additionally, the size and shape of the point symbol does not necessarily represent the size or shape of the physical, real-world feature it is depicting.
Traditionally, nautical cartographers have sought to ensure that the symbol on the chart is larger than the real-world feature it represents when seen at the chart’s compilation scale. 
The ECDIS has the functionality to allow ENCs to be displayed at scales larger than the original compilation scale.

It is important to also note that the ECDIS will provide an indication if the ship’s position is covered by an ENC at a larger scale than the current ENC being used in the ECDIS display.
Conclusions and recommendations
With many additional ENC tools capable of planning routes the Mariner must still be aware that only the ECDIS is certified for carrying out route planning and monitoring.
Executive summary
This information paper focuses on the importance of understanding ENC compilation scale and the safety implications of using ENC data beyond its intended usage, during both the Electronic Chart Display and Information Systems (ECDIS) route planning and checking and route monitoring phases of navigation.
The paper provides ECDIS users with information regarding the process Hydrographic Offices employ to transform the physical world into a 2D Electronic Navigational Chart (ENC) that can be used in an ECDIS.
Within the paper the following topics are covered:
- Cartographic generalization practices
- ENC Compilation Scale
- ECDIS safety checking functions
- ENC over-scaling
- Conclusions and recommendations
note : while this article applies to ENCs and ECDIS, it is also appropriate for recreational users with ECS or mobile apps.
Cartographic generalization practices
For centuries marine cartographers have been using generalization techniques to transform our view of the world from a true three-dimensional reality to a scaled, two-dimensional abstract view.
Many aspects to generalization are used by Hydrographic Offices when creating navigational products: classification, simplification, exaggeration, and symbolization.
Classification: Groups features into classes having identical or similar attributes.
Organizing features into fewer classes helps to simplify and clarify the message of the navigational chart.
Simplification: Features are simplified by either smoothing or compacting. Smoothing is generally used for linear features such as depth contours and coastlines where each curve cannot be depicted because of scale or because the detail would clutter the chart.
IHO Chart Specification S-4 states ‘Contours should be smoothed only where it is necessary to remove intricacies which would confuse mariners.
Where necessary, smoothing will include deeper water within shoaler contours (that is: it must be shoal-biased), but an attempt to retain a reasonable representation of the seabed should be made’.
In compacting, if there are many features in a small area, such as isolated rocks which will just be dots at chart scale; those features may be grouped (compacted) within a single obstruction area.
Exaggeration: Due to scale, certain features must be shown larger than their actual relative size. Dangerous features such as rocks, wrecks and obstructions would at certain scales be unreadable if shown at their correct size, so they are exaggerated enough to be recognized and to show their relationship to other similar features.
Symbolization: Symbols are used on charts to inform the Mariner what features are.
Nautical chart symbols use shape and colour to help the Mariner quickly understand the importance of certain features.
For example, the colour magenta is generally reserved for drawing attention to symbols for features which have a significance extending beyond their immediate location; or are not themselves a physical feature (such as administrative and restricted areas; or routeing measures).
Globally accepted cartographic practices include the use of point symbols to represent real- world area features when the scale of the product is reduced but the importance of the feature is such that the cartographer wants to retain that information.
ENC Compilation Scale
The viewing scale of a paper chart is determined and fixed by the cartographer at the chart compilation stage, so symbols are typically larger than the extent of the real-world feature they represent and do not change.
The situation is different when ENCs are used in ECDIS as the Mariner can zoom in and out beyond the ENC compilation scale.
Zooming in to a larger scale introduces the risk that any positional errors that may exist in the ENC data are magnified to a point where the data becomes unsafe to use – and this fact will not be immediately apparent as the ECDIS will continue to display the text and symbols at a fixed size.
ENC producers use a variety of methods to define the compilation scale of their ENC data, but for safety reasons these will always take into account the scale at which the source information was captured.
To ensure consistency, and thus contribute to improved display, most ENCs are assigned to one of the IHO’s recommended standard compilation scales.
These are defined within the IHO’s S-65 publication, together with an example of the navigational purpose to which each ENC scale may be assigned.
The various compilation scales define the level of detail that can be included, and how that detail is depicted.
The various compilation scales define the level of detail that can be included, and how that detail is depicted.
While a feature may be depicted as an area or line feature at a large compilation scale, it may be depicted as a point feature at a smaller scale.
Some object classes within an ENC, such as wrecks, rocks and obstructions including reefs, may therefore be defined by the cartographer as points, lines or areas depending on the compilation scale of the ENC and other factors.
One major factor is whether the symbol for a feature will be larger than its true (real-world) extent, if known, at the chosen compilation scale.
Charted point features only indicate that a certain feature object exists in a given point location.
Charted point features only indicate that a certain feature object exists in a given point location.
While a light beacon may be charted as a point feature, a point feature may also define the approximate centre of a feature that actually has an ‘area’, such as a small reef.
This means that, unlike charted area features, the only positional information available for a point feature is its geographical position (a point represented by latitude and longitude coordinates), and not its true extent (such as the distance from the charted point centre of a reef to its edge).
This is particularly important in ECDIS where the Mariner chooses to over-scale the chart display (see Figure 8)

Figure 1: Comparison of small reef within source data at ENC compilation scale, point symbol depiction on ENC, and source data overlaid on ENC
Images show survey data (left), section of ENC (centre) and ENC superimposed on survey data at compilation scale (right).
Source: Australian Hydrographic Office (AHO) and ATSB (Australian Transport Safety Bureau)
Images show survey data (left), section of ENC (centre) and ENC superimposed on survey data at compilation scale (right).
Source: Australian Hydrographic Office (AHO) and ATSB (Australian Transport Safety Bureau)

Figure 2: Comparison of area features and point features at different scales
These images show the same ENC displayed at two differing scales.
These images show the same ENC displayed at two differing scales.
The two images demonstrate a key difference between point and area features – area features change size in proportion to the ENC display scale, however the point features remain the same size regardless of display scale.
Source: Electrotech, annotations by the AHO.
Source: Electrotech, annotations by the AHO.
ECDIS safety checking function
Since July 2018 all SOLAS vessels of 500GT and upwards are required to be using ENCs created by Hydrographic Offices in type-approved ECDIS equipment.
The use of ENCs within ECDIS provides a wide range of advantages; it simplifies voyage planning, allowing easy modification of routes and offers many safety benefits.
Routes can be checked for potential dangers based on the safety parameters input by the Mariner.
The safety contour defines the safe water the vessel can navigate in based on the depth areas and contours included in the ENC; and the safety depth defines isolated dangers that are located in otherwise “safe” water.
During route monitoring it is also possible for the ECDIS to be configured to alarm and indicate on features set by the Mariner, alerting navigators to impending dangerous situations.
IMO Resolution A.893(21) adopted on 25 November 1999 Guidelines for Voyage Planning states that;
IMO Resolution A.893(21) adopted on 25 November 1999 Guidelines for Voyage Planning states that;
This clause requires vessels to carry all appropriate scale ENCs for their intended voyage, thus minimizing any effects of generalization and ensuring the ECDIS can alert the Mariner to dangers by using the largest scale data available.‘(2.1) All information relevant to the contemplated voyage or passage should be considered.The following items should be taken into account in voyage and passage planning: appropriate scale, accurate and up-to-date charts to be used for the intended voyage or passage, as well as any relevant permanent or temporary notices to mariners and existing radio navigational warnings.’
IMO Performance Standard for ECDIS (11.4.6) requires;
‘An indication should be given to the mariner if, continuing on its present course and speed, over a specified time or distance set by the mariner, own ship will pass closer than a user-specified distance from a danger (e.g. obstruction, wreck, rock) that is shallower than the mariner’s safety contour or an aid to navigation.’The route checking functions built into ECDIS to check and monitor a route for dangers is a fundamental safety benefit for Mariners.
Where passage planning is conducted on ECDIS, use of the route checking function is a key component of the overall process of checking the suitability of a planned route and complements the visual check of that route.
The route checking function is dependent upon a number of parameters set by the Mariner as part of setting up the ship’s ECDIS for the voyage.
These parameters include a vertical accuracy component, resulting in a safety depth setting; and a horizontal accuracy component, which includes both an allowance for the accuracy of the ship’s navigation system and a minimum permissible planned distance from dangers.
These settings may be changed for different voyages, and even different phases of a voyage, based on the bathymetric data quality information included in the ENC (such as the Category of Zone of Confidence in Data (CATZOC) attribute on the mandatory Quality of Data (M_QUAL) feature). The settings combine to create a route safety region around a vessel’s planned track.

Figure 3: The component parts of determining an appropriate route safety region around a vessel’s planned track
Figure 3 shows the minimum considerations when determining what allowance should be made for charted dangers on or near a planned route.
Figure 3 shows the minimum considerations when determining what allowance should be made for charted dangers on or near a planned route.
These include allowances for the accuracy of the ship’s positioning system, and for the accuracy of the chart.
The dashed lines indicate the possible worst- case scenario for the Mariner.
Source: AHO.
Source: AHO.
The ECDIS safety checking function verifies the user-defined safety corridor against the entire chart database in the ECDIS for dangers, not just against the extent of visual point symbols displayed on screen.
The ECDIS will graphically identify points along the proposed route that are a danger to the vessel and return a textual list of the same hazards.
ECDIS safety check only verifies data along the user-defined corridor; the width of the corridor is set by the Cross Track Distance (XTD).
ECDIS safety check only verifies data along the user-defined corridor; the width of the corridor is set by the Cross Track Distance (XTD).
The safety check will be performed against the largest scale information within the ECDIS system irrespective of the ECDIS display scale.
Point features will only be identified as hazards if they fall within the safety zone being checked regardless of the size of the symbol displayed on screen and regardless of the actual extent of the physical feature it represents.
Due to the compilation scale of the ENC there could be occasions where the charted point feature may not represent the full extent of the real-world feature.
The Mariner must therefore ensure his safety corridor XTD is sufficiently wide enough to identify all navigational dangers along the intended route.
Mariners are also required to conduct a thorough visual check of the intended route to complement the automated safety check.
The two following fictitious examples show how a hazardous point feature could be missed if the correct ENC scale charts are not loaded in the ECDIS and route XTD is not adequately set.
Example 1
In the first example (Figure 4), the charted position of the ‘isolated danger’ point feature representing the reef lies about 55m to the east of the planned route and falls within the route safety region.
As this point lies within the route safety region set by the Mariner, the ECDIS will detect the reef as a danger close to the planned route and include it in the list of dangers for that leg of the route.

Figure 4: Planned route covers the position of the point symbol
(Scale of Figure is approximately 1:6000; scale of ENC containing the point symbol is 1:90000. )
Figure 4 shows the planned route and the ECDIS route safety region based on a 100m Cross Track Distance (XTD) near the point position used to represent the reef within the ENC.
Note that the charted point position lies within the route safety region and will result in an ECDIS alert.
Source: DigitalGlobe, Esri, modified and annotated by the ATSB and the AHO.
Source: DigitalGlobe, Esri, modified and annotated by the ATSB and the AHO.
Example 2:
In the second example (Figure 5), the planned route lies 55m further to the west.
The charted position of the point feature now lies outside the ECDIS route safety zone set by the Mariner.
In this case, the ECDIS will not detect the reef as a danger on or close to the planned route. However, the reef still clearly presents a danger to the ship.
In this situation, if the vessel has not taken into account the possibility of isolated reefs within the region, and resultantly extended the XTD to at least account for the horizontal accuracy component of the underlying quality information (CATZOC), there is a possibility the danger could be missed during the visual inspection and the vessel could potentially run aground without the ECDIS indicating the danger on the planned route.
In this situation, if the vessel has not taken into account the possibility of isolated reefs within the region, and resultantly extended the XTD to at least account for the horizontal accuracy component of the underlying quality information (CATZOC), there is a possibility the danger could be missed during the visual inspection and the vessel could potentially run aground without the ECDIS indicating the danger on the planned route.

Figure 5: Planned route misses the position of the point symbol
Figure 5 shows a similar planned route and route safety region, 55m further west, near the same point position used to represent the reef within the ENC.
Figure 5 shows a similar planned route and route safety region, 55m further west, near the same point position used to represent the reef within the ENC.
The charted point position now lies outside the route safety region and therefore no longer results in an ECDIS alert.
However the route still passes over the true reef extent.
Source: DigitalGlobe, Esri, modified and annotated by the ATSB and the AHO.
Source: DigitalGlobe, Esri, modified and annotated by the ATSB and the AHO.
Given the size of the reef in the examples, it must be stressed that it would typically warrant capture by the cartographer as an area feature within an ENC compiled at the scale of the examples; and only at significantly smaller compilation scales would it be captured as a point feature.
A similar scenario and associated safety implications equally applies to the ECDIS look-ahead function and XTD once the ship is underway and monitoring along the planned route.
ENC over-scaling
A key difference to note between charted area features and point features on an ECDIS display is that area features change size in proportion to the scale at which the ENC is being viewed, whereas point feature size remains constant irrespective of display scale (see Figure 2); in other words they are not enlarged as viewing scale is increased.
Additionally, the size and shape of the point symbol does not necessarily represent the size or shape of the physical, real-world feature it is depicting.
Traditionally, nautical cartographers have sought to ensure that the symbol on the chart is larger than the real-world feature it represents when seen at the chart’s compilation scale.
Navigational purpose is also taken into consideration; a chart that is intended for coastal navigation, where it is not intended that the chart is to be used for close approach to isolated features, may also factor into the decision of the cartographer as to whether to depict a feature as an area or a point symbol on the chart.
This practice remains true in the preparation of ENC, where the compilation scale defines the maximum intended viewing scale for that ENC in ECDIS.
However, when the ENC is viewed at scales progressively larger than the compilation scale, the intended relationship between the point symbol and the area feature it represents is broken; as the ENC is progressively ‘over-scaled’ on screen, the symbol represents a progressively smaller proportion of the real-world feature, such as a reef area, on the ECDIS display.
However, when the ENC is viewed at scales progressively larger than the compilation scale, the intended relationship between the point symbol and the area feature it represents is broken; as the ENC is progressively ‘over-scaled’ on screen, the symbol represents a progressively smaller proportion of the real-world feature, such as a reef area, on the ECDIS display.
This can lead to an incorrect assumption by the Mariner that they may go closer to the edge of the point symbol when the display is ‘over-scaled’; this would be a dangerous assumption.
As a point feature, a reef is charted in a specific latitude/longitude position on the ENC, typically representing the centre of the area of the reef.
As a point feature, a reef is charted in a specific latitude/longitude position on the ENC, typically representing the centre of the area of the reef.
Visually, this means that the symbol representing the reef will always be centred on this position (see Figure 1); and when viewed at the ENC compilation scale, or smaller, the symbol will typically cover the true extent of that reef.
On the ECDIS display, the symbol always maintains an absolute size of 7mm in diameter regardless of the scale at which the ENC is viewed (see Figure 6).
However, if the display scale has been over-scaled to twice the ENC compilation scale, a considerable extent of the reef (previously covered by the symbol), may now extend well beyond the symbol, without any indication of such in the ECDIS (see Figure 8).

Figure 6: Isolated danger (point) symbol in ECDIS
Source: IHO.
Source: IHO.
The ECDIS has the functionality to allow ENCs to be displayed at scales larger than the original compilation scale.
However, the ability to zoom in beyond the compilation scale (the maximum intended viewing scale) has introduced an inherent risk that is not present in paper charts.
To minimize these risks, ECDIS includes indicators to alert when an ENC is being viewed beyond the maximum intended viewing scale.

- Over-scale indication shown within the graphical user interface
- Over-scale (jail bar) pattern

Source: AHO.
Figure 7: Over-scale indication and over-scale pattern on ECDIS
Figure 7: Over-scale indication and over-scale pattern on ECDIS

Figure 8: Over-scale indication and over-scale pattern on ECDIS
In the image on the left, shown at maximum intended viewing scale, a Mariner can immediately see that passing close to the charted isolated danger would be unwise.
In contrast, in the image on the right, shown over-scaled, passing the same distance from the same isolated danger appears safe.
Unfortunately, as the symbol has not been enlarged in proportion to the display scale, it no longer fully covers the reef, resulting in a hazardous navigation situation.
Source: AHO.
Source: AHO.
It is important to also note that the ECDIS will provide an indication if the ship’s position is covered by an ENC at a larger scale than the current ENC being used in the ECDIS display.
Conclusions and recommendations
With many additional ENC tools capable of planning routes the Mariner must still be aware that only the ECDIS is certified for carrying out route planning and monitoring.
To ensure safety and compliance it is imperative that all the appropriate scale ENCs are used in the ECDIS for adequate route planning and monitoring.
The route must be automatically safety checked and a visual inspection performed at the largest scale possible, based on the available portfolio of ENCs, before the voyage commences.
To ensure all dangers are identified by the ECDIS auto safety check function the Cross Track Distance must be appropriately set, taking into account factors such as the accuracy of the ship’s positioning and navigation system; the bathymetric data quality information included in the ENCs (such as CATZOC); and the intended navigational purpose of the ENCs loaded into the ECDIS.
There is a common misconception by some Mariners that zooming in beyond the compilation scale of the ENC allows for greater accuracy – however, this is not the case. In reality zooming in beyond the intended maximum display scale of ENCs may be misleading and dangerous, particularly for ‘isolated dangers of depth less than the safety depth’.
The risks associated with over-scaling the ENC within ECDIS are two-fold:
Mariners are strongly advised not to zoom in ECDIS beyond the compilation scale to a point where the ECDIS over-scale indication or pattern are triggered.
Some ECDIS allow the operator to turn off over-scale warnings.
There is a common misconception by some Mariners that zooming in beyond the compilation scale of the ENC allows for greater accuracy – however, this is not the case. In reality zooming in beyond the intended maximum display scale of ENCs may be misleading and dangerous, particularly for ‘isolated dangers of depth less than the safety depth’.
The risks associated with over-scaling the ENC within ECDIS are two-fold:
Firstly, the symbol selected by the cartographer to represent a real-world feature may no longer fully cover that feature.
Secondly, but most importantly, because the text and point symbols stay the same size within the over-scaled ENC, any sense of appropriate distance from a potential danger is no longer intuitive and can result in a false sense of safety that does not reflect reality.
Secondly, but most importantly, because the text and point symbols stay the same size within the over-scaled ENC, any sense of appropriate distance from a potential danger is no longer intuitive and can result in a false sense of safety that does not reflect reality.
Mariners are strongly advised not to zoom in ECDIS beyond the compilation scale to a point where the ECDIS over-scale indication or pattern are triggered.
Some ECDIS allow the operator to turn off over-scale warnings.
This is not recommended under normal circumstances.
Familiarization with all the core functions of the ECDIS are mandatory requirements within STCW and are essential for safe navigation.
Familiarization with all the core functions of the ECDIS are mandatory requirements within STCW and are essential for safe navigation.
Mariners must be familiar with the properties of the ECDIS; and develop a sufficient understanding of how and when the ECDIS indicates that ENC data is being displayed at an unsafe scale, so that the display settings can be adjusted accordingly.
Links :
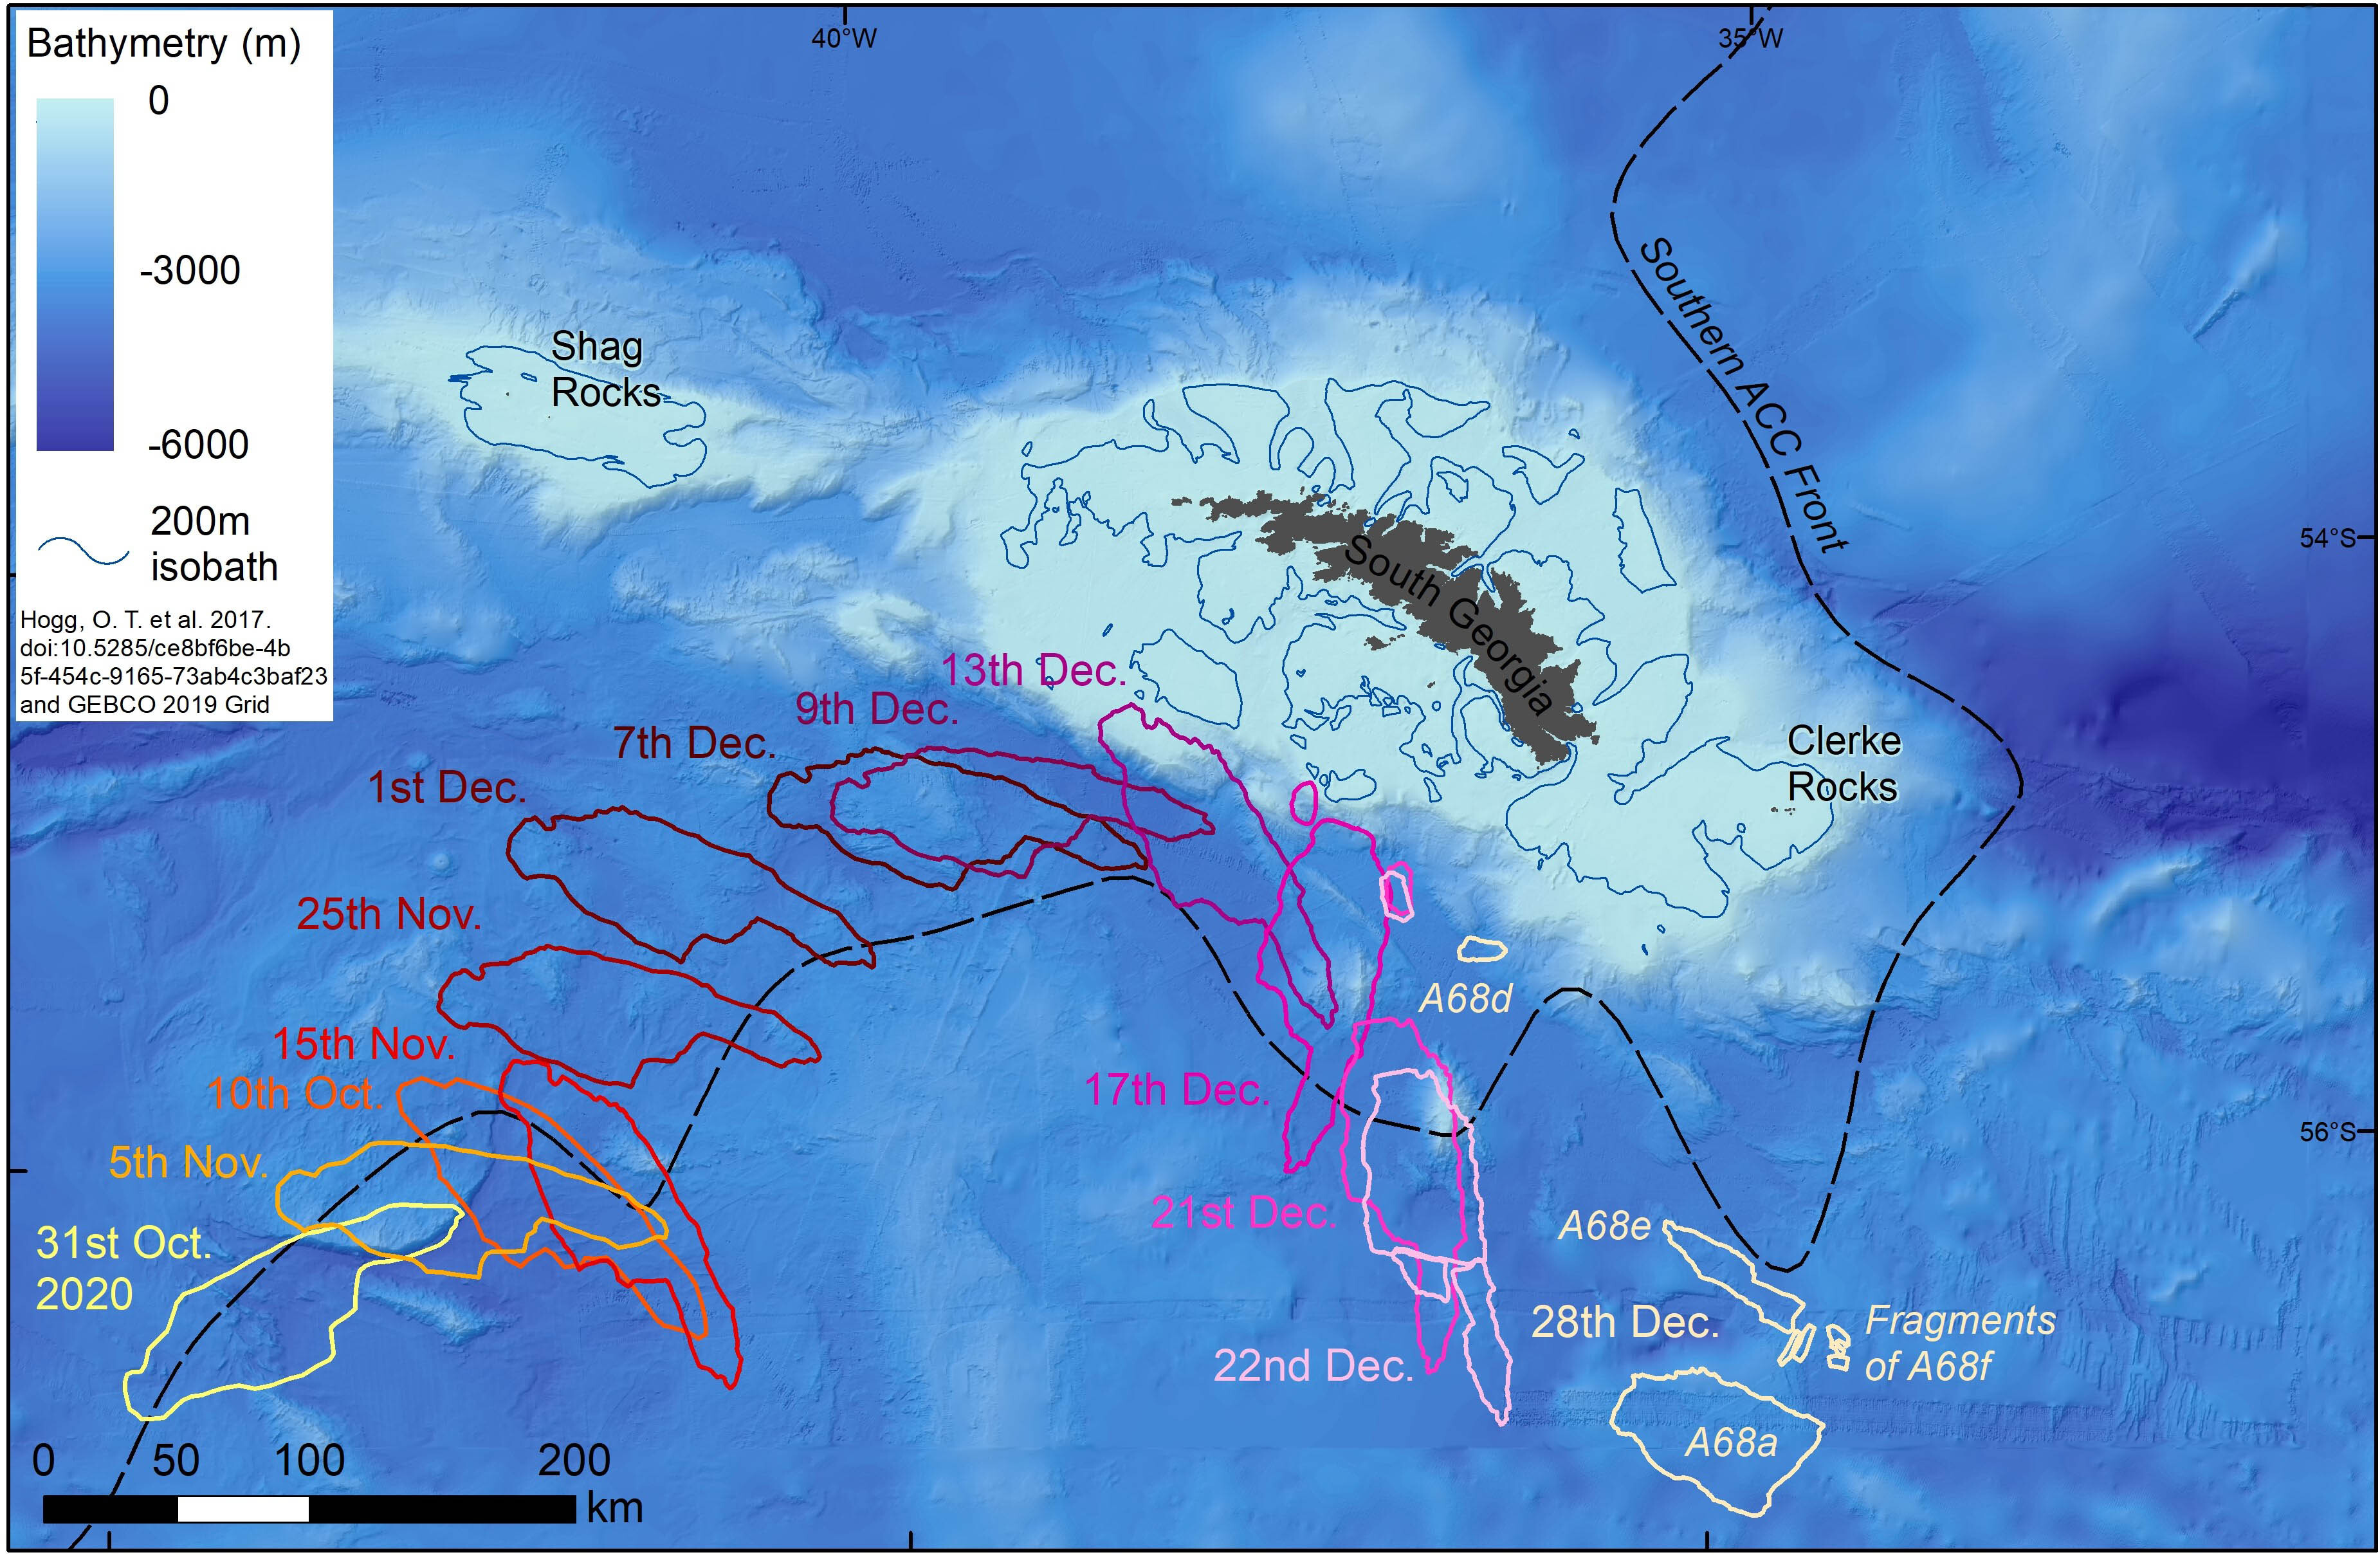
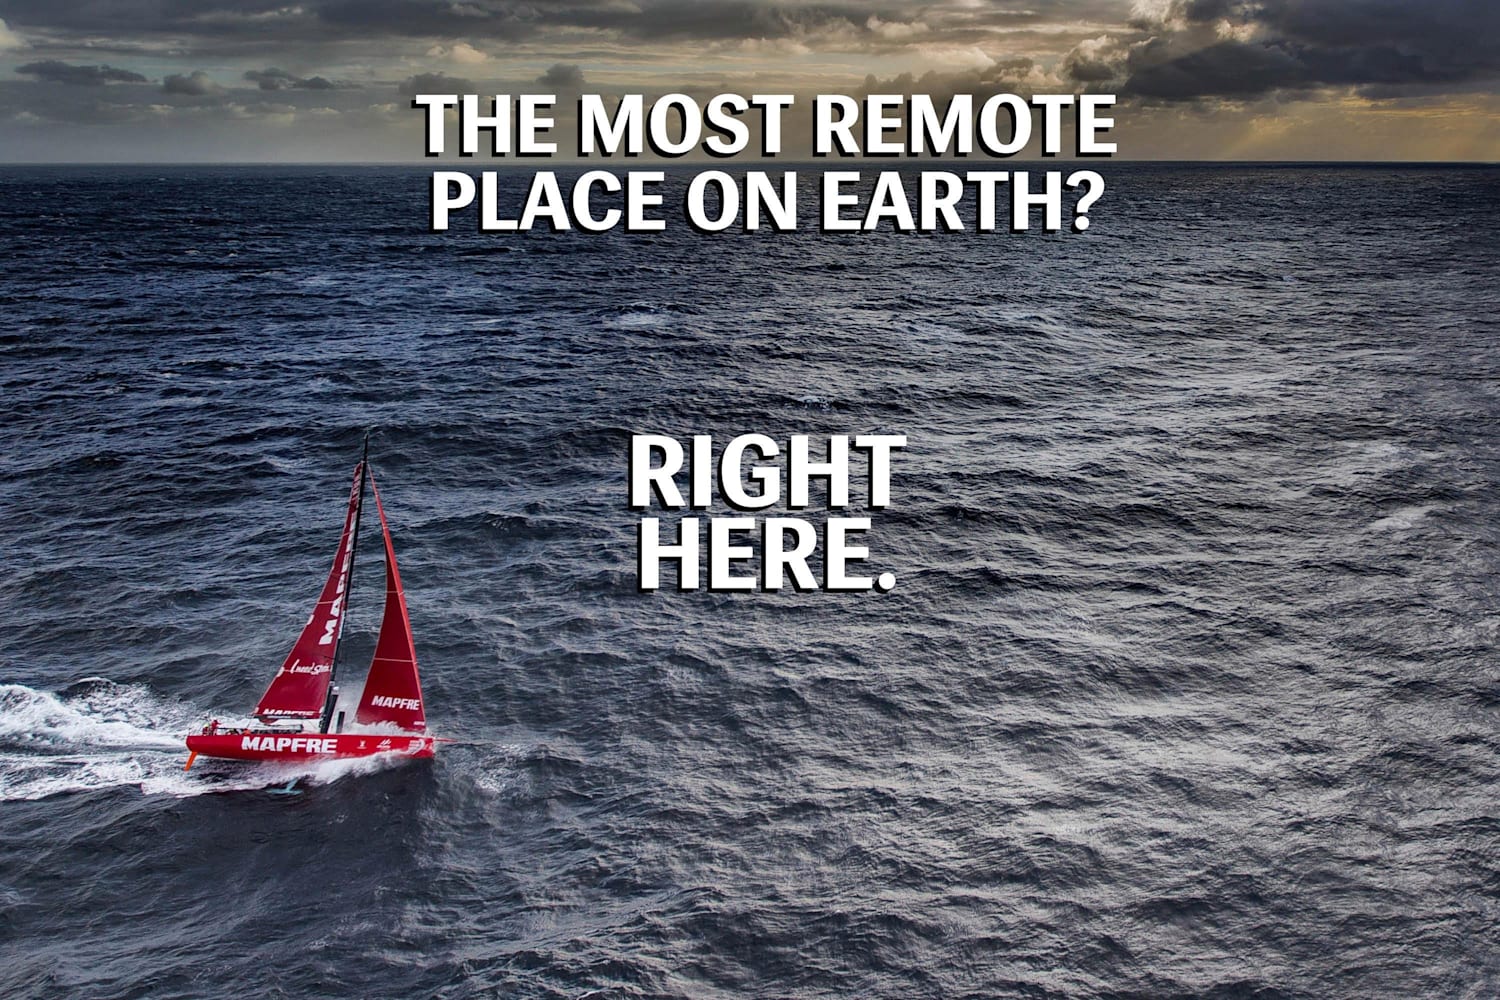
- GeoGarage blog : Nautical charts : zones of confidence / Chemical tanker grounding and ENC data ... / Lessons learned after passenger ship hits ... / Investigation finds unintended risks with ... / After crash in Volvo Ocean Race, a team ... / Independent report into the stranding of Vestas Wind / Questions asked about Volvo Ocean Race boat grounding / Questions about electronic charts in a twenty-first century ship grounding
/cloudfront-eu-central-1.images.arcpublishing.com/prisa/WSDPAK4ZIJW4QJVQLYKIFZ7ISM.jpg)


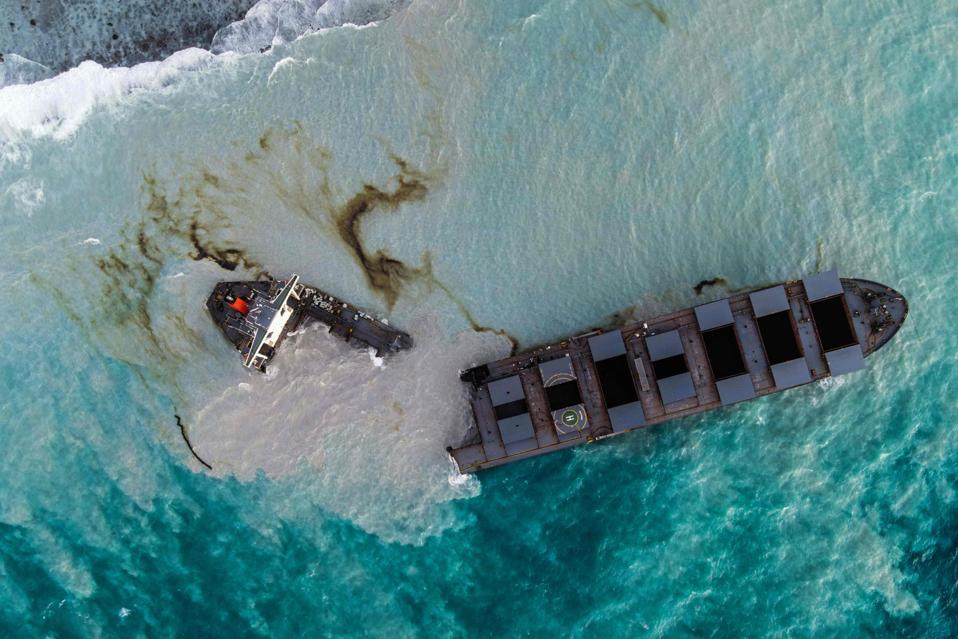
 Mauritians have been marching on the streets in protest against how the oil spill has been handled.
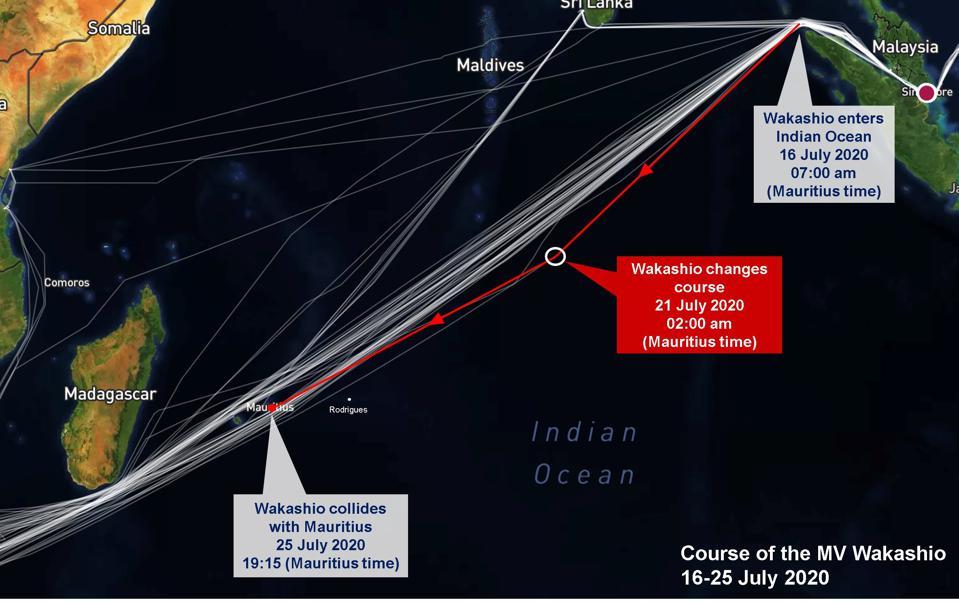
 MOL has not given a clear enough explanation for how the change to the voyage plan occurred and the reason for this


