Saturday, July 4, 2020

The International Date Line Map you’ve seen is wrong

The date line, it's somewhat of a border, but who is in charge of it? 
Johnny Harris explains the International Date Line
and discovers that Google Maps has incorrectly delineated the boundary. 

 GeoGarage Time Zone API : for maritime areas

From Sovereign limits by Tim Montenyohl

Not long ago, our Director of GIS was working on a project in the Pacific when he started complaining about the geometric lines commonly used to divide up island nations.
You’ve definitely seen them if you’ve ever looked at the Pacific, or called up an International Date Line map.

But where do those lines come from?
Kevin wanted to know—and so did I.

Suspecting the lines may be sourced from time zones, I peeked at a time zone map and realized something: pretty much every existing map of the International Date Line is wrong.

To be clear, the International Date Line is made up, with no true established standard.
It’s still however standardized enough that Natural Earth has a shapefile of it, which seems to match every other version one can find.
Existing maps of the International Date Line are accurate in terms of dividing land up into proper time zones, but it completely ignores maritime sovereignty.


From Wikipedia, so it must be true

Sovereignty is the driving force behind time zones, and therefore the International Date Line.
If American Samoa decides it wants to switch from observing UTC–11 to observing UTC+13, that would redefine the International Date Line (it would also basically abolish a whole day for them).
But American Samoa isn’t going to specify a different time zone for their maritime space.
(As a sovereign nation they could, but for what purpose?)
When a nation adheres to a specific time zone, it’s pretty safe to assume that it also applies to its maritime space.
So I came up with a thought experiment: What if we redefined the International Date Line using maritime sovereignty?

Rethinking the Map


This wasn’t as clear-cut as I thought it would be. There’s a little problem with Kiribati. As a nation, it’s clumped into three groups; Gilbert Islands, Phoenix Islands, and Line Islands.
The Line Islands are basically a time zone enclave, being well within the Western hemisphere, but observing a very Easternly UTC+14.
(Kiribati is actually the only country that observes the UTC+14 time zone.)
It makes sense, however, that the island nation as a whole would want to be on the same day.

The existing International Date Line has a somewhat awkward bridge between the Phoenix Islands and the Line Islands.
I redrew the Date Line using maritime boundaries and Exclusive Economic Zones (EEZs), and maintained that awkward bridge.


The Date Line’s awkward bridge, now with more detail!

I can’t call this experiment over after drawing this sovereignty-based map. See those gray hairlines in the above image?
Those are Extended Continental Shelf (ECS) submissions.
These are created unilaterally, so it’s questionable how much weight should be given to them.
The problem with my new International Date Line is that the Awkward Bridge goes right across the ECS claim of Cook Islands, which is on the other side of the International Date Line from Kiribati. Alternatively, I can make an International Date Line map that recognizes ECS submissions, but that means redirecting the bridge.


Including ECS submissions, Awkward Bridge is… still awkward

This map gives full weight to countries’ ECS submissions (remember, they’re questionable).
Regardless of validity, those submissions should probably be on the same side of the International Date Line as the submitting nation.
So Awkward Bridge now reaches over Jarvis Island as opposed to running below it. But does Awkward Bridge even need to exist?
If it didn’t, the Line Islands would truly be a Date Line enclave, which I’d like to point out, is also an awkward situation.


“Existing” International Date Line vs. my 2 new versions
Where Is the Line, really?

I realized a fair amount from going through this exercise.
While the Prime Meridian feels sacrosanct, the International Date Line isn’t a meridian; it’s pretty arbitrary.
Present convention is to ignore maritime sovereignty, for the sake of clean, angular lines on a map. That’s likely due to the fact that time zones, as a concept, pre-date the notion of maritime sovereignty as defined by UNCLOS.
As lines change, maps need updating. Looks like time zones and the International Date Line need new maps.

Friday, July 3, 2020

How this man survived shark-infested waters for 28 hours

Brett Archibald fell overboard in the middle of the night.
After he was rescued, he insisted on going back into the ocean.
Photograph courtesy of Brett Archibald

From National Geographic by Simon Worrall

Poisoned by a bad calzone, he tumbled into the sea where he had to fend off sharks, seagulls, and flesh-eating fish.

Brett Archibald experienced every ship passenger’s worst nightmare: On a surfing trip to Indonesia, he fell overboard.
It was night, and no one saw him go in the water.
He thought he was going to die.
Instead, he managed to stay afloat for more than 28 hours, longer than medical experts suggest is possible.

 Courtesy of St Martin Press

In Alone: Lost Overboard in the Indian Ocean, Archibald tells the story of that fateful night, including his encounters with seagulls, sharks, and jellyfish.
When National Geographic caught up with him in New York, the South African businessman explained how he survived.

Take us back to that moment in 2013 when you realized you had fallen overboard during a night crossing in Indonesia.
What were your first reactions?

A group of us who’ve known each other since we were 5 or 6 years old started doing this trip when we were in our 40s.
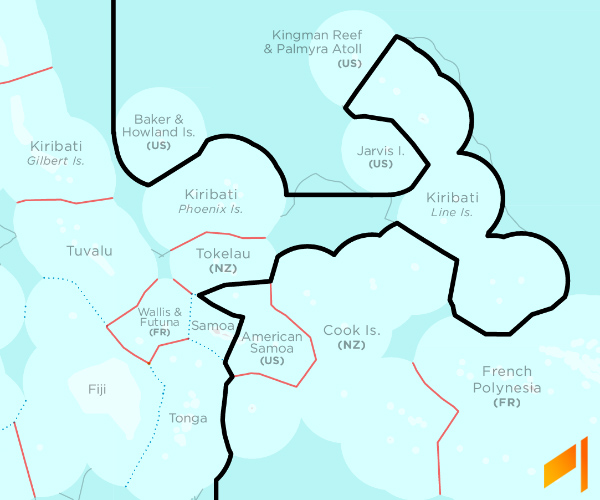
Mentawai Island is off the west coast of Sumatra.
You fly to a tiny little town called Padang, then jump on a boat.

On the way, we bought three extra-large calzone pizzas.
As we cut one open, it stank! But one of the group, a Frenchman from Mauritius whose nickname is “Banger,” promptly wolfed half his portion down.
I took a few bites, but it tasted disgusting.
I said, “That thing is poison. It’s water buffalo and it’s rancid.”

Fast forward: We’ve chugged down the river and headed out to sea.
I went to my cabin, crashed, and woke up at 1:30 in the morning needing the bathroom.
I jumped into the head and started vomiting.
I was sweating and thought, “I have to get to some fresh air.”

I walked up to the back of the boat and there was Banger, lying on the lower level of the boat, sea water and diesel fumes washing all around him.
I said, “Listen, buddy, we’ve got to get to the top.” So I helped him up to the top deck.
Then I went to the railing and vomited three times.
The third time I remember thinking, “If I vomit again, I’m going to black out.”

The next thing I knew, I was in the water, tumbling around.
I’d fallen six meters off the boat, hit the water, and been sucked under the boat.
I felt like I was in a washing machine.
When my head popped above the surface, I saw all this white water around me.
It was from the boat sailing off.
I was in the middle of the ocean, and I had no shadow of a doubt that this was going to be my watery grave.

One scene in the book is reminiscent of Hitchcock’s “The Birds.”
Talk about that moment—and the threats you faced from creatures in the sea.

Funnily enough, I’m an avid Alfred Hitchcock fan, and The Birds is one of my favorites.
[Laughs] Sea gulls are scavengers.
I must have dropped off to sleep in the water, and suddenly I got smashed on the back of the head.
Next, my left eye and nose exploded in blood and feathers.
It was a second seagull.
These two seagulls circled round me, dive-bombing and squawking at me.
It was horrific!

I actually thought I could catch one and drink its blood.
Finally, they flew off.
But they gave me hope because I remembered that they roost on land, so that meant the direction I was going was towards land.

I also got bumped by a shark.
I was preparing to welcome my end and went under the water.
I saw him coming to have a quick peek at me but he found me completely uninteresting and swam away.
Later, I got stung by a Portuguese man-of-war.

But the worst was these tiny little silver fish that nibbled my skin.
The backs of my legs were raw from kicking against my trouser shorts and the fish got to the raw flesh and started eating.
I couldn’t get them away no matter how I kicked and screamed and how I splashed the water.
It was the most horrendous thing I’ve ever felt in my life.
Ever!

You describe yourself as a “can-do kind of guy” who travelled with a toolbox.
Tell us about some of the ingenious methods you used to try and survive.
And introduce us to Bob and Emily.

Initially, I was so despondent I thought this is where I am going to die, so I wanted to write a message to my wife.
I took my belt off and started scratching a message into my skin, then I thought that’s ridiculous: a shark will eat you and no one will read your message.

In my pocket, I found a piece of paper.
I dropped it onto the water, thinking it’s pointless.
But as I watched it travel on the current, I realized this was going to be my savior because all currents lead to land.
I kept following the current, swimming breast-stroke, trying to keep my head above water.
I created a play list in my head of happy songs.
I started talking to people.

I was running out of energy very quickly.
I had nothing left so my brain said: Form a company.
I made my mouth Bob.
My left nostril was Hillary, my sales director.
My right nostril was Emily.
She was marketing.
I started having these board meetings with them.

How do we get Bob to safety?

I was going a bit mad at this stage but it worked.
Bob had this deep, gruff voice, “Keep your head up, keep kicking, keep your arms pulling, arms and legs are strong, production’s in good shape, boss, keep it up!” I asked Hillary in sales how do we keep the enterprise going? She said, “Just count, boss, count!” I was counting 1001, 1002.
Emily, in marketing, was responsible for keeping the company buoyant.
“How do we do that, Emily?” She said, “We sing, boss.” So we started singing: Kumbaya, all the Beatles and Bee Gee songs.
It kept my mind occupied, away from the pain.

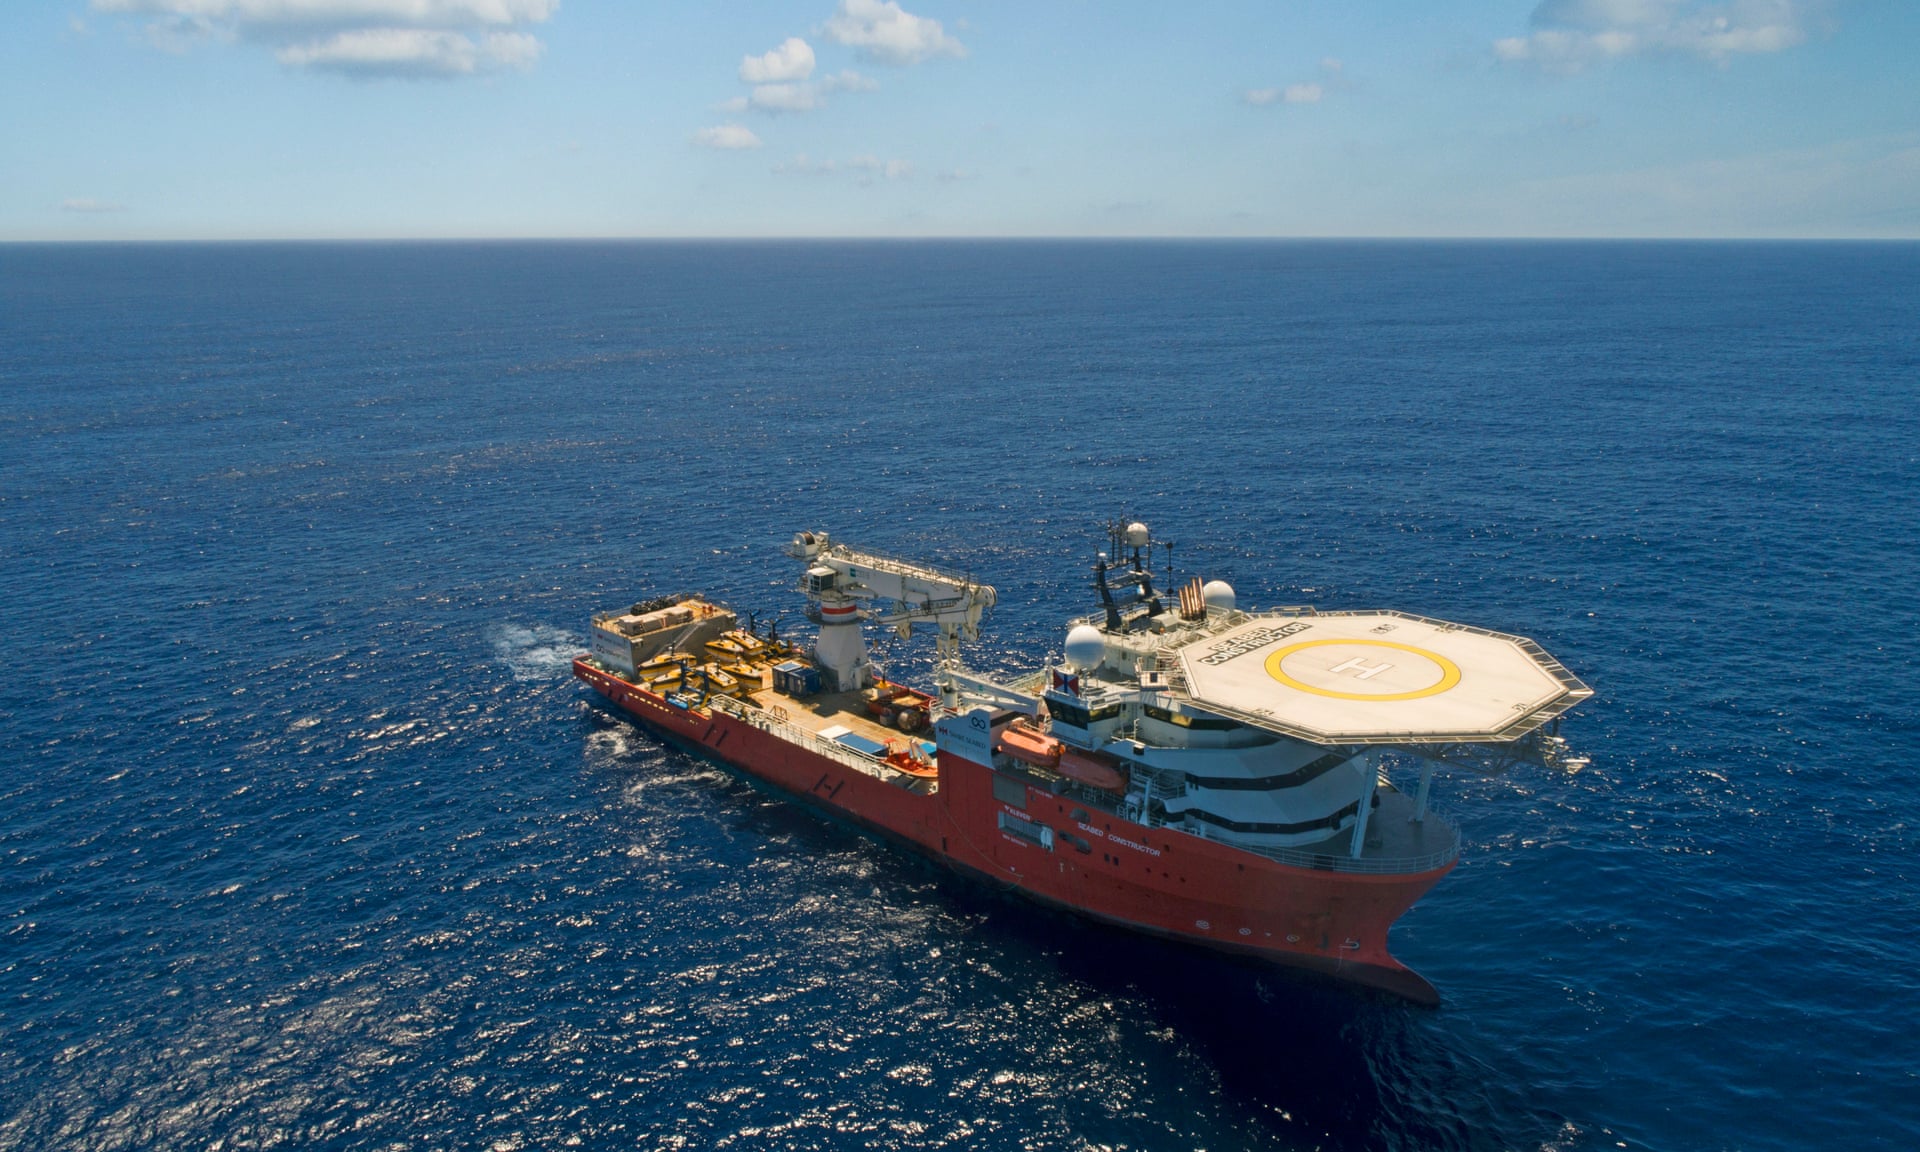
When Archibald saw the mast of the ship that rescued him, he thought it was another hallucination.

Back in South Africa, your wife, Anita, and your family faced the worry and panic of your disappearance.
Describe their emotions—and what you were thinking about them.

All my conversations with Anita were apologetic, all of her conversations with me were screaming at me saying, “Swim, you bugger, swim! You’re not leaving me here with two young children.” We have an incredible telepathy.
I heard her shouting to me.
I swam for her, for my kids.

At one point, I was so dejected I put my face in the water and tried to drown myself.
I couldn’t, so I lay on my back and filled my lungs with water three times.
I thought, why haven’t I slipped into unconsciousness? Then I thought, I’m not going to do this.
I fought for my family, clawed my way to the top; it was daytime, the water was warm and calm, and I knew there were going to be boats.

As you weakened, you began to have hallucinations.
Tell us about the Virgin Mary and some of your other visions.

I saw the Virgin Mary in this cloud.
It was after 12 hours.
There was this downpour of rain.
I got lots of water in my mouth then the rain disappeared and there was the Virgin Mary.
She was so real.
I remember talking to her saying, “What is this? Are you a sign? Is this my demise? Do I say my goodbyes?”

Later, I saw a 1634 Dutch East India schooner.
I could hear the rigging creaking, guys on ladders down the side of the boat.
They even spoke to me.
They said, “Swim, young man!” and I said, “Thank you for the young; I’m not that young!” It was so vivid and real.
When I got back to South Africa, I went to a sports scientist and he said, “Your brain at this stage was creating anything in order to survive.”

You write that you had “lost your religion” but during your time in the water you had angry conversations with God.
What did you say?

I’ve never lost my religion.
I just stopped being a churchgoer.
My church is in the ocean.
When I’m there I have long conversations with my God, whom I believe is the maker of everything.
They’re always very happy conversations.

But while I was alone in the ocean I looked skyward and screamed, “I’ve only been married to my wife ten years!” She’s not my first wife, and I just hadn’t spent enough time with her.
I was berating God for that because I was convinced I was going to die.
My kids were nine and six, so I was also cursing God that I wasn’t going to see my son grow up or my daughter walk down the aisle.
It was all his fault.
I cannot even repeat the language I used.
I swore, I screamed, I ranted—but it kept me going!

Every time I had these conversations, it calmed me.
I started accepting that this was where it was going to end.
I was very peaceful about it.
The sea is my happy place.
If I am going to go, that’s the place I wouldn’t mind going in.

You were eventually pulled from the sea.
Describe your emotions at that moment.

I saw this little red cross.
I had another complete meltdown conversation with God.
I thought he was taunting me again so I told him to shove the cross where it fits best.

But slowly this cross got bigger and bigger until I realized it was the mast of a boat.
I lifted my head up and screamed!
Then I heard this roar come off the boat and realized they’d spotted me.
They changed course and sailed straight up to me.
The skipper was an Australian guy called Tony “Doris” Eltherington, who was one of the first white pioneers to set up surf charters in the Mentawai Islands.
Two guys threw me a buoy, I grabbed on, and they towed me to the boat.
When I got on board I said, “Aussie, Aussie, Aussie! I love you fellows! You’re my heroes!”

They looked after me for seven hours before I went back to my own boat.
I had a meal, got put to bed then woke up five hours later.
The boat was like a morgue because everybody was so exhausted.

I went and sat on the little bench where I fell overboard, thinking: how did this happen?
Then I started sobbing.
The captain of our boat was awake and he came and put his arms around my shoulders, and started sobbing as well.
The two of us just sobbed and sobbed.
I reckon I cried for maybe five and a half hours.

As dawn was rising, I said to the skipper, “You have to put me back in the ocean.” He said, “There’s no way! I’m tying you to the boat if I have to!”
But I had to! If I hadn’t done that, I would never have gone back in the ocean.
So I went back in the sea and spent four hours sitting on my surfboard, climbing off, swimming in the ocean, and riding waves.

Then I went on to the beach.
I hid in the jungle and bashed my head on a palm tree until it started bleeding.
I was licking the blood because in my mind this wasn’t real.
I had made all this up; I was a ghost.
It was only the pain of smashing my head, the taste of the blood, and the smell of the bark, which made me realize I truly was alive.

How did this experience change your life? Are there lessons that you took away?

The experience changed my life 180 degrees!
I came back to South Africa and made a pact with myself that I’d never be in an industry that made me unhappy.
Before this happened, I was very materialistic.
I chased money, houses, fast cars, private jets.
That was my world.

I thought I was being such a cool dude but while I was in the ocean, I reflected on all of that and realized none of that meant anything!
I started asking, what is really important?
Number one was my family.
I realized I hadn’t been a great husband, or a great father.
My friends were critically important to me but I also hadn’t been a great friend.
I’d always had a strong faith but I had not had a formal connection to the church.

In the sea, I said, “If I get through this, I’m going to live life according to my three Fs: faith, family, and friends.”
I’m not perfect, but I’ve lived close to all three.
There’s always money in the bank, food on the table, a cold bottle of wine in the fridge, my friends are always around me, and I have such contentment from that.

But the year after I was back, I fought the biggest battle of my life.
I went into a deep depression.
I sought out every kind of religious man, from pastors, priests, to our local church guy.
Maybe God had given me a message that I should go and join the church.
But I knew I couldn’t do that.
So I was in this huge dilemma.

I was then catapulted onto the inspirational talking circuit.
I spoke to a group of Jewish businessmen.
Afterwards we were having tea and I was telling the rabbi about my dilemma and he said, “Son, you’re fighting all the wrong things! God rescued you so you could go on the stage and share this story.
I’m Jewish, I don’t believe in the Virgin Mary, yet it’s one of the most powerful survival stories I’ve ever heard.”

To date, I’ve given over 300 talks to more than 35,000 people, in nine countries, and that’s what I now believe.
That rabbi helped me come to that understanding.

Links :

Thursday, July 2, 2020

Earth's final frontier: the global race to map the entire ocean floor

Vicki Ferrini at the Lamont-Doherty Earth Observatory, where she works as a geoinformatics researcher.
Photograph: Vicki Ferrini

From The Guardian by Laura Trethewey

An ambitious project to chart the seabed by 2030 could help countries prepare for tsunamis, protect marine habitats and monitor deep-sea mining.
But the challenge is unprecedented

On a wall facing Vicki Ferrini’s desk hangs a giant map of the Atlantic and Indian Oceans.
At 6ft by 8ft, it’s the largest size available on the printer at the Lamont-Doherty Earth Observatory, where she works as a geoinformatics researcher.
“I of course want it even bigger,” she says.

The map is busier than a usual world map.
Rather than showing featureless, flat blue ocean, here the seafloor bursts with detail: mountains, canyons, channels and plains that resemble the texture of land.
Ferrini encourages her staff to print pictures of the seafloor features they’re researching and tack them to the map.
One example off the coast of Argentina shows ripples in the seafloor reaching a hundred metres high.
The map has a distinctly Sherlock Holmes-about-to-break-a-big-case look to it.
“I’m trying to see the scale of the ocean,” she explains.
“The big picture – but also the fine details.”

Mapping requires an ability to see the forest as well as the trees – or in this case, the coral as well as the sea.
It’s a particular challenge when it comes to the ocean, the vast majority of which is not just unmapped, but unknown.
Ferrini’s map is humanity’s best effort to date: a crucial document in what has become a race to map the entire seafloor by the end of the decade.

The race officially kicked off in 2017 at the United Nations Ocean Conference in New York City.
When it began, around 6% of the ocean was mapped in accurate detail.
On 21 June, the global initiative – known formally as the Nippon Foundation-Gebco Seabed 2030 Project – released its latest edition: it has now mapped one-fifth of the seafloor.

The stakes are high.
A series of reports have warned of the ocean’s impending collapse.
The First World Ocean Assessment, published by the UN Environment Programme in 2015, revealed that the ocean’s very ability to function was in jeopardy.
The following year, an OECD report estimated that the ocean economy employed 31 million people full-time and generated $1.5 trillion each year.
Maps – or the lack thereof – play a role in nearly every critical ocean issue, from sea level rise to ocean acidification to biodiversity.

The pilot Amelia Earhart and her navigator, Fred Noonan, with a map of the Pacific that shows the route of their last flight in 1937.
The quest to find her plane has led to attempts to map the seabed.
Photograph: Bettmann/Bettmann Archive

During the 20th century there were brief bursts of enthusiasm for mapping the sea, including the search for Amelia Earhart’s lost plane, a Lockheed Electra, and the hunt for the wreck of the Titanic.
In 2014, the disappearance of Malaysia Airlines MH370 seemed to baffle us: how was it possible that with all our modern technology, something as huge as an entire plane could simply disappear?

It’s often said that humanity knows more about the surface of the moon than we do the seafloor.
It seems astounding that faraway planets can be more accessible than our own.
But we tend to skip over why it is so difficult to map the seafloor: there is a massive obstacle in the way called the ocean.
Light travels far and fast in space, but the laser altimeters that we use to chart celestial bodies are ineffective in water – the lasers are simply absorbed.

Sound, on the other hand, travels more efficiently underwater than it does in air.
The gold standard for seafloor mapping today is a multi-beam echosounder, which can be attached directly on to the hull of a ship.
The device sends down a fan of sound waves, which computers decipher into a three-dimensional portrait of the seafloor’s shape and composition.
Additional techniques also collect water temperature and salinity along the way.

It is slow work.
Ferrini recently sent another version of the map, this one blacking out all the uncharted ocean today.
The coastlines were lit up with data.
So, too, were well-traversed shipping lanes.
The rest sat in darkness, except for a few pinpricks of light.

New images of the side of the RMS Titanic in her resting place at the bottom of the North Atlantic Ocean, taken during a survey of the wreckage from a manned submersible on an expedition in August 2019.
Photograph: Atlantic Productions

Few countries need accurate maps of the seabed more than Japan, an island nation whose future is uniquely intertwined with the ocean’s, and it is the Nippon Foundation , a Japanese non-profit organisation run on the gambling proceeds of motorboat racing, that is backing Seabed 2030 with $2m every year.
In the past, the foundation has addressed thorny global challenges such as eliminating leprosy or fighting food insecurity, and a complete seafloor map fits within its mandate, as well as Japan’s wider national interests.
Seabed 2030 would improve Japan’s fisheries management and its tsunami and typhoon preparation, as well as clarify territorial claims in the South China Sea.

But the mapping is a truly global collaboration, public and free to use, divided among four regional centres.
The Alfred Wegener Institute in Germany took the Southern Ocean; Stockholm University and the University of New Hampshire cover the North Pacific and Arctic; New Zealand’s National Institute of Water and Atmospheric Research are responsible for the South and West Pacific Ocean.
That leaves the largest swath, the entire Atlantic and Indian Oceans, to the Lamont-Doherty Earth Observatory at Columbia University – Ferrini’s team.

The finished map itself is created by a fifth centre, based in the UK: the British Oceanographic Data Centre in Southampton.
It collects the analysed data from the four centres and compiles it in the General Bathymetric Chart of the Oceans (Gebco).
The data is in the public domain, free to use, adapt and commercially exploit.

“Pretty much anybody doing some kind of [ocean] research should probably be using or has used the Gebco data,” says Rochelle Wigley, the project’s director at the University of New Hampshire.
“A lot of fibre optic cable companies have used it, people interested in tsunamis and storm surge, people looking to characterise habitat or modelling ocean currents.”

It is making remarkable new discoveries all the time.
Off Florida, a reef of mid-ocean corals turned up; in the Gulf of Mexico, a shipwreck.
A forthcoming study on ice sheets will use Gebco to unpack how the ocean influences melting and raises sea levels.

The ‘Seabed Constructor’ in the southern Indian Ocean off the coast of South Africa, on 4 January 2018.
The ship and its unmanned submarines has been scouring the ocean floor for wreckage from flight MH370.
Photograph: Ocean Infinity Handout/EPA

Deep-sea mining – a controversial plan to excavate huge areas of underwater resources, in what would be the largest mining operation the Earth has ever seen – requires maps, too.
The UN’s International Seabed Authority (ISA) has given permission to several state-owned and private companies to prospect in the deep sea; permission to start mining could come as soon as this year.
In many cases, however, the deep-sea miners are way ahead of the Gebco mappers.
Luc Cuyvers, lead author of the IUCN’s 2018 report on seabed mining, says mining companies are looking for specific things – hard evidence of minerals, either visual or actual samples.
“From an industry perspective, they need more advanced data” than Gebco, he says.
“And [they] have, in many instances, already collected it.”

Where Gebco could be used in deep-sea mining, however, would be to help the ISA to better regulate the industry, he says – something of a double-edged sword, depending on your point of view.

Another potential controversy is whether mapping introduces more noise to an already noisy ocean.
Air guns, naval sonar and shipping traffic are increasingly edging out marine mammals that rely on sound to hunt, navigate and communicate.
New research from graduate student Hilary Kates Varghese at the University of New Hampshire revealed that the multi-beam echosounders used by Seabed 2030 did not disrupt the feeding behaviour of Cuvier’s beaked whale, one of the more sonically sensitive marine mammals.
However, research biologist Annamaria DeAngelis at the National Oceanic and Atmospheric Administration pointed out that because Seabed 2030 is mapping the entire ocean, “more studies will be needed to expand our knowledge of how their particular echosounders will affect marine mammals in a variety of habitats.”

An undated supplied image from Geoscience Australia shows a computer generated three-dimensional view of the sea floor.
Photograph: Reuters

One way to reduce noise is to crowdsource from ships that are already charting the ocean.
When the multimillionaire Victor Vescovo went on a mission to reach the deepest point of all five oceans, Seabed 2030 mappers collected soundings along the journey.
Other industry partners are donating whatever data they can.
Crowdsourcing is crucial – from cruise ships, hydrographic offices, even weekend boaters with a decent sounder.
By itself, a single ship would need 200 years to map the rest of the uncharted seas.

However, “sharing data is a little taboo”, says Tinah Voahangy Martin, a member of Ferrini’s staff who often approaches institutions located on the Indian Ocean to ask for seafloor information.
Seafloor data is often considered proprietary, classified or simply too valuable to give away.
“You don’t want to be the person who comes in and says ‘Hi, you do this and we expect this.’ You take them on as a partner.
That’s the best way to get them involved.”

Ferrini adds that, because science in the US is often taxpayer-funded, it creates the expectation that data will always be freely available.
“We have to remind ourselves that the whole world doesn’t work that way, and figure out how we can make it mutually beneficial.”

Nevertheless, at their rate of progress, the finish line of 2030 seems possible.
But completing the map on Ferrini’s wall is just the beginning.
“There’s still so much more for us to do and know than the shape of the seafloor,” she says.
“This is just one piece of a much bigger picture.”

Links :

Wednesday, July 1, 2020

Worldwide PRIMAR ENC catalogue

Today, the Primar ENC catalogue now exceeds 17,000 ENCs
(17,019 worldwide references of official @IHOhydro nautical vector charts).
see coverage on Google Earth on the GeoGarage platform

France expands its submarine domain by a quarter of a hexagon

With the assistance of SHOM surveys, Ifremer has piloted Extraplac project

From V&V by Olivier Chapuis (translated from French) 

At the United Nations, the Commission on the Limits of the Continental Shelf authorized France to extend its submarine domain off Reunion Island and Saint-Paul and Amsterdam, Taaf Islands, by 151,323 square kilometers.
This extension represents a little more than a quarter of the surface area of mainland France.
With the second largest maritime area in the world, France is more than ever at the heart of the major challenges of ocean exploration, exploitation and protection.

A little less than two years ago - on the occasion of the launch of the Maritime Boundaries portal that the Navy's Hydrographic and Oceanographic Service (Shom) maintains online on behalf of the State - we wrote that maritime France had lost some weight but that it had beautiful remains.

This thinning - below the eleven million square kilometres that used to be rounded off - was in fact the result of a new cartographic projection that distorted surfaces at high latitudes less and a more powerful geodesy algorithm.


Since 2018, France's maritime areas have shown a slight upward trend.
Including the extensions of the continental shelf in force on 12 June 2020, they totalled 10,760,500 square kilometres.

Their planetary distribution can be consulted on Maritime Limits thanks to Shom's expertise.
Without these extensions, their surface area was 10 186 526 square kilometres on the same date.
More than ever, this is the second largest maritime domain in the world after that of the United States, which would be 11.3 million square kilometres (but the United States has not communicated official figures on this subject and has not signed the United Nations Convention on the Law of the Sea).
It is southwest of Reunion Island, at the limit of Madagascar's EEZ, that the UN grants France an extension of its continental shelf beyond the 200-mile limit.

It is southwest of Reunion Island, at the limit of Madagascar's EEZ, that the UN grants France an extension of its continental shelf beyond the 200-mile limit. | EXTRAPLAC

On 10 June 2020, at the United Nations (UN), the Commission on the Limits of the Continental Shelf (CLPC) made public recommendations (read in full here) authorising France to extend its continental shelf in the Indian Ocean, off Reunion Island (58,121 additional square kilometres) and Saint-Paul and Amsterdam, islands of the French Southern and Antarctic Territories (93,202 additional square kilometres).

These 151,323 square kilometres - equivalent to just over a quarter of the surface area of the metropolis - will thus bring the extensions of the continental shelf to 725,297 square kilometres, instead of the current 573,974 square kilometres.
This represents a 26.36% increase in continental shelf extensions and a 1.4% increase in France's total maritime area.

Eleven zones are concerned by the Extraplac programme, with accepted applications (for which French decrees have been published or are forthcoming), under consideration or not yet examined by the CLPC.

In the light of the dossiers currently under consideration or awaiting consideration at the United Nations, France could still claim approximately 500,000 square kilometres of continental shelf.
These extensions are being carried out under the Extraplac programme (Reasoned Extension of the Continental Shelf), led by the General Secretariat for the Sea, attached to the Prime Minister, with the scientific and technical expertise of the French Research Institute for the Exploitation of the Sea (Ifremer) and Shom, mainly.

Since 25 September 2015, France has extended its continental shelf around Kerguelen (in yellow). This extension does not extend to Heard Island, belonging to Australia, which limits the EEZ of the Kerguelen Islands, whose surface area is 575,000 square kilometres.

National seabed, international water column

According to Article 76 of the United Nations Convention on the Law of the Sea - known as the Montego Bay Convention of 10 December 1982, which entered into force in 1994 and was ratified by France on 11 April 1996 - a coastal state may extend the continental shelf under its jurisdiction beyond 200 miles.
However, this extension, up to a maximum of 350 miles, concerns only the seabed of the continental shelf (marine soil and subsoil continuing the land on the seabed).

 International EEZ in the GeoGarage platform

The water column there remains international, unlike in the Exclusive Economic Zone (EEZ), where the state exercises jurisdiction (environmental protection in particular) and has sovereign rights, both over the waters (exploitation of resources, e.g. fishing) and over the seabed and subsoil, where it can exploit hydrocarbons, minerals, metals and other living resources.

The extension of the continental shelf of the islands of Saint-Paul and Amsterdam is located to the north-east of these islands in the French Southern and Antarctic Lands in the Indian Ocean.

The United Nations Convention on the Law of the Sea does, however, provide for the sharing of wealth on extensions of the continental shelf with signatory countries, particularly those that are developing or do not have access to the sea.
For the time being, France indicates through the General Secretariat for the Sea that the exploitation of the wealth from these extensions is "not on the agenda".

 photo : Marine Nationale

On the contrary, it welcomes a decision that will enable it to ensure the protection of these underwater areas, which are rich in potential resources and a still poorly known biodiversity, but also to "preserve its rights for the future".
A future that is all the more promising given that ocean exploration is still in its infancy and that only 18% of the world's seabed is hydrographically surveyed to date.
This means that the scarcity of continental resources will force humanity to look into the abyss.

Links :

Tuesday, June 30, 2020

Eyes and ears at sea: US Coast Guard to test Saildrone Autonomous MDA capabilities


From SailDrone

Saildrone is using a specially built camera system and advanced acoustic technology combined with machine learning to identify activity at sea.

At sea, a human of average height can see about five kilometers (three miles) on a clear day.
The distance across the Pacific Ocean from San Francisco to Tokyo is about 8,260 kilometers (5,133 miles)—a seemingly impossible distance for any law enforcement organization to monitor.
Maritime domain awareness (MDA) is the effective understanding of anything associated with the safety and security of the global maritime domain, including illegal fishing, drug enforcement, and limiting intrusion into protected marine sanctuaries.

Congress has tasked the United States Coast Guard (USCG) with examining the feasibility, costs, and benefits of improving maritime domain awareness in the remote Pacific Ocean using a low-cost unmanned surface system.
Saildrone unmanned surface vehicles (USVs) have conducted extensive data collection missions around the world, from fisheries missions in the Arctic to bathymetry missions in the Gulf of Mexico, demonstrating their significant potential as a tool for MDA in any area of the ocean.
Being completely silent and capable of missions up to 12 months in duration, Sailrone USVs effectively provide eyes and ears at sea, supporting a variety of ISR (intelligence, surveillance, reconnaissance) objectives.

Saildrone has been awarded a $1.1 million contract by the USCG Research and Development Center (RDC) to conduct a 30-day demonstration of ISR/MDA capabilities in the Central Pacific Ocean.
The goal of the demonstration is to assess low-cost, commercially available autonomous solutions to improve maritime domain awareness in remote regions.
The demonstration will investigate detection ranges, appropriate sensor packages to provide desired outcomes, and the flow of communication between the vehicles and command centers.

Saildrone’s MDA solutions consist of three parts.
First, the vehicles themselves, designed for long-duration missions at sea.
Second, an array of detection sensors including optical cameras, automated identification system (AIS) receivers, and optional radar or infrared cameras for night-time capabilities.
Third, the crucial AI/ML software, which fuses the data from all sensors, recognizes targets of interest, and alerts the end-user appropriately.

Examples of what Saildrone USVs have seen at sea—cargo and cruise ships, fishing vessels, birds, icebergs, and whales.

Saildrone has built an unprecedented proprietary data set of some four million images, representing years of data collection by saildrones at sea.
Just as the ImageNet data set was instrumental in the development of ML algorithms for visual object detection on land, this data set is unlocking new capabilities at sea, a challenging environment where all pixels are moving across each frame.

“Machine learning is teaching computers to memorize patterns. In order to memorize a pattern, you need a lot of examples of that pattern. The data set that we have built is one of the crucial ingredients, allowing us to do what we’re doing,” explained Cory Schillaci, senior machine learning engineer at Saildrone.

Computer vision is based on deep neural networks, also known as artificial neural networks.
The patterns within the collected data set are represented by numbers, which in turn are mathematically mapped to define a model that a computer can be trained to recognize.
Saildrone achieved this over several years, leveraging the industrial-strength large-scale cloud-based compute infrastructure provided by Amazon Web Services (AWS).

“We are excited to see public sector customers continue to utilize the AWS Cloud to drive innovation and spur solutions that allow for missions to be performed better, faster, and in a more secure manner,” said Brett McMillen, general manager of the US Federal Civilian & Ground Station for AWS.
“Using AWS, Saildrone developed autonomous maritime domain awareness solutions that leverage machine learning and help support the US Coast Guard’s efforts to monitor activity from the surface layer to the deep ocean.”

Saildrone's small and medium unmanned surface vehicle MDA solutions.

When it comes to machine learning, people often think that the exciting part is in training the model, but in reality, the work is in the data collection and annotations, and efficiently deploying the model on an embedded system—in this case, an autonomous vehicle with a limited supply of solar power.

Typically, neural networks are run using specialized hardware called a graphics processing unit (GPU), which consume hundreds of watts of power.
Saildrone’s USVs are powered exclusively by solar energy, which is shared between data collection, storage, navigation, and communication operations.
“A significant part of the work that we’ve done is in making our models run in a low-power environment,” said Schillaci.

The “eyes” of the Saildrone MDA solution are in a specially built 360° camera system, integrated with a GPU.
The cameras capture images on a very high frequency and the ML model scans the images looking for one of the patterns it’s been trained to find, such as an illegal fishing vessel off the coast of Hawaii.
When a vessel has been identified, the vehicle sends an alert to users in real time.
Advanced acoustic technology provides the “ears” for sub-surface maritime domain awareness.

The Saildrone MDA solution integrates machine learning with automatic identification system (AIS) information to not only identify the presence of a vessel but identify that vessel using its Maritime Mobile Service Identity (MMSI) number including registration and country of origin.

This proof-of-concept mission on behalf of the USCG will take place in a 52-square-kilometer (20 sq.
mi.) area of the Central Pacific about 30 nautical miles south of Oahu, Hawaii.
Three Saildrone SUSVs will operate in a “picket line” formation, essentially creating an invisible fence to detect any passing vessels.
The primary objectives of the mission are to demonstrate the operational capability of the Saildrone solution and investigate how a small USV system can be effectively used to improve maritime domain awareness in remote areas of the Pacific Ocean.

Saildrone also offers an enhanced surface MDA solution, using its 22-meter (72-foot) medium unmanned surface vehicle (MUSV).
This larger platform offers higher patrol speed and wider detection range, due to significantly higher placement of the sensor array at a height of 15 meters (50 feet).
In addition to the optical cameras and AIS receivers, the MUSV also carries radar and infra-red (IR) cameras, offering night-time detection capabilities.
It comes packaged with the same high-performance AI/ML onboard detection algorithms and alerting system.

When combined with its advanced acoustics sensing suite, the Saildrone MUSV solution offers persistent eyes and ears above and below the sea surface anywhere in the world, redefining ISR/MDA to combat illegal fishing, secure borders, and protect infrastructure.

Links :

Monday, June 29, 2020

Siberia heatwave: why the Arctic is warming so much faster than the rest of the world

Siberia heatwave: why the Arctic is warming so much faster than the rest of the world

From The Conversation by Jonathan Bamber, Professor of Physical Geography, University of Bristol

Temperature anomalies from March 19 to June 20 2020.
Red colors depict areas that were hotter than average for the same period from 2003-2018; blues were colder than average.

On the eve of the summer solstice, something very worrying happened in the Arctic Circle.
For the first time in recorded history, temperatures reached 38°C(101°F) in a remote Siberian town – 18°C warmer than the maximum daily average for June in this part of the world, and the all-time temperature record for the region.

New records are being set every year, and not just for maximum temperatures, but for melting ice and wildfires too.
That’s because air temperatures across the Arctic have been increasing at a rate that is about twice the global average.

All that heat has consequences.
Siberia’s recent heatwave, and high summer temperatures in previous years, have been accelerating the melting of Arctic permafrost.
This is the permanently frozen ground which has a thin surface layer that melts and refreezes each year.
As temperatures rise, the surface layer gets deeper and structures embedded in it start to fail as the ground beneath them expands and contracts.
This is what is partly to blame for the catastrophic oil spillthat occurred in Siberia in June 2020, when a fuel reservoir collapsed and released more than 21,000 tonnes of fuel – the largest ever spill in the Arctic.

So what is wrong with the Arctic, and why does climate change here seem so much more severe compared to the rest of the world?
Smoke from wildfires cloaks the skies over Siberia, June 23 2020.

The warming models predicted

Scientists have developed models of the global climate system, called general circulation models, or GCMs for short, that reproduce the major patterns seen in weather observations.
This helps us track and predict the behaviour of climate phenomena such as the Indian monsoon, El Niño, Southern Oscillations and ocean circulation such as the gulf stream.

GCMs have been used to project changes to the climate in a world with more atmospheric CO₂ since the 1990s.
A common feature of these models is an effect called polar amplification.
This is where warming is intensified in the polar regions and especially in the Arctic.
The amplification can be between two and two and a half, meaning that for every degree of global warming, the Arctic will see double or more.
This is a robust feature of our climate models, but why does it happen?
Fresh snow is the brightest natural surface on the planet.
It has an albedo of about 0.85, which means that 85% of solar radiation falling on it is reflected back out to space.
The ocean is the opposite – it’s the darkest natural surface on the planet and reflects just 10% of radiation (it has an albedo of 0.1).
In winter, the Arctic Ocean, which covers the North Pole, is covered in sea ice and that sea ice has an insulating layer of snow on it.
It’s like a huge, bright thermal blanket protecting the dark ocean underneath.
As temperatures rise in spring, sea ice melts, exposing the dark ocean underneath, which absorbs even more solar radiation, increasing warming of the region, which melts even more ice.
This is a positive feedback loop which is often referred to as the ice-albedo feedback mechanism.

Melting Arctic sea ice is increasing warming in the region.
Jonathan Bamber, Author provided

This ice-albedo (really snow-albedo) feedback is particular potent in the Arctic because the Arctic Ocean is almost landlocked by Eurasia and North America, and it’s less easy (compared to the Antarctic) for ocean currents to move the sea ice around and out of the region.
As a result, sea ice that stays in the Arctic for longer than a year has been declining at a rate of about 13% per decade since satellite records began in the late 1970s.

In fact, there is evidence to indicate that sea ice extent has not been this low for at least the last 1,500 years.
Extreme melt events over the Greenland Ice Sheet, that used to occur once in every 150 years, have been seen in 2012 and now 2019.
Ice core data shows that the enhanced surface melting on the ice sheet over the past decade is unprecedented over the past three and a half centuries and potentially over the past 7,000 years.

In other words, the record-breaking temperatures seen this summer in the Arctic are not a “one-off”.
They are part of a long-term trend that was predicted by climate models decades ago.
Today, we’re seeing the results, with permafrost thaw and sea ice and ice sheet melting.
The Arctic has sometimes been described as the canary in the coal mine for climate breakdown.
Well it’s singing pretty loudly right now and it will get louder and louder in years to come.

Links :

Sunday, June 28, 2020

Bromdog's risky business


Matt Bromley and friends chase the riskiest waves around the globe.
The film climaxes with the 2016 El Nino Hawaii season,
where they score the best ever season out at Jaws.