Saturday, May 11, 2019

Map to the stars


From GoogleMapMania

The Star Atlas is an interactive map showing you the position of the stars in the night sky.
The map shows over 60,000 stars up to a magnitude of 8.5.

If you share your location with the Star Atlas you can view the current position of the stars in the sky from where you are in the world.
It is easy to translate the map to what you can actually see in the sky.
The horizon is clearly shown on the map and you can click and drag the map to change the map to the direction that you are looking (the compass directions are shown along the horizon on the map).
If you click on the clock in the bottom left-hand corner then you can change the atlas to see the position of the stars for any date or time.
You can interact with the stars on the map to find out more about what you can see in the night sky. Click on a star and you can discover its name, how far away it is and what constellation it belongs to. One of my favorite features of the Star Atlas is the play controls.
If you click on the fast forward button you can sit back and watch a sped-up version of the stars passing across the night sky as the Earth turns.

Friday, May 10, 2019

EOMAP completes first 3D habitat map of Great Barrier Reef

The two main product types available are:
 digital, shallow water bathymetry maps for any or all parts of the Great Barrier Reef and
digital, shallow water seafloor reflectance (color and brightness) maps for any or all parts of the Great Barrier Reef.
Please note that all bathymetry products are at a nominal 10 cm vertical resolution.

From POB 

OMAP said it would present the world-first 3D habitat map of the Great Barrier Reef at the International Forum on Satellite-Derived Bathymetry in Australia. (Video available.)

500 m resampled map

International aquatic remote sensing company EOMAP said it would showcase the world-first 3D habitat map of the Great Barrier Reef (GBR) at the International Forum on Satellite-Derived Bathymetry, SDB Day 2019, May 14-16, 2019 in Australia.

The mapping project, ‘3D live habitats for the full extent of the Great Barrier Reef’, will provide, for the first time, maps of the predicted coral types and underwater landscape for the more than 3,000 reefs within the 350,000 km2 of the Great Barrier Reef (GBR).


EOMAP is the technology partner in the project with the University of Queensland (UQ), Great Barrier Reef Marine Park Authority, and the Australian Institute of Marine Science..

The resulting maps will be at an unprecedented 10m horizontal grid resolution and reveal bathymetry (water depth), geomorphic zonations and bottom types, in addition to the predicted coral types.

EOMAP SDB of Ningaloo Reef using the Landsat 8 sensor, at 30 meter horizontal resolution, down to a depth of 17.5 m. 
 Ningaloo reef with the GeoGarage platform (AHS nautical chart)

“No maps exist to date that provide so much detail for every single reef,” said Dr. Chris Roelfsema, project leader, from the Remote Sensing Research Centre at UQ.
He explains that a lack of detail in existing maps is an ongoing issue in environmental science.
“To understand and protect an environment you need to know the highest level of detail,” he said. "It's like managing your budget, if you don’t know exactly how much you have, then how do you know what to do?”

German and Australian scientists launched a set of groundbreaking, high resolution, shallow water topography maps for the entire Great Barrier Reef.
These world-first digital maps of the coral reefs, using satellite derived depth (bathymetry) techniques, are a critical step towards identifying, managing and essentially preserving and protecting what lies within the waters of this global icon.
for further information and data access: www.eomap.com/great-barrier-reef/

The ambitious scope of this undertaking was made possible by recent advances in satellite-mapping technologies, environmental modelling and image classification methods.
Using the European Space Agency Sentinel-2 platform satellite imagery, EOMAP applied its proprietary technology to retrieve satellite-derived bathymetry (SDB) and sub-surface reflectance (SSR).

The result of the SDB mapping is a 3D elevation model of the seafloor, one of the cornerstone data layers for the entire project.
“Accurately mapping bathymetry using satellite imagery requires very sophisticated, physics-based algorithms,” explained Dr. Magnus Wettle, Managing Director of EOMAP Australia.
“Our algorithms are able to account for the path of sunlight as it travels down through the atmosphere, through the water column, reflects off the seafloor and back up to the earth-orbiting satellite sensor.”


View with the GeoGarage platform

Both the SDB and the SSR data are fundamental to the overall project.
The SDB not only directly guides the geomorphology classification but is also used for environmental modeling input to calculate wave energy environments across the GBR.
The wave energy parameter in turn informs all reef habitat classification and predicted coral types.

The SSR data provides marine ecologists with additional, important information, when revealing the theoretical seafloor color for the final habitat classification.
Recent advances in machine learning and semi-automated classification then enable the researchers to efficiently and accurately process and classify all the reefs of the GBR.

“The importance of the outcomes from this project cannot be overestimated,” added Dr. Thomas Heege, CEO of EOMAP.
“As an example, to monitor coral bleaching over the entire Reef, a serious concern given recent events, you first need to know if you are looking at bleached coral habitat or at bright, reflective sediment. The 3D live habitat map gives you this baseline environmental information, correctly geo-positioned, to within 10 meters.”

“We are extremely pleased to be working alongside our project partners in helping to enable more effective monitoring and management of the global biodiversity icon that is the Great Barrier Reef,” concluded Dr. Wettle.

Links :

Thursday, May 9, 2019

Pirates made ocean vortex 'The Great Whirl' inaccessible. So scientists studied it from space.

Researchers have found a new way to use satellites to monitor the Great Whirl, a massive whirlpool the size of Colorado that forms each year off the coast of East Africa, shown here in a visualization of ocean currents in the Indian Ocean.
Credit: NASA Scientific Visualization Studio

From LiveScience by Mindy Weisberger

An enormous ocean whirlpool the size of Colorado appears every spring off the coast of Somalia, and it's so big, scientists can see it from space.
Satellite data recently revealed it's even bigger and lasts longer than once thought.

Known as the Great Whirl, this churning, clockwise vortex was first described in 1866 by British geographer Alexander Findley, in a book about navigating the Indian Ocean.
Findley said that its whirling created "a very heavy confused sea," and recommended that sailors avoid its powerful currents when approaching the African coast.

What causes the Great Whirl?
While the monsoon winds are thought to play a part, the vortex starts to form in April, about two months before the onset of the monsoon, and it persists for more than a month after the monsoon subsides in September or October, according to a study published in the journal Geophysical Research Letters in 2013.

 Annual absolute dynamic topography variance (m2) in the Arabian Sea.
The black box indicates the domain used for Great Whirl tracking in this study (5–10°N, 50–55°E).

The whirlpool starts to spin with the arrival of annual Rossby waves in the Indian Ocean.
These slow-moving waves, which measure just a couple of inches in height, carry reservoirs of stored energy that fuel the vortex.
Once the vortex is awhirl, the monsoon winds arrive and keep it spinning; at its peak, the Great Whirl can expand to over 300 miles (500 kilometers) wide, according to the 2013 study.

 Qualitative results of this study's algorithm in (a) June, (b) August, and (c) October 2012, compared to methods implemented on the Great Whirl in the past.
Absolute dynamic topography is shaded, and HYbrid Coordinate Ocean Model surface current vectors are overlayed.
Colored contours indicate each method: black = this study; blue = 35‐cm sea surface height threshold; green = 6‐cm sea surface height amplitude; red = streamline; magenta = −1.5 × 10⁻¹² Okubo‐Weiss threshold.
The selection of dates coincides with the formation date according to our algorithm (11 June) and subsequent steps at 2‐month interval.

Still, researching it in greater depth has proved to be challenging.
Because the vortex is so big, it behaves differently than smaller whirlpools.
Efforts to study it have also been hampered by pirates who operate near the Somali coast, according to a new study.

Researchers have found a new way to use satellites to monitor the Great Whirl, a massive whirlpool the size of Colorado that forms each year off the coast of East Africa.
This animation tracks the Great Whirl from May to December of 2000.
The color of the water represents sea levels - the redder the color, the higher the seas.
The black outline represents the new algorithm used for identifying the Great Whirl, and the white stars indicate the highest sea levels within the Whirl.
The animation starts before the Whirl forms and ends after it disappears.
After forming, most fluctuations are due to smaller eddies traveling east to west that are absorbed along the eastern edge of the Whirl.
The new method for identifying the Whirl is an improvement over past methods because it can potentially identify the Whirl before it's completely organized and it avoids classifying the disappearance and rapid re-emergence events as two distinct eddies, when in fact they are one and the same.
Credit: Bryce Melzer.

Observations from above

Scientists suspected that satellite data could provide insights into the Great Whirl.
They analyzed satellite observations spanning 23 years, and examined 22 years of ocean circulation models.
From that data, they developed a computer program that could identify the fingerprints of the vortex and track it over time.
They also analyzed sea level data, as the center of the whirlpool rises to form a mound that is higher than the ocean surrounding it.

In the new study, scientists determined that the whirlpool typically lasts for about 198 days — far longer than previous estimates of 140 days and 166 days.
It also ended months later than expected, prevailing through December and even into January in some cases.

And when the Great Whirl was at its most intense, it covered 106,000 square miles (275,000 square kilometers) on average, the study authors reported.

As the Great Whirl is linked to the onset of the monsoon, the new algorithm could also be used to detect patterns that shape monsoon formation.
This could help to forecast the amount of rainfall that the seasonal event brings to India, which affects agriculture across the country, lead study author Bryce Melzer, a satellite oceanographer at Stennis Space Center in Mississippi, said in a statement.
"If we're about to connect these two, we might have an advantage in predicting the strength of the monsoon, which has huge socioeconomic impacts," Melzer said.

Their findings were published online April 30 in the journal Geophysical Research Letters.

Links :

Wednesday, May 8, 2019

Ocean species are disappearing faster than those on land

The ocean is facing its greatest ever challenge - overfishing, pollution and climate change are all threatening the health of a resource on which the whole world depends.
The crew of this ship is on a mission to try and save one of the most endangered sea creatures on the planet.
They’re in the middle of a marine protected area in Mexico - a conservation zone where certain types of fishing are banned.
Local fishermen are poaching a species of fish that is so highly prized in China, they can make tens of thousands of dollars in just one night.
With ocean life under threat from overfishing, pollution and climate change, could marine protected areas be the answer?
Near the Mexican fishing town of San Felipe, on the The Upper Gulf of California...
Conservation group, Sea Shepherd is working with the authorities to help enforce a Marine Protected Area - or MPA.
A designated section of ocean to be conserved, managed and protected.
Maintaining rich, diverse ecosystems is key for the health of the Ocean - and ultimately the survival of humanity.
But ocean life is under threat.
From plants to micro-organisms and animals, species are disappearing forever.
Marine Biologist Patricia Gandolfo and the rest of the Sea Shepherd crew are here to stop poachers.
Caught up in the nets of the criminal gangs and local fishermen is one particularly rare porpoise - the Vaquita.
Worldwide there are thousands of sea species currently threatened with extinction.
Losing just one species from the food chain can have a disastrous effect on an entire ecosystem.
After it’s sold on, the Totoaba’s swim bladder can fetch up to $100,000 a kilo in China, where it’s prized for its medicinal properties.
Critics disapprove of Sea Shepherds use of direct-action tactics in some of their campaigns, but in the Gulf of California, their presence is welcomed by the Mexican government.
Globally, the fishing industry employs 260 million people, but many more subsistence fishermen depend on the ocean for their income.
Local fisherman here claim protecting the ocean has limited how they can fish, destroying their way of life. Yet doing nothing may ultimately present more of a threat to their livelihoods.
Currently Marine Protected Areas make up only 3.6% of the world’s ocean but a growing number of scientists are calling for 30% to be protected by 2030.
Cabo Pulmo now has a thriving eco-tourism and diving industry.
The environmental rewards provided by the MPA to the local community have been valued at millions of dollars a year - Far more than they ever made from fishing.
The ocean is facing its greatest ever challenge - overfishing, pollution and climate change are all threatening the health of a resource on which the whole world depends.
Marine protected areas can come in many forms.
But if they are to be effective, they must align the need for conservation with the needs of those who depend on the ocean for survival.
In order to avoid disaster–and to ensure a sustainable supply of fish for the future–far more of our ocean needs urgent protection.

From National Geographic by Christina Nunez

Climate change is being more keenly felt by the sea's cold-blooded creatures.

As the world's average temperatures creep higher, marine animals are far more vulnerable to extinctions than their earthbound counterparts, according to a new analysis of more than 400 cold-blooded species.

With fewer ways to seek refuge from warming, ocean-dwelling species are disappearing from their habitats at twice the rate of those on land, notes the research published Wednesday in the journal Nature.
The study, led by researchers from New Jersey's Rutgers University, is the first to compare the impacts of higher temperatures in the ocean and on land for a range of cold-blooded wildlife, from fish and mollusks to lizards and dragonflies.

While previous research has suggested warm-blooded animals are better at adapting to climate change than cold-blooded ones, this study punctuates the special risk for sea creatures.
As the oceans continue to absorb heat trapped in the atmosphere from carbon dioxide pollution, bringing waters to their warmest point in decades, undersea denizens don't have the luxury of ducking into a shady spot or a burrow.

"Marine animals live in an environment that, historically, hasn't changed temperature all that much," says Malin Pinsky, an ecologist and evolutionary biologist at Rutgers who led the research.
"It's a bit like ocean animals are driving a narrow mountain road with temperature cliffs on either side."

Narrow safety margins


The scientists calculated "thermal safety margins" for 88 marine and 318 terrestrial species, determining how much warming they can tolerate and how much exposure they have to those heat thresholds.
The safety margins were slimmest near the equator for ocean dwellers and near the midlatitudes on land.

For many, the heat is already too much.
At the warm edges of the marine species' ranges, the study found, more than half had disappeared from historical territory as a result of warming.

The rate for these local extinctions is twice that seen on land.
"These impacts are already happening. It's not some abstract future problem," Pinsky says.

The narrow safety margins for tropical marine animals, such as colorful damselfish and cardinalfish, average about 10 degrees Celsius.
"That sounds like a lot," Pinsky says, "but the key is that populations actually go extinct long before they experience 10 degrees of warming."

Even just a degree or half-degree boost, he adds, can lead to trouble finding food, reproducing, and other devastating effects.
While some species will be able to migrate to new territory, others—coral and sea anemones, for example—can't move and will simply go extinct.


Wider impact

"This is a really heavy hitting paper because it contributes hard data to support the long-standing assumption that marine systems have some of the highest vulnerabilities to climatic warming," says Sarah Diamond, an ecologist and assistant professor at Case Western Reserve University in Cleveland, Ohio who did not work on the paper.
"This is important because marine systems can get overlooked."

Most humans are landlubbers, after all—though many of our foods and jobs are tied to seaborne economies.
Pinsky points to species such as Atlantic halibut, winter flounder, and ocean quahog that have disappeared from historical habitats and are important to fisheries.

In addition to cutting the greenhouse gas emissions that are causing climate change, he says that stopping overfishing, rebuilding overfished populations, and limiting ocean habitat destruction could help address species loss.

"Setting up networks of marine protected areas that act as stepping stones as species move to higher latitudes," he adds, "could help them cope with climate change going forward."

Beyond the sea

The Rutgers study reflects how important it is to measure not just temperature changes but how they affect animals, says Alex Gunderson, an assistant professor of ecology and evolutionary biology at Tulane University in New Orleans who did not work on the study.

And that includes those who live on the land.
"Land animals are at lower risk than marine animals only if they can find cool shaded spots to avoid direct sunlight and wait out extreme heat," Gunderson points out.
"The results of this study are a further wake-up call that we need to protect forests and other natural environments because of the temperature buffer that they provide wildlife in a warming world."

Links :

Monday, May 6, 2019

Seafloor maps reveal underwater caves, slopes, and fault lines

This spectacular underwater volcano was just explored for the first time by scientists aboard the R/V Falkor. 2000 meters below the surface of the ocean, the ‘Big Pagoda’ hydrothermal vent is massive: 30m tall and 23m wide.
The liquid in these upside down pools is hydrothermal vent fluid.
Up to 320 degrees in temperature, it is a "soup" of harsh chemicals (including sulfur and metals) that allows life to thrive in a deep dark ocean.
The mineral-rich, hot fluids burst out of the seafloor, and then precipitate in the frigid ocean water, creating chimney structures.
The mirror is a mirage effect where cold saltwater and hot vent fluids refract light at different angles.
One theory is that that life on Earth began around hydrothermal vents, which could also be a possibility on other planets and moons too.
The novel organisms that are thriving in these extreme places surely have much to teach us about our own changing environment.
We are sampling the rocks, fluid, sediments, and biology here to try and unravel these #MicrobialMysteries.


From Wired by Eric Niiler

Larry Mayer is headed out this week on a ship to explore the Channel Islands off the Southern California coast.
Well, he’s actually exploring seafloor formations near the islands, looking for evidence that ancient peoples might have camped out in the caves as they migrated south some 15,000 years ago, a time when the sea level was 600 feet lower than today.

 Channel islands with the GeoGarage platform (NOAA nautical chart)

To do that, Mayer and a team led by famed Titantic explorer Robert Ballard will be using a new type of technology to provide three-dimensional imagery of the caves, a kind of acoustic camera.
The device uses existing multibeam sonar technology—which helped oceanographers scan the seafloor for the past 30 years—with improved resolution, computer processing speeds, and visualization software in one off-the-shelf package.

“This device can now give you a picture-like view made with sound,” says Mayer, director of the Center for Coastal and Ocean Mapping at the University of New Hampshire.
“The idea is to look for places that look like a beach and a cliff but are underwater.
If there are sea caves there, that’s where these people would inhabit.”

 photo : Schmidt Ocean Institute

The researchers have made several previous trips to these formations, but on this trip they will examine them in greater detail with the new acoustic camera mounted on a new drone surface ship.
Once they find the caves, they will send down a remote-operated vehicle called Hercules that has a high-definition video camera and robotic arms to grab samples.

The mission is just one of many recently in which ocean scientists have deployed new seafloor mapping technology and advanced autonomous vehicles to uncover startling new information about the ocean bottom.
There are discoveries like the underwater sea caves, deepwater coral formations off the East Coast, and new species of marine life clustered around hydrothermal vents spewing out methane and other chemicals from the Earth’s crust.
The new mapping techniques are also revealing hazards like seafloor faults, volcanoes, or unstable underwater slopes that could generate deadly tsunamis near coastal cities.

That’s what H. Gary Green and colleagues from the Canadian Geologic Service found during recent mapping of the Salish Sea, an inland waterway between the US mainland and Vancouver Island, British Columbia.
They detected two active fault zones—one of them newly discovered—that could trigger rockfalls and slumps of sediment that might lead to tsunamis that could be directed toward the San Juan Islands and Bellingham, Washington.

“You don’t want to scare the public, but it’s something that should be incorporated into any analysis for hazards,” says Greene, a marine geologist at the Moss Marine Laboratories in Moss Landing, California.
Greene and colleagues explored the Salish Sea with multibeam sonar sensors attached to the bottom of the research ship and seismic sensors on a small torpedo-like instrument towed 100 feet off the seafloor.
Their findings were reported in April at the annual meeting of the Seismological Society of America.

More of the mirror-like effect from the pooling superheated fluid.

Though the surface of Mars is some 34 million miles away, scientists know more about that planet’s surface than the bottom of Earth's own oceans.
Many marine scientists hope that might change in the next decade, mainly by using more robots and fewer human-staffed ships.
“What you have to do is take the ship out of the equation,” says Carl Kaiser, program manager at the Woods Hole Oceanographic Institution.
Running a large research vessel costs from $25,000 to $60,000 per day, and research cruises can last up to six weeks for mid-ocean expeditions.

Kaiser and members of his team are developing a shore-launched autonomous vehicle that could survey deeper waters of the US exclusive economic zone, a region that stretches 200 miles from the shoreline, at a lower cost and greater resolution than ship-based surveys.
Better mapping means more information about all kinds of strange environments, such as the methane seeps that attract sea life to deep plumes of minerals.
“In 2013, there was a paper that found there was one naturally occurring methane seep on the US East Coast,” Kaiser says.
“Today the number is north of 800, just because we have learned how to look for them and map them.”
A commercial firm is taking autonomous ocean-mapping ships to another level.
Louisiana-based L3 Technologies is designing a 100-foot, single-hulled, crewless ship, the C-Worker 30, that can cruise the ocean for two months at a time, at a speed of about seven knots.
Powered by diesel engines, the C-Worker 30 will also be able to launch two helper surface ships to expand the size and resolution of the underwater map.
The firm is pitching its project to the Pentagon and NOAA for ocean surveys at half the cost of a crewed ship, says Thomas Chance, vice president and general manager at L3 Technologies.

  photo : Schmidt Ocean Institute

By 2030, scientists hope to have a much more accurate seafloor map of the world’s oceans, says Eric King, operations manager for the R/V Falkor, a ship operated by the Schmidt Ocean Institute, a private, nonprofit foundation.
“We still have ships going over waters that were surveyed by Captain Cook with a hand lead line,” says King.
In Cook's day, back in the 1770s, surveyors would toss a long rope overboard with a lead weight on the end to mark the depth of the seafloor.

With new acoustic maps, shipping companies will also be able to avoid trouble spots, while researchers will know more about the habitats of endangered fish stocks as well as valuable minerals that lie on the seafloor.

Yet even with robotic vehicles puttering through the oceans, humans will still need to go to sea to interpret the data their instruments are collecting.
King leaves in August for a four-week cruise to explore a range of seven underwater seamounts between Hawaii and the Aleutians along with 44 other scientists and crew.
Imagine sending that many people to Mars.

Links :

A revolution in remote sensing is under way

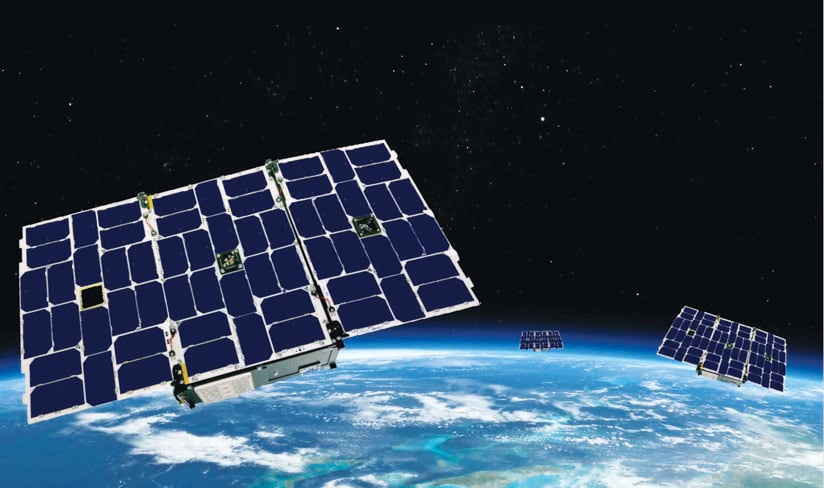
GeoOptics is putting a constellation of nanosatellites into space.
Radio signals collected by these satellites yield 100- to 500-meter vertical resolution.

From ESRI

Remote sensing, weather forecasting, and climate science are undergoing a drastic change.
Nanosatellites, which cost much less to produce and launch than traditional satellites, can now collect vast amounts of extremely accurate atmospheric data using a technique called radio occultation.
This data collection method wields GPS to monitor all sorts of variables between the earth’s surface and the top of the stratosphere—from atmospheric refractivity to moisture, pressure, and temperature.

The pioneer behind this science is Dr. Thomas Yunck, a leading expert on GPS and the founder, chairman, and chief technology officer of a startup called GeoOptics.

“This is a huge revolution,” said Yunck, who first looked into using GPS for science in 1979 while working as an engineer at the National Aeronautics and Space Administration’s (NASA) Jet Propulsion Laboratory (JPL).
He wrote the first-ever proposal to use GPS signals to measure the earth’s atmosphere from space in 1988, and he has been deeply involved in developing and validating this technology ever since.

“It’s disruptive technology that could replace the traditional, old, slow way of collecting modern, high-resolution weather data,” said Lawrie Jordan, Esri’s director of imagery and remote sensing.

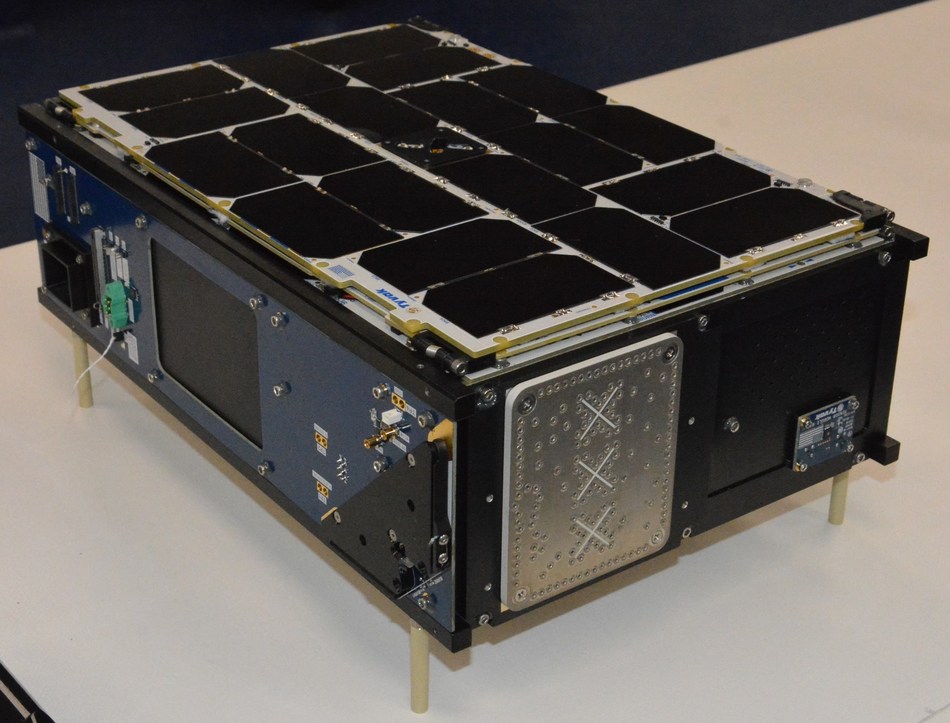
Tyvak Nano-Satellite Systems Inc. CICERO 6U Nanosatellite for GeoOptics
Picture Courtesy: CISION PR Newswire

An Ideal Solution to a Lot of Problems

Forty years ago, when GPS was brand-new, Yunck looked into how to apply the technology to science.
“We were using it to support deep space navigation at JPL, so we were investigating it for that purpose,” Yunck recalled.

After studying GPS for what he believes was about two weeks, he wrote an unassuming report stating that it was promising technology for the future.
“Little did I know that one day, it would consume my life,” he said.
“As time went on, we found that GPS was essentially an ideal solution to a lot of problems: navigating spacecraft, determining the locations of points on the ground, determining Earth’s rotation, and much more.
All these things could be addressed extremely efficiently with GPS.”

Throughout the 1980s, he and his colleagues at JPL devised a variety of precise techniques for using GPS to help map the topography of the ocean’s surface and measure tectonic plate motion, which had never been observed before.
The applications for GPS grew even further in the 1990s, and Yunck kept devising new ways to use the technology.

“It occurred to me that we could use GPS receivers on satellites to observe GPS signals passing through the atmosphere,” he said.
“If we could point antennas on satellites at the horizon, we could watch signals rise and set in the atmosphere, and we could observe the atmosphere itself.
This was a rather novel idea for GPS.”

It would also turn out to be an entirely different method for measuring the atmosphere, leading to more precise weather forecasting and studies on climate change.

NASA funded the early development of this idea, and that started the worldwide discipline for radio occultation.
But the technology is highly disruptive, especially now.


Shrinking Technology and Shifting the Paradigm

While Yunck and his colleagues at JPL were developing radio occultation, technological devices were shrinking physically.
“A cell phone is basically what, 20 years ago, would have been a super computer in a room,” said Yunck.
“Cell phones, computers, and other consumer-type devices like flat-screen TVs—they’ve all gotten a lot smaller and/or cheaper.”

The same kind of technology that facilitated the compression of consumer devices is now making it possible to build very powerful satellites that weigh 10 kilograms, have a volume of 6 liters, and cost under $1 million to build and a few hundred thousand dollars to launch.
“It’s that kind of technology that allows us to miniaturize spacecraft that used to be as big as a bus or a minivan and cost a billion dollars to build,” explained Yunck.

But the aerospace industry has been slow to get on board with miniaturization, mostly because government agencies have always had vertical control over space-based data collection—from developing the technology and getting it into orbit to gathering the data and using it.

In 2005, Yunck realized that the revolution he was trying so hard to push would have to materialize from the outside.
He got a few colleagues on board and formed GeoOptics, a small, private company based in Pasadena, California.

“We’re overturning a decades-long paradigm of having many government-owned assets in space and shifting to privately owned assets, where small companies are gathering, generating, and delivering data to governments,” said Yunck.
“Over the next 10 to 15 years, everything about remote sensing is going to change.”

Much More Accurate Atmospheric Data

Since its founding, GeoOptics has faced some technological and financial difficulties.
But the company now has three operational nanosatellites in orbit and, as of November 2018, is under contract to deliver its science-quality radio occultation data to the National Oceanic and Atmospheric Administration (NOAA) and the US Air Force.

“In the last couple years, they have come around to the concept of buying data from a private company because it’s much more cost-effective,” said Yunck.

Working with another Southern California-based startup, Tyvak, which builds the nanosatellites, Yunck and his team aim to put a group of satellites into space.
They call this the CICERO constellation, which stands for Community Initiative for Continuous Earth Remote Observation.

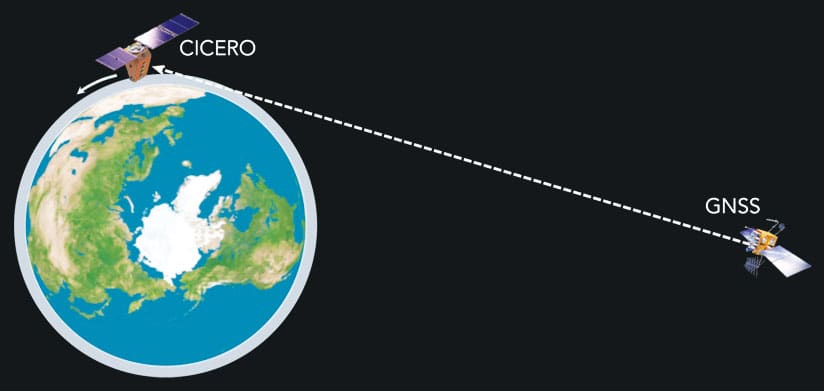
Radio signals originate at very high-altitude Global Navigation Satellite System (GNSS) satellites, pass through the atmosphere, and are received by much lower-altitude CICERO satellites.
As CICERO satellites move in orbit, they see the radio signal pass from the top of the atmosphere down to the surface before disappearing.

“I expect that within 10 years, we will have over 100 satellites,” said Yunck.
“That’s going to change the world.”

Using radio occultation, these nanosatellites produce better data than typical satellites, according to Yunck.
They collect active radio signals passing through the atmosphere to detect the atmosphere’s refractivity.
This lets scientists observe atmospheric density, pressure, temperature, and moisture.
They can also derive information about high-altitude winds from that data.

A radio signal collected by a CICERO satellite goes from the earth’s surface to the top of the atmosphere in about 60 seconds and yields 100- to 500-meter vertical resolution.
This allows them to measure over 150 levels of the atmosphere—far more than bigger instruments, such as radiometers, which typically measure 6 to 10 levels.
“It’s very high-resolution, high-frequency data,” said Jordan.
“It’s much more accurate, which will improve weather forecasts.”
“These satellites will have a direct impact on all the regimes of weather forecasting, such as 1- to 15-day weather forecasts, seasonal and longer climate forecasts, and severe storm forecasts,” said Yunck.

When monitoring a hurricane, for example, knowing the atmospheric pressure and moisture levels is critical to determining where the tropical storm is heading and how strong it will be when it makes landfall.
More accurate data will allow forecasters to make more specific predictions much farther in advance.


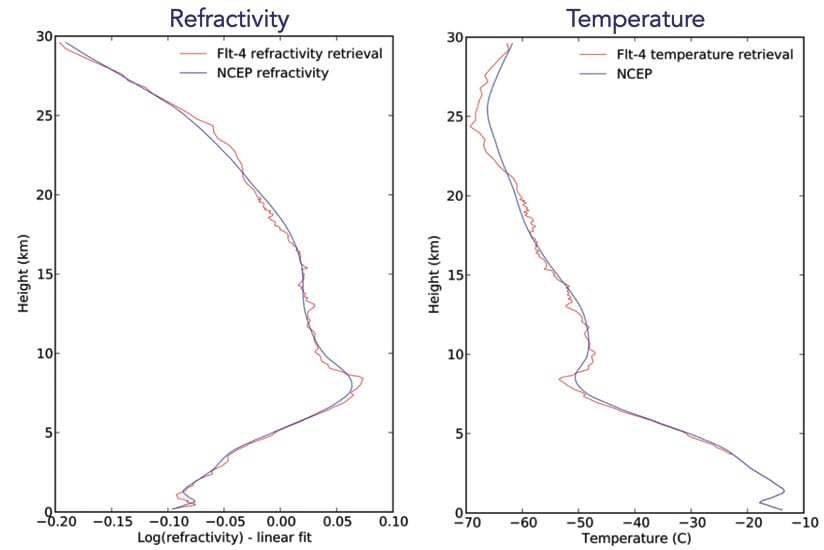
The red line shows atmospheric measurements made by CICERO satellites, while the blue line reflects the data model used by the National Oceanic and Atmospheric Administration (NOAA).
The two lines essentially match, but the measurements taken with the nanosatellites are much more detailed and precise.

It is also more useful for assessing how weather patterns change over time—i.e., climate change.
Currently, indicators of rising temperatures around the globe are derived from measurements taken on the earth’s surface.
While that’s useful, Yunck says we also need to know what’s happening in the atmosphere.
This is much more difficult.
But nanosatellites using radio occultation can get an abundance of three-dimensional atmospheric measurements, which Yunck says is critical for studying climate change.

How to Weather the Future
The future of weather prediction is here. Enormous computer models of the Earth’s atmosphere underlie modern weather forecasts, and driven by improvements in data, computers and modeling, today’s five day forecast has become as accurate as the three day forecast was in 1980.
Achieving the next decade’s improvement requires a new paradigm of data, created by small satellites that can generate orders of magnitude more data at lower cost.
GeoOptics CICERO constellation will use GPS radio occultation and other techniques to measure global weather patterns thousands of times per day.
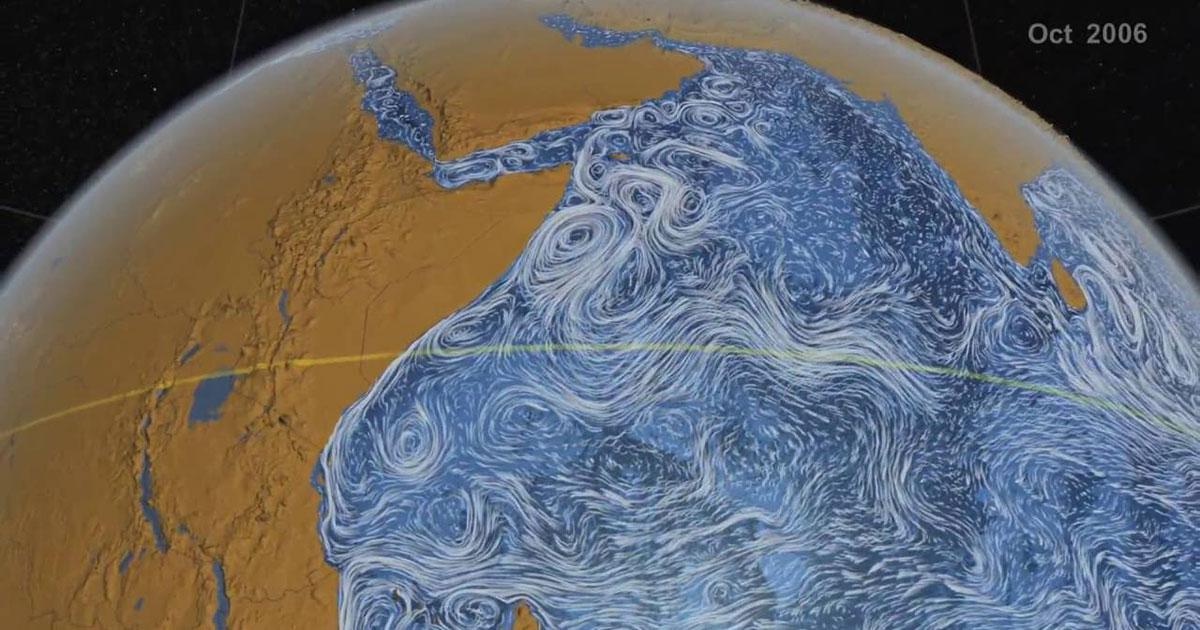
The Gravity of Water
Water is life.
The first step to managing the world’s water resources is to know where they are, and where they are at risk.
From glaciers and icebergs to groundwater and acquifers, water can be detected by its tremendous weight.
NASA’s GRACE satellite (first proposed by GeoOptics founder Tom Yunck, while he was at JPL) has measured the Earth’s gravitational field to produce incredible data on the flow of water around the world.
Now, in cooperation with NASA and partners at Tyvak, we are beginning work on the next gravity satellite constellation that will measure the movement of water across the globe in unprecedented detail.

“Our technique is so precise that our ability to measure temperature in the atmosphere is at least 20 times more accurate than any other known technique in space,” said Yunck.
“So far, it’s the only technique that can observe global warming over a short period of time—months or a few years, as opposed to 5 or 10 or 20 years.”

Links :