Saturday, July 6, 2024

In the rollers of the Tevennec lighthouse


The storm was breaking over Brittany.
The Tévennec lighthouse, reputed to be haunted, was under attack from the sea.
𝑀𝑎𝑡ℎ𝑖𝑒𝑢 𝑅𝑖𝑣𝑟𝑖𝑛
 
Localization of the Tevennec lighthouse with the GeoGarage platform (SHOM nautical raster chart)
 

Friday, July 5, 2024

Tracking 30 years of sea level rise


From NASA 

Thirty years ago, scientists and engineers launched a new satellite to study the rising and falling of seas over time, a task that once could only be done from the coast.
TOPEX/Poseidon rocketed into space on August 10, 1992, and started a 30-year record of ocean surface height around the world.
The observations have confirmed on a global scale what scientists previously saw from the shoreline: the seas are rising, and the pace is quickening.

Scientists have found that global mean sea level—shown in the line plot above and below—has risen 10.1 centimeters (3.98 inches) since 1992.
Over the past 140 years, satellites and tide gauges together show that global sea level has risen 21 to 24 centimeters (8 to 9 inches).

Starting with TOPEX/Poseidon, NASA and partner space agencies have flown a continuous series of satellites that use radar altimeters to monitor ocean surface topography—essentially, the vertical shape and height of the ocean.
Radar altimeters continually send out pulses of radio waves (microwaves) that reflect off the ocean surface back toward the satellite.
The instruments calculate the time it takes for the signal to return, while also tracking the precise location of the satellite in space.
From this, scientists derive the height of the sea surface directly underneath the satellite.

Since 1992, five missions with similar altimeters have repeated the same orbit every 10 days: TOPEX/Poseidon (1992 to 2006), Jason-1 (2001 to 2013), the Ocean Surface Topography Mission/Jason-2 (2008 to 2019), Jason-3 (2016 to present), and Sentinel-6 Michael Freilich (2020 to present).
The missions were built through various partnerships between NASA, France’s Centre National d'Etudes Spatiales (CNES), the European Organisation for the Exploitation of Meteorological Satellites (EUMETSAT), the European Space Agency (ESA), and the U.S. National Oceanic and Atmospheric Administration (NOAA). 
 
Together, the mission teams have assembled a unified, standardized ocean topography record that is equivalent to the work of a half-million tide gauges.
The scientists accumulated and corroborated a data record that is now long enough and sensitive enough to detect global and regional sea level changes beyond the seasonal, yearly, and decadal cycles that naturally occur.

“With 30 years of data, we can finally see what a huge impact we have on the Earth’s climate,” said Josh Willis, an oceanographer at the Jet Propulsion Laboratory and NASA’s project scientist for Sentinel-6 Michael Freilich.
“The rise of sea level caused by human interference with the climate now dwarfs the natural cycles. And it is happening faster and faster every decade.”

The map at the top of this page shows global trends in sea level as observed from 1993 to 2022 by TOPEX/Poseidon, the three Jason missions, and Sentinel-6 Michael Freilich.
Note the spatial variations in the rate of sea level rise, with some parts of the ocean rising faster (depicted in red and deep orange) than the global rate.
Many of the anomalies reflect long-term shifts in ocean currents and heat distribution.


1992 - 2022

The altimetry data also show that the rate of sea level rise is accelerating.
Over the course of the 20th century, global mean sea level rose at about 1.5 millimeters per year. By the early 1990s, it was about 2.5 mm per year.
Over the past decade, the rate has increased to 3.9 mm (0.15 inches) per year.

In the line plot, the highs and lows each year are caused by the exchange of water between the land and sea. “Winter rain and snowfall in the northern hemisphere shifts water from ocean to land, and it takes some time for this to runoff back into the oceans,” Willis noted. 
“This effect usually causes about 1 centimeter of rise and fall each year, with a bit more or less during El Niño and La Niña years. It’s literally like the heartbeat of the planet.”

While a few millimeters of sea level rise per year may seem small, scientists estimate that every 2.5 centimeters (1 inch) of sea level rise translates into 2.5 meters (8.5 feet) of beachfront lost along the average coast.
It also means that high tides and storm surges can rise even higher, bringing more coastal flooding, even on sunny days.
In a report issued in February 2022, U.S. scientists concluded that by 2050 sea level along U.S. coastlines could rise between 25 to 30 centimeters (10 to 12 inches) above today’s levels.

“What stands out from the satellite altimetry record is that the rise over 30 years is about ten times bigger than the natural exchange of water between ocean and land in a year,” Willis said.
“In other words, the human-caused rise in global sea level is now ten times bigger than the natural cycles.”
 
Links :

Thursday, July 4, 2024

Greenland’s marine ecosystem is experiencing a radical ‘regime change’

Wolfgang Kaehler/LightRocket via Getty Images

From Grist by Avery Schuyler 

Warming seas and dwindling sea ice are bringing new species to Arctic waters, a potentially irreversible tipping point for the ecosystem.

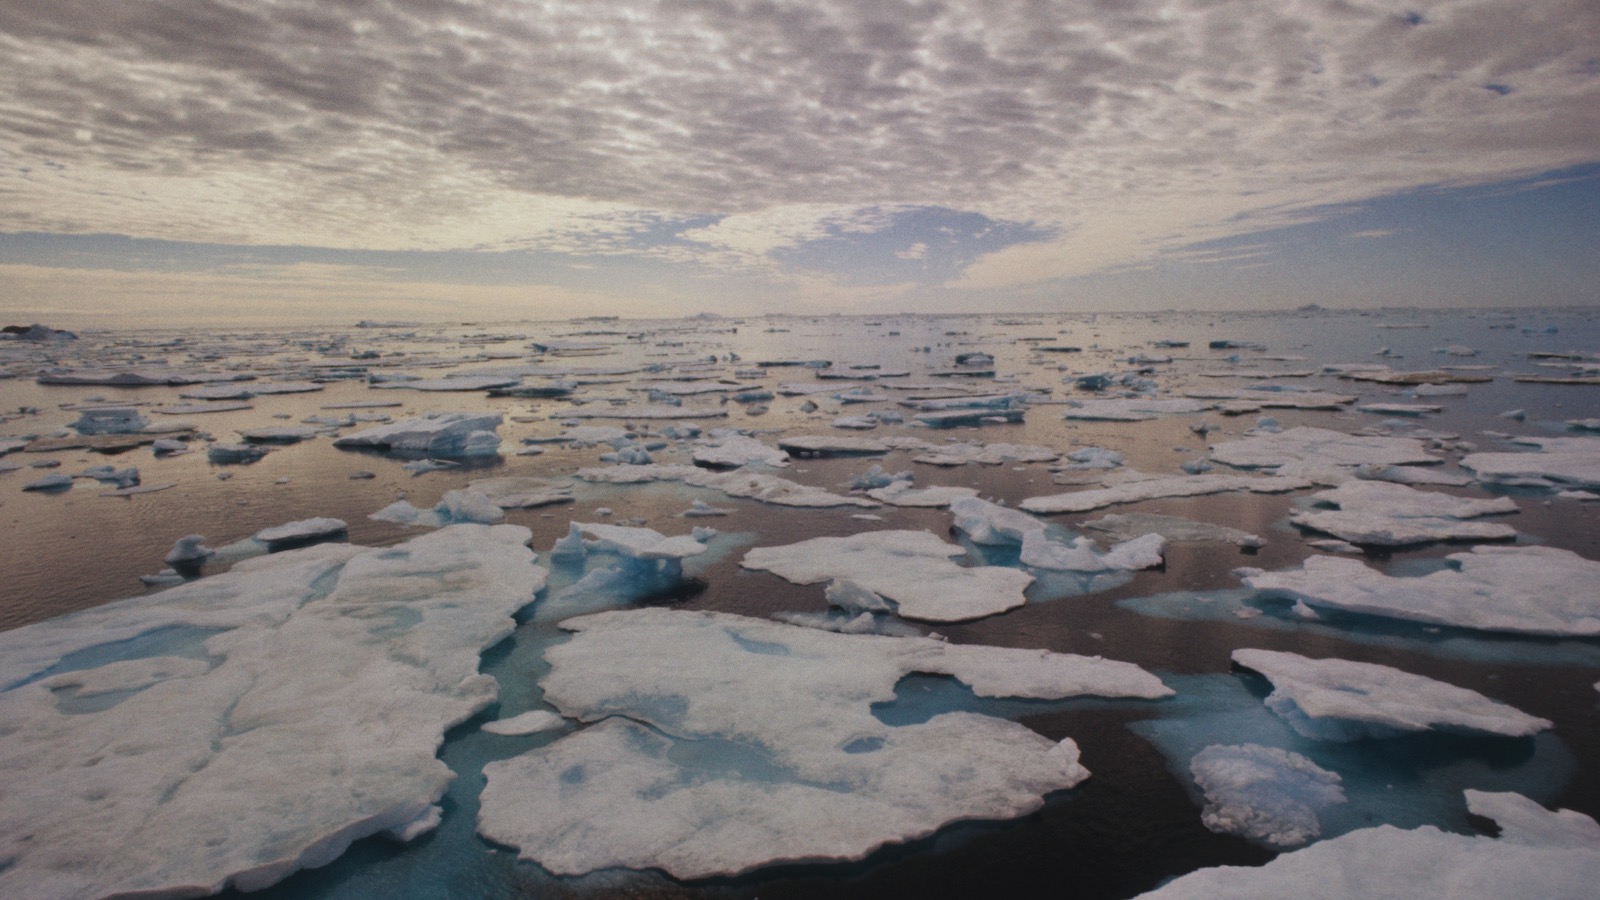
When marine biologist Mads Peter Heide-Jørgensen began studying the boreal waters that surround Greenland 40 years ago, an inflatable raft carried him through vast expanses of polar pack ice, with narwhals and walruses frequently passing by.
The astounding blue sea ice seemed almost inviolable in its grandeur.

But with Greenland reaching its highest temperatures in the past 1,000 years, the scene is changing.
Arctic sea ice, which is responsible for maintaining cool polar temperatures, is dwindling rapidly.
The oldest and thickest of it has declined by 95 percentduring three decades of global warming.

“There’s a whole beautiful landscape that used to be there,” said Heide-Jørgensen, a researcher at Greenland Institute of Natural Resources.
“Nowadays, we can see that all the ice is gone.”

So too are a growing number of the creatures that lived among it.
Inuit communities are seeing little to no evidence of endemic species like the narwhals and walruses that Heide-Jørgensen grew familiar with.
Instead, they are finding animals native to more southerly waters, including mackerel, bluefin tuna, and many kinds of cetaceans, all of them drawn to the warming waters and abundant prey.

Visual observation and remote sensing leave Heide-Jørgensen and fisheries biologist Brian Mackenzie with little doubt that a potentially irreversible regime shift – a change from one stable ecological condition to another – is occurring.
Unprecedented numbers of dolphins and fin and humpback whales suggest a tipping point in the marine ecosystem off the east coast of the world’s largest island.
This climate-driven shift means not only that meteorological and climatological phenomena thousands of miles away can affect local conditions in unexpected ways, but they create the potential for cascading effects throughout entire ecosystems.

“It has a very specific driving force for the tipping element, which is the sea ice.” said Heide-Jørgensen, who attributes the regime shift primarily to a significant decrease in summer sea ice arriving from the Beaufort Sea.

That body of water, located along the northernmost seaboard of Alaska, generates the pack ice found off the coast of eastern Greenland.
It is carried there over the course of several years by winds and currents.
For native marine species in Greenland, the ice regulates temperatures by reflecting sunlight and provides critical habitat and nursery grounds for animals, invertebrates, and algae.

As the tern flies, the Beaufort Sea is about as far from these waters as Anchorage, Alaska, is from Portland, Oregon.
“It’s a huge distance,” said Heide-Jørgensen.
He noted that the scope of what’s happening in Greenland shows that the effects of climate change are certain and long-ranging, impacting ecosystems across thousands of miles.
“It goes far beyond what we had originally thought.
Local systems can be severely affected by something so far away, which is a lesson learned.”

While many studies have shown regime shifts in other marine ecosystems across the globe, there has been little revealed on such shifts in the Arctic until now.
The researchers note that the process that spurred the radical change likely began 10 to 20 years ago when temperatures started to increase more dramatically.
Thanks to 19th-century explorers, records of ice throughout Greenland date to 1820 and help reveal climatological patterns and effects.

“It contributes to the general evidence basis for how climate change is affecting life in the oceans,” said Mackenzie, a professor at Technical University of Denmark.
“There’s now many studies showing changes in distributions, changes in food webs, and so on.
Not many for the Arctic or in sort of remote places like this.
And so it’s contributing to the pattern that we’ve been seeing in the scientific community.”

Humpback whales, usually found off the coast of New England and Newfoundland and in the waters north of Scandinavia, are now migrating by the thousands along the east coast of Greenland.
Fin whales, also usually seen offshore in the North Atlantic, are increasingly common as well.
And while this shift isn’t necessarily bad for the opportunistic cetaceans, which can adapt to a certain threshold of oceanic shifts, it places immense stress on endemic species like narwhal.
The researchers suspect the native creatures are moving north as the water warms and interlopers arrive.

Newcomers like the whales, which require a lot of food to sustain themselves and migrate thousands of miles, are now consuming more than 1 million tons of food per year, outcompeting other animals.
“There are big ecological implications for local biodiversity and the interactions among species,” said Mackenzie.
“Particularly in predator to prey competition relationships.”

Marine species aren’t the only ones who will experience these ramifications.
Changes in species distributions, especially fish, could reshape commercial fisheries.

Bluefin tuna had never been recorded off the eastern shore of Greenland prior to 2012, but have been recorded every year since.
“We got some reports from Greenlandic fishing crews that they had caught some bluefin tuna as bycatch,” said Mackenzie.
“And we could see that the temperature in the area had increased quite a bit compared to previous years. The thermal habitat expanded, and that’s one of the reasons why we think the tuna started to show up.
Mackerel itself had not been seen in Greenland waters before 2011, and we think that the tuna more or less followed the mackerel.
With changes like this, it’s likely that there’s multiple effects throughout the entire food web, especially at lower trophic levels.”

Unless ice export from the north increases and temperatures cool, it is very likely that this new regime will become permanent.
“It would require the unlikely and substantial reversal of current warming, and several years to reverse the trend with little multiyear ice in the Arctic Ocean,” said Heide-Jørgensen.
“No climate deals seem to cover that at the moment.”

Given the pace of global climate change, the Arctic Ocean could within our lifetimes record its first summer without ice.
Some studies suggest that may happen within a few decades.
“Forty or 50 years ago, that concept would be unthinkable,” Mackenzie said.
“But it looks like it’s going to happen.
And if that does happen, it would mean even more major changes on the food web and ecosystems up there.”

Wednesday, July 3, 2024

World's largest deep-sea octopus nursery discovered


Scientists discovered over 1,000 females, many brooding eggs, in a shimmering “octopus garden" that may be seeping natural gas or hot water.

From National Geographic by Jason Bittel

OFF THE COAST of Monterey, California, and some two miles below the surface of the Pacific Ocean, scientists piloting a remotely-operated submersible saw something no one has ever seen before.
Octopuses. 
Hundreds of them. 
Huddled on a rocky outcrop at the base of an underwater mountain.
“We went down the eastern flank of this small hill, and that’s when—boom—we just started seeing pockets of dozens here, dozens there, dozens everywhere,” says Chad King, chief scientist on the Exploration Vessel Nautilus.

All in all, King estimates that more than 1,000 octopuses known as Muusoctopus robustus were nestled among the rocks, most of which appeared to be inverted, or turned inside out.
For this species, that inside-out pose is common among females that are brooding, or protecting their growing young.
In some cases, the submersible’s camera could even spot tiny embryos cradled within their mothers’ arms.
“Out of that 1,000, we might have seen two or three octopuses that were just swimming around,” says King, who is also a marine biologist at the Monterey Bay National Marine Sanctuary
“So I’d say almost 99 percent were brooding.”
What’s more, the scientists noticed that the water appeared to shimmer in multiple places where the octopuses were concentrated—“kind of like an oasis or a heat wave off the pavement,” says King.
This suggests that warm water may be seeping out of the seamount in places, and the octopuses are huddled in those spots. 
Though the submersible was not equipped with temperature probes on this dive, if the finding is verified, it could mean the octopuses are seeking out such warmth to help incubate their eggs.
“It definitely looked like the octopuses wanted to be there,” says King.
 
Brooding mother octopuses curl up, facing their suckers outward in a defensive position.
ROV SuBastian / Schmidt Ocean Institute under 
 
Octopus garden

Amazingly, the discovery comes just months after scientists reported the only other deep-sea octopus nursery on record — an aggregation of around 100 octopuses along the Dorado Outcrop off Costa Rica. They may even be the same species as those discovered off of California, but no one can say for sure yet.
(Related: “Deepest Octopus Nursery Discovered, Holds Dark Secret”)

“I've been working on octopuses since 1982, and I would have sworn that our observations at Dorado Outcrop were a once-in-a-lifetime opportunity,” writes Janet Voight, a marine biologist at the Field Museum in Chicago, in an email. 
“To see these videos 10 months after our paper came out makes me think there are a lot more places like this down there than I ever dared imagine.”
There are key differences between the octopus sightings, however.

For starters, the Costa Rican sighting involved far fewer octopuses.
Also, Voight and lead author Anne Hartwell were able to confirm that the Costa Rica site did, indeed, have warm fluid billowing up from the seafloor.
However, in that case, it appears to have been a bad thing, because none of the eggs the octopuses were incubating seemed to be growing. It may be that the water was actually too hot.
In the new video captured by the Nautilus team, though, Voight sees signs of life.
If you look closely at one of the egg cases, you can just make out the eye of a developing embryo.
“Which means that these eggs are developing well,” says Voight, “or at least that one is.”

So many questions
 
While the new footage offers an exciting glimpse into the lives of these creatures, it also reveals how little we know about these octopuses and the environment they inhabit.
For instance, not everyone is convinced that the shimmer means warmth.
According to senior scientist Bruce Robison of the Monterey Bay Aquarium Research Institute, the geologists who study this region say it’s been inactive for millions of years. “

Thus it's very unlikely that there is any heat involved,” he writes in an email.
(Related: “Octopus Cares For Her Eggs For 53 Months, Then Dies”)

If anything, Robison guesses the shimmer could be caused by a seepage of methane gas.

King, however, says they didn’t see any of the bacterial mats, clams and other species you’d expect to see with a methane seep. Furthermore, it may not even be the heat the octopuses are attracted to. “Maybe it’s just because that’s the best rock available,” says King.

Adds Voight: “This observation is just further proof that we have no idea of what is going on in the deep sea.”

Links :

Tuesday, July 2, 2024

Goodbye Natick! Microsoft has given up on one of its coolest projects ever — underwater data center pilot canned despite successful outcomes and won't come back


From TechRadar by Wayne Williams 

Microsoft has officially killed off Project Natick, its underwater data center experiment, which began life in 2015.

Noelle Walsh, Head of Microsoft’s Cloud Operations + Innovation, told Data Center Dynamics, "I'm not building subsea data centers anywhere in the world. My team worked on it, and it worked. We learned a lot about operations below sea level and vibration and impacts on the server. So we'll apply those learnings to other cases."

Although we’d not heard anything about the subsea project in a while it was assumed to still be active, but we now know that’s not the case.

Microsoft’s Project Natick: Power washing a data center that sat on the sea floor off the Orkney Islands in Scotland
(photo by Jonathan Banks/Microsoft)
 
Moving towards robotics

The underwater data center project was first tested off the coast of Scotland in 2018. Microsoft placed 855 servers underwater for over two years, and only six of them failed. For comparison, eight out of 135 servers failed in a similar land test. In percentage terms, that’s 0.7% failure rate underwater versus a 5.9% rate on land.

At the time, Project Natick lead Ben Cutler said he believed the subsea success rate was down to the absence of humans on board interacting with the servers in the capsule and the use of less corrosive nitrogen in place of oxygen.

Enthusing about the early findings, Microsoft Research's technical team principal member Spencer Fowers said, “We have been able to run really well on what most land-based data centers consider an unreliable grid. We are hopeful that we can look at our findings and say maybe we don’t need to have quite as much infrastructure focused on power and reliability.”

Project Natick was incredibly promising and Microsoft was even looking at how it could be used as an ‘artificial reef data center’ that would not only provide a good home for servers but also ocean life, but ultimately it has come to nothing.

Microsoft is exploring other advanced technologies, like robotics, to improve data center operations. Walsh told DCD, "We're looking at robotics more from the perspective that some of these new servers will be very heavy. How can we automate that versus having people push things around? We are learning from other industries on robotics, but we're also very cognizant that we need people. I don't want people worried about their jobs.” The tech giant is also considering other ways of powering data centers including looking into modular nuclear reactors.


While Microsoft has ended its underwater initiative, other companies, like ones in China, are starting their own underwater data center projects.
 
Links :

Monday, July 1, 2024

Portugal (IHPT), a new layer in the GeoGarage platform

 100 nautical charts based on rasterized ENC
 
PT528507 Figueira da Voz harbour 
 
Notes :

- the layer includes Portugal coast, Madeira, Açores, Cabo Verde, plus additional charts for Guiné-Bissau, Sao Tomé e Principe and Angola

- this layer with 100 ENC replaces the few fac-similé raster charts from UKHO (59 charts) based on raster IHPT chart material. The next Q3 update of the British & misc. layer (UKHO) will therefore no longer contain maps for Portugal.

 
Portugal coverage with 59 IHPT raster facsimilé charts
in the British & misc (UKHO) Q2 current layer
 
A more complete and update coverage with 100 IHPT ENCs
 
including Açores

& Madeira
 
& Cabo Verde


Every ship sunk in WWII

You can also explore the data for yourself on the Esri dashboard map Sunken Ships of the Second World War. This dashboard allows you to map the sunken ships of WWII by country, by year, by the 'country that did the sinking' and by belligerent (Axis, Allies or Neutrals).
 
From GoogleMapMania by Kleir Clarke
 
Over the course of the Second World War more than 20,000 ships were sunk around the world.Esri's Paul Heersink has spent the last ten years scouring historical records to create and map the 'most comprehensive dataset' of ships sunk in WWII.
Resurfacing the Past is a fascinating story map which not only visualizes where Allied and Axis ships were lost in WWII, it also explores the WWII sunken data by year, by size and by type.
 
For example the animated GIF above shows the number of Allied and Axis ships sunken in each year of the war.
 
It clearly shows how the Allies "suffered devastating losses in the first years of the war
"However by 1943 it was the Axis who were losing the battle for the seas. The map reveals that from March 1943 "the Allied forces sank more ships every month than they lost."

Mapping the sinks sunk in WWII by type reveals that most of the ships that were sunk in the war were not designed to be combat ships.
Non-combat ships such as tankers, tugs, cargo ships and floating hospitals suffered the most losses.
The Resurfacing the Past story map guides you through the huge scope of Paul Heersink's sunken ship data, highlighting some of the important stories that the data reveals.

Sunday, June 30, 2024

Poland (HOPN) new layer in the GeoGarage platform

 67 nautical charts based on rasterized ENC
 
PL5KOLOB : port of Kolobrzeg

Cap Taillat, do you Saint Tropez Gulf

video LR Production
other video from Dreaam Air drone

Old map with minutes de sondes
 
Cap Taillat forms the boundary between the communes of La Croix Valmer and Ramatuelle
 
Raster map 7267

ENC FR572670