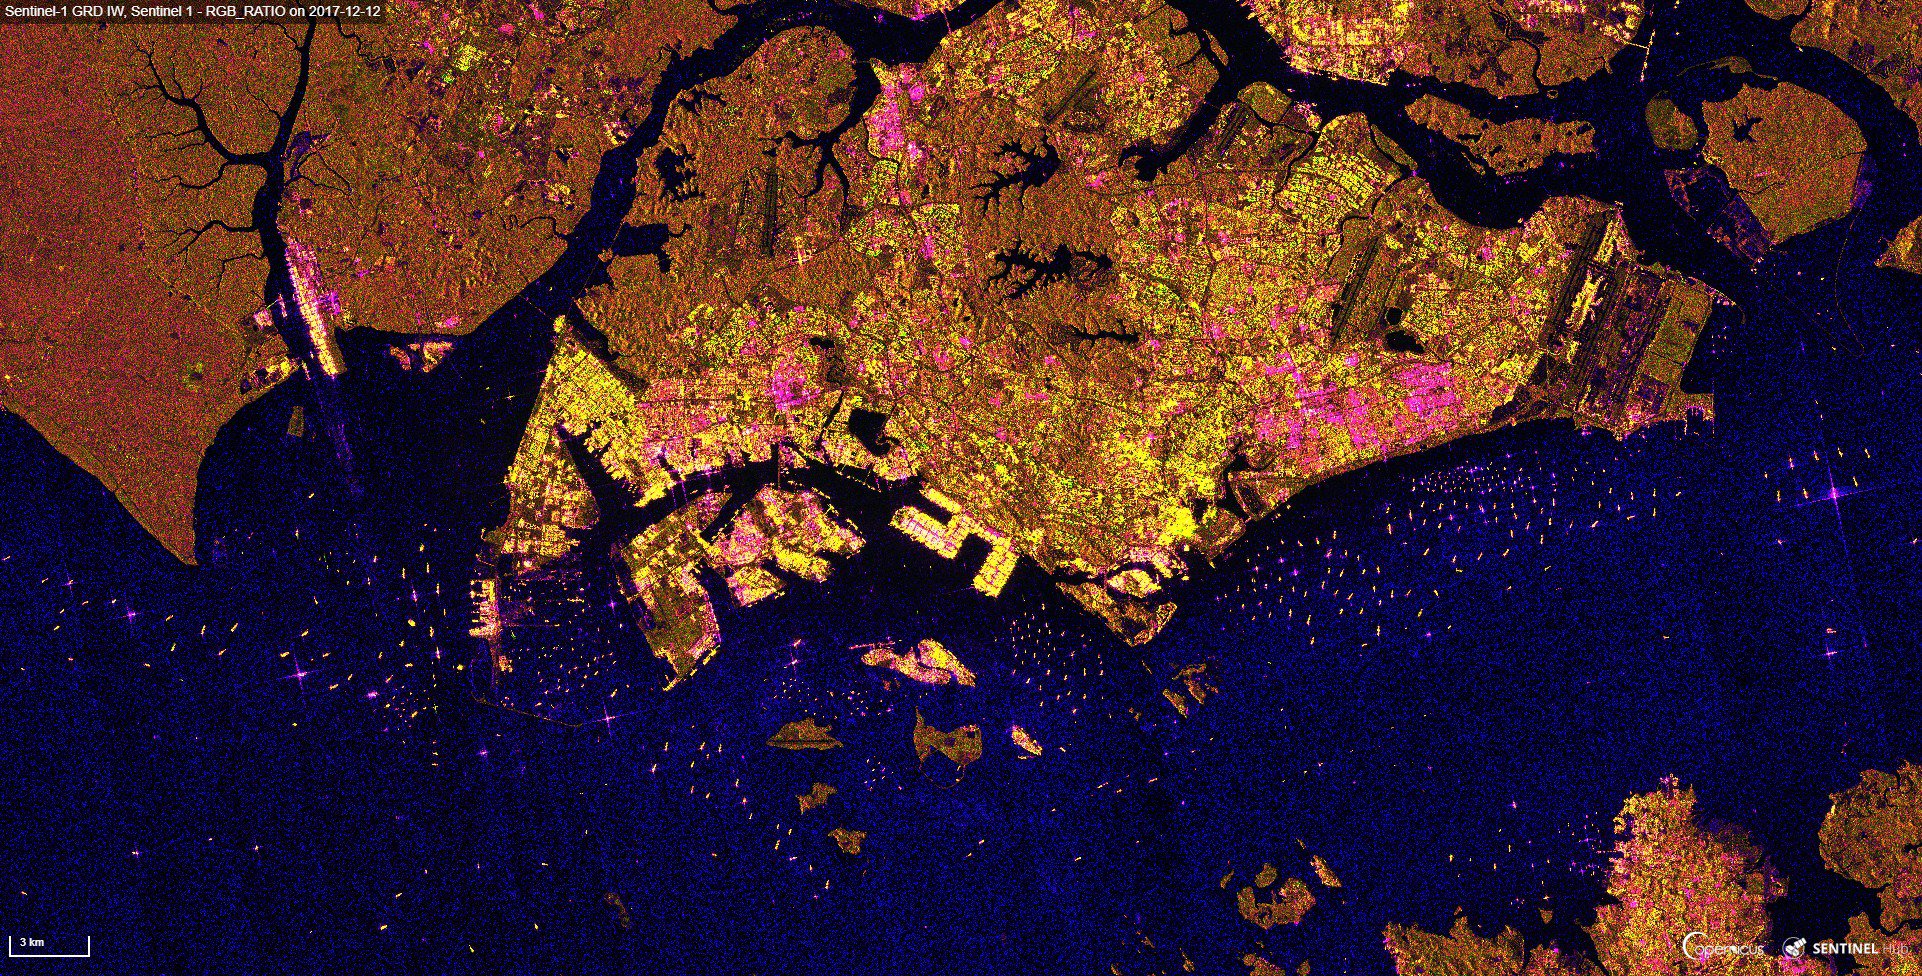
This multitemporal composite generated just now shows activity in the Channel
Saturday, September 29, 2018
Friday, September 28, 2018
ECDIS & maritime accident investigation
Approaching to Gibraltar
From Marine Electronics by Captain Paul Whyte, Associate Master Mariner, LOC
It's not where you are, it's where you should not be that matters
Captain Whyte, a leading marine accident analyst at LOC Group, an independent marine and engineering consultancy which provides services to the shipping and offshore energy industries, explains how electronic data is making accident investigation clearer by providing irrefutable evidence.
"Fundamentally, situational awareness underpins everything we do", said Captain Whyte.
"Whether that's crossing the road or driving ships at sea. We need to know where we are, what we're doing and where we are going. If a vessel has grounded or had a collision, then clearly the bridge crew must have lost their situational awareness."
He says that every deck officer should have a good working knowledge of the International Regulations for Preventing Collisions at Sea, 1972 (COLREGS), and in using these 'rules of the [sea] road' every Master and Officer of the Watch (OOW) should observe the four 'A's at all times;
- Aware; the bridge team must be aware and maintain a proper lookout
- Anticipation; the vessel should travel at a safe speed giving space and time to assess if there's a risk of collision
- Application; the crew should know the COLREGS and particularly the risk of collision, and should follow the regulations
- Action; the crew must take positive and early action to avoid a collision.
E-navigation is defined by the IMO as;
'the harmonized collection, integration, exchange, presentation and analysis of marine information on board and ashore by electronic means to enhance berth to berth navigation and related services for safety and security at sea and protection of the marine environment.'It covers a number of ship and shore-based technologies that all significantly support and improve situational awareness and decision-making.
These include but not limited to the Automatic Identification System (AIS), Electronic Chart Display and Information System (ECDIS), Integrated Bridge Systems/Integrated Navigation Systems (IBS/INS), Automatic Radar Plotting Aids (ARPA), Long Range Identification and Tracking (LRIT) systems, Vessel Traffic Service (VTS) and the Global Maritime Distress Safety System (GMDSS).
All these sources produce data to determine situational awareness and that can also be analysed in any accident investigation.
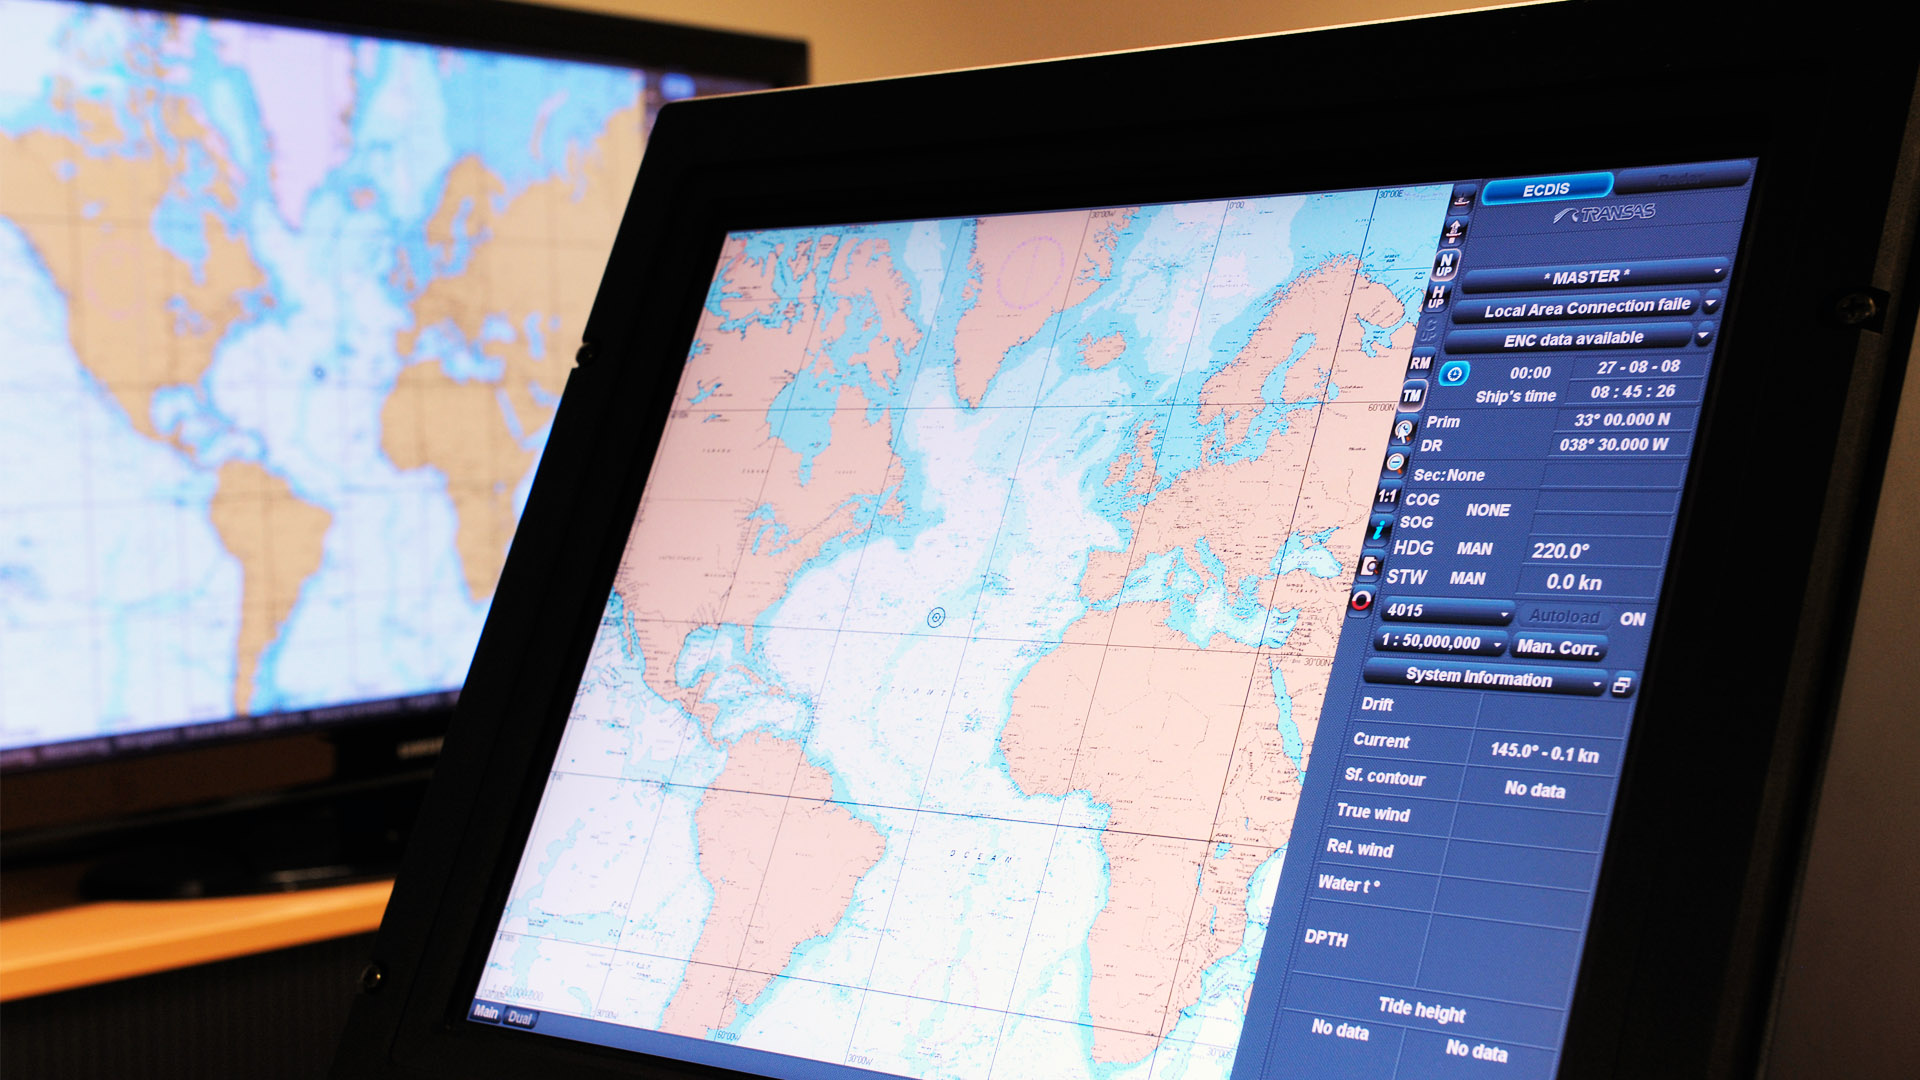
The electronic chart displays the vessel's 'real-time' position, course and speed.
It also carries out different complex functions to help improve the bridge crew's 'situational awareness' and can meld together radar imagery, ship information, chart activity and AIS information all into one view.
Using such tools, ECDIS can help to establish the best time-saving route planning within pre-defined 'safety corridors' although Captain Whyte cautions that a one-to-one check of the entire route from berth to berth must still be carried out.
Furthermore, ECDIS can 'replay' the entire course navigated over the previous 12 hours, recording the entire voyage using 4-hourly time markers.
The International Maritime Organisation (IMO) made the carriage of ECDIS mandatory under Safety of Life at Sea (SOLAS) Chapter V (Safety of Navigation) for most large vessels of 3000 GT or more, on 1 July 2018.
Looking ahead, Captain Whyte says that although only one third of the global fleet is currently required to use ECDIS, he envisages it spreading further and wider as shipowners see the benefits, regardless of vessel size.
The IMO made the carriage of AIS mandatory under SOLAS V for all vessels of 300 GT or more engaged on international voyages from 31 December 2004.
AIS is publicly broadcast via a VHF transponder device with the primary function of improving ship-to-ship and controlled water space 'situational awareness', such as major ports and traffic pinch-points like the Dover and Singapore Straits.
AIS transmits dynamic position and movement data, voyage related facts and static information such as vessel details designed to enhance water space management within the VHF horizon.
An unintended consequence of AIS has been the ability of organisations to globally harvest AIS transmissions using low-earth orbiting satellites and terrestrial receivers and share it with companies like LOC, who use it for investigation purposes.
ECDIS implantation
Using an electronic navigational chart within ECDIS, the OOW can monitor the safety corridor, safety contours, their own vessel GPS and its vector, any other vessels AIS and vector, the tide vectors and exploit the customizable menu.
Captain Whyte adds that another valuable source of navigation investigation data is the vessel's Voyage Data Recorder (VDR) - the 'black box' - which is an IMO requirement for passenger ships and vessels over 3000 GT.
VDR is a collection and storage device, recording on a continuous loop, and records the command and control inputs of the vessel.
Software used for the reconstruction of an incident of the 'black box' and other electronic data is highly valued by investigators, lawyers and insurance interests.
A traditional casualty investigation might have involved; attending the casualty, interviewing the crew and taking statements, collecting contemporaneous (and digital) evidence, determining the 'angle of blow', establishing the 'type and location of damage' in groundings - understanding which way the vessel was going, providing documentation (including digital evidence) and engaging experts if there's no agreement and ultimately proceeding to trial.
Today, modern accident analysis means conducting an investigation using all the electronic evidence, validating any contemporaneous evidence and assessing any incontrovertible evidence which leads to an agreed set of facts and an understanding of the causation.
This means that the parties involved can agree liability and costs, often without resorting to costly litigation and trial.
In addition, LOC has two further specialist tools which support its accident investigation analysis, by importing the electronic navigational data to reconstruct the grounding or collision scenario or modelling the 'what-if' options with the meteorological conditions at the time of the casualty.
The first is MADAS (Marine Accident Data Analysis Suite) which was developed by Avenca Ltd, for the UK's Maritime Accident Investigation Bureau and the US National Transport Safety Board.
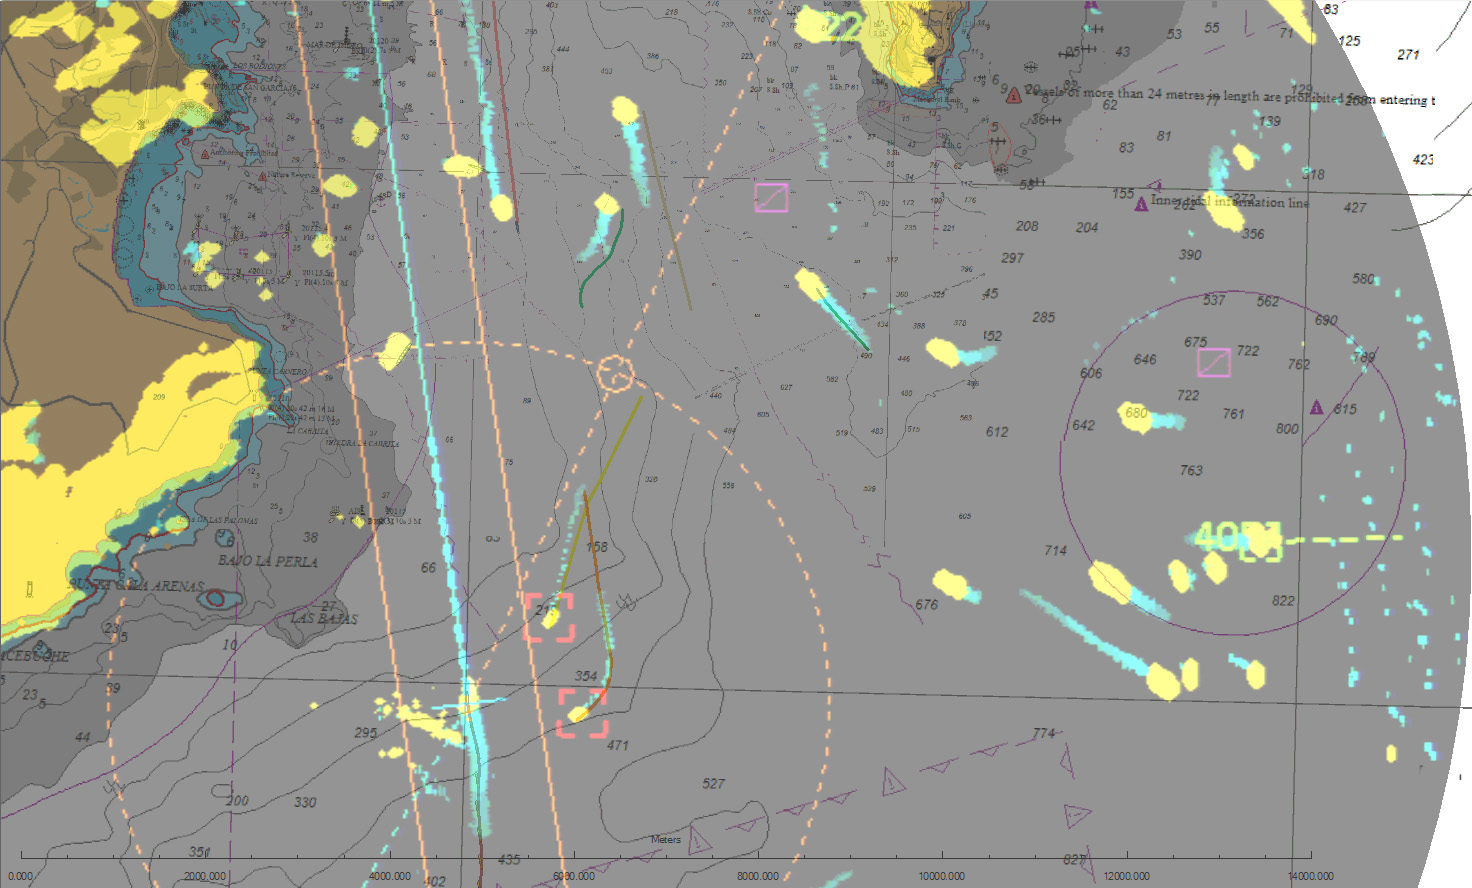
MADAS can display multiple vessel tracks, extracting and using the AIS and/or VDR data, it can use the audio track recordings of the crew at the bridge and the bridge wings during the incident.
It can display different charts and overlays, and media including radar and CCTV - to show in 2-D the unfolding scenario, using precise vessel shapes, so the investigator can determine causation.
BMT have developed advanced manoeuvring assessment and simulation capabilities to aid in port design and crew training.
REMBRANDT is a real and fast time ship-handling and manoeuvring simulator.
It is PC based and designed using standard user interfaces and structure to ensure user-friendliness. It is principally designed for the following applications:
• Manoeuvre rehearsal
• Ship performance and operational assessments
• Assessment of port arrangements (berths, channels, etc)
• Assessment of tug requirements
• Ship-handling training
• Incident investigations
The second tool used by LOC for deciphering electronic intelligence is the 3-D programme REMBRANT (Real-time Manoeuvring, Berthing and Training) which was developed by BMT, which enables the user to build a 3-D imagery of the 2-D analysis.
This tool allows LOC to show a client how the incident looked from the bridge or birds-eye, whether by day or night, including modelling the 'what if' actions to avoid the incident.
Captain Whyte concludes that: "As I have already said, navigation is not about knowing where you are, but much more about knowing where you should not be, and still, too often ships end up where they should not be, sometimes with dangerous and hazardous consequences for all in the vicinity."
"But, by using electronic data and specialist tools we can now decipher the incontrovertible electronic evidence to understand exactly what happened, and if necessary, what actions would have prevented the incident."
Captain Whyte adds that: "By using the electronic data which is now available in any investigation, we can clearly see how the incident proceeded, and can then reach a conclusion much faster and cheaper for all those involved."
Links :
- Nautical Institute : 201257 Improper bridge procedures and ECDIS use caused grounding ...
- ShipInsight : ECDIS again blamed as cause of marine accident
- Safety4Sea : ECDIS safeguards ignored at Muros grounding
Thursday, September 27, 2018
Scientists have been drilling into the ocean floor for 50 years – here’s what they’ve found so far
Scientists have expanded human knowledge by
drilling core samples from the world’s ocean basins, but their work is
far from done.
From The Conversation by Suzanne O'Connell
It’s stunning but true that we know more about the surface of the moon than about the Earth’s ocean floor.
Much of what we do know has come from scientific ocean drilling – the systematic collection of core samples from the deep seabed.
This revolutionary process began 50 years ago, when the drilling vessel Glomar Challenger sailed into the Gulf of Mexico on August 11, 1968 on the first expedition of the federally funded Deep Sea Drilling Project.
I went on my first scientific ocean drilling expedition in 1980, and since then have participated in six more expeditions to locations including the far North Atlantic and Antaractica’s Weddell Sea.
In my lab, my students and I work with core samples from these expeditions.
Each of these cores, which are cylinders 31 feet long and 3 inches wide, is like a book whose information is waiting to be translated into words.
Holding a newly opened core, filled with rocks and sediment from the Earth’s ocean floor, is like opening a rare treasure chest that records the passage of time in Earth’s history.
Over a half-century, scientific ocean drilling has proved the theory of plate tectonics, created the field of paleoceanography and redefined how we view life on Earth by revealing an enormous variety and volume of life in the deep marine biosphere.
And much more remains to be learned.
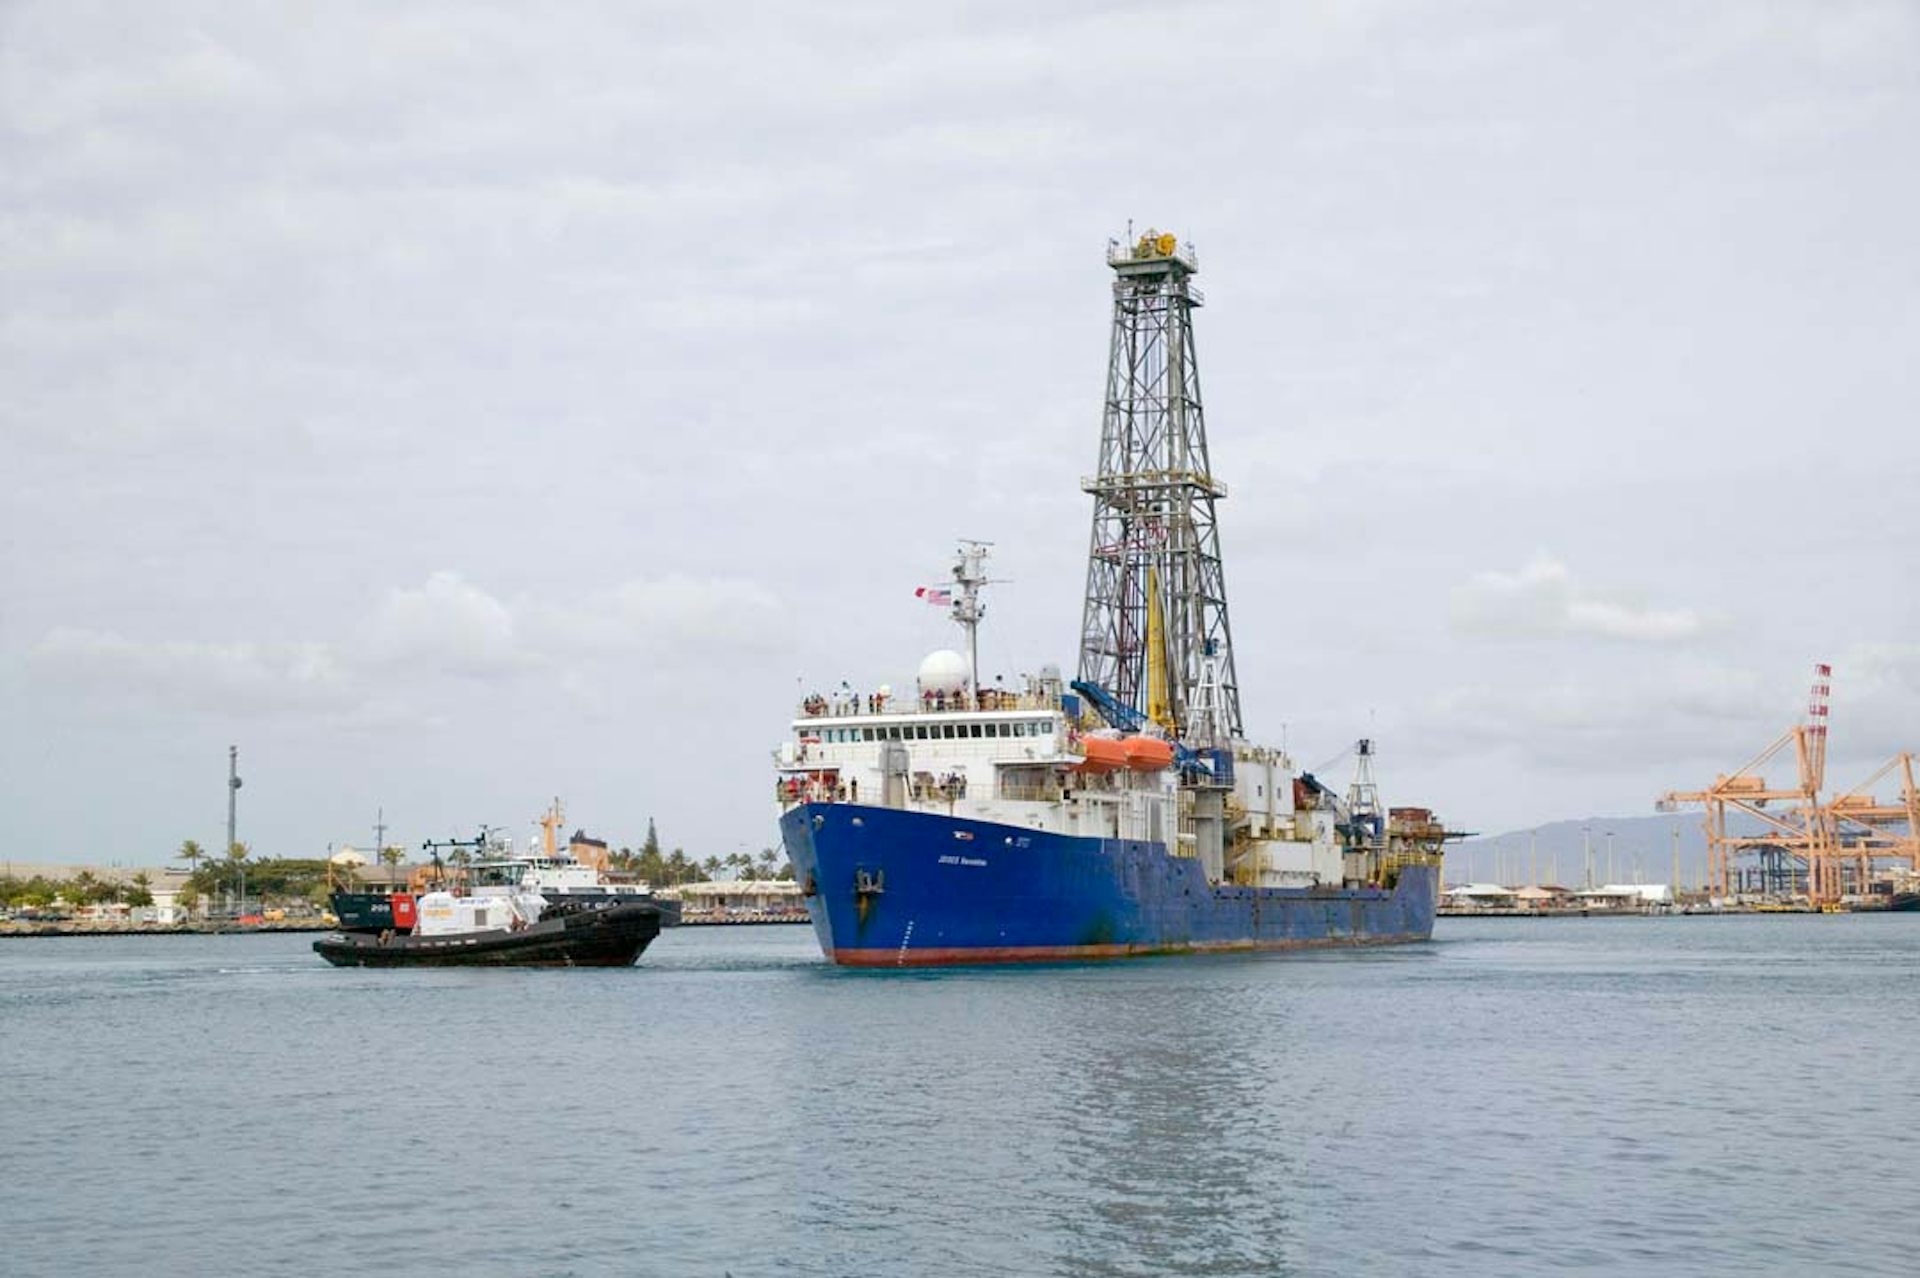
The scientific drilling ship JOIDES Resolution arrives in Honolulu after
successful sea trials and testing of scientific and drilling equipment.
IODP
Technological innovations
Two key innovations made it possible for research ships to take core samples from precise locations in the deep oceans.
The first, known as dynamic positioning, enables a 471-foot ship to stay fixed in place while drilling and recovering cores, one on top of the next, often in over 12,000 feet of water.
Anchoring isn’t feasible at these depths.
Instead, technicians drop a torpedo-shaped instrument called a transponder over the side.
A device called a transducer, mounted on the ship’s hull, sends an acoustic signal to the transponder, which replies.
Computers on board calculate the distance and angle of this communication.
Thrusters on the ship’s hull maneuver the vessel to stay in exactly the same location, countering the forces of currents, wind and waves.
Another challenge arises when drill bits have to be replaced mid-operation.
The ocean’s crust is composed of igneous rock that wears bits down long before the desired depth is reached.
When this happens, the drill crew brings the entire drill pipe to the surface, mounts a new drill bit and returns to the same hole.
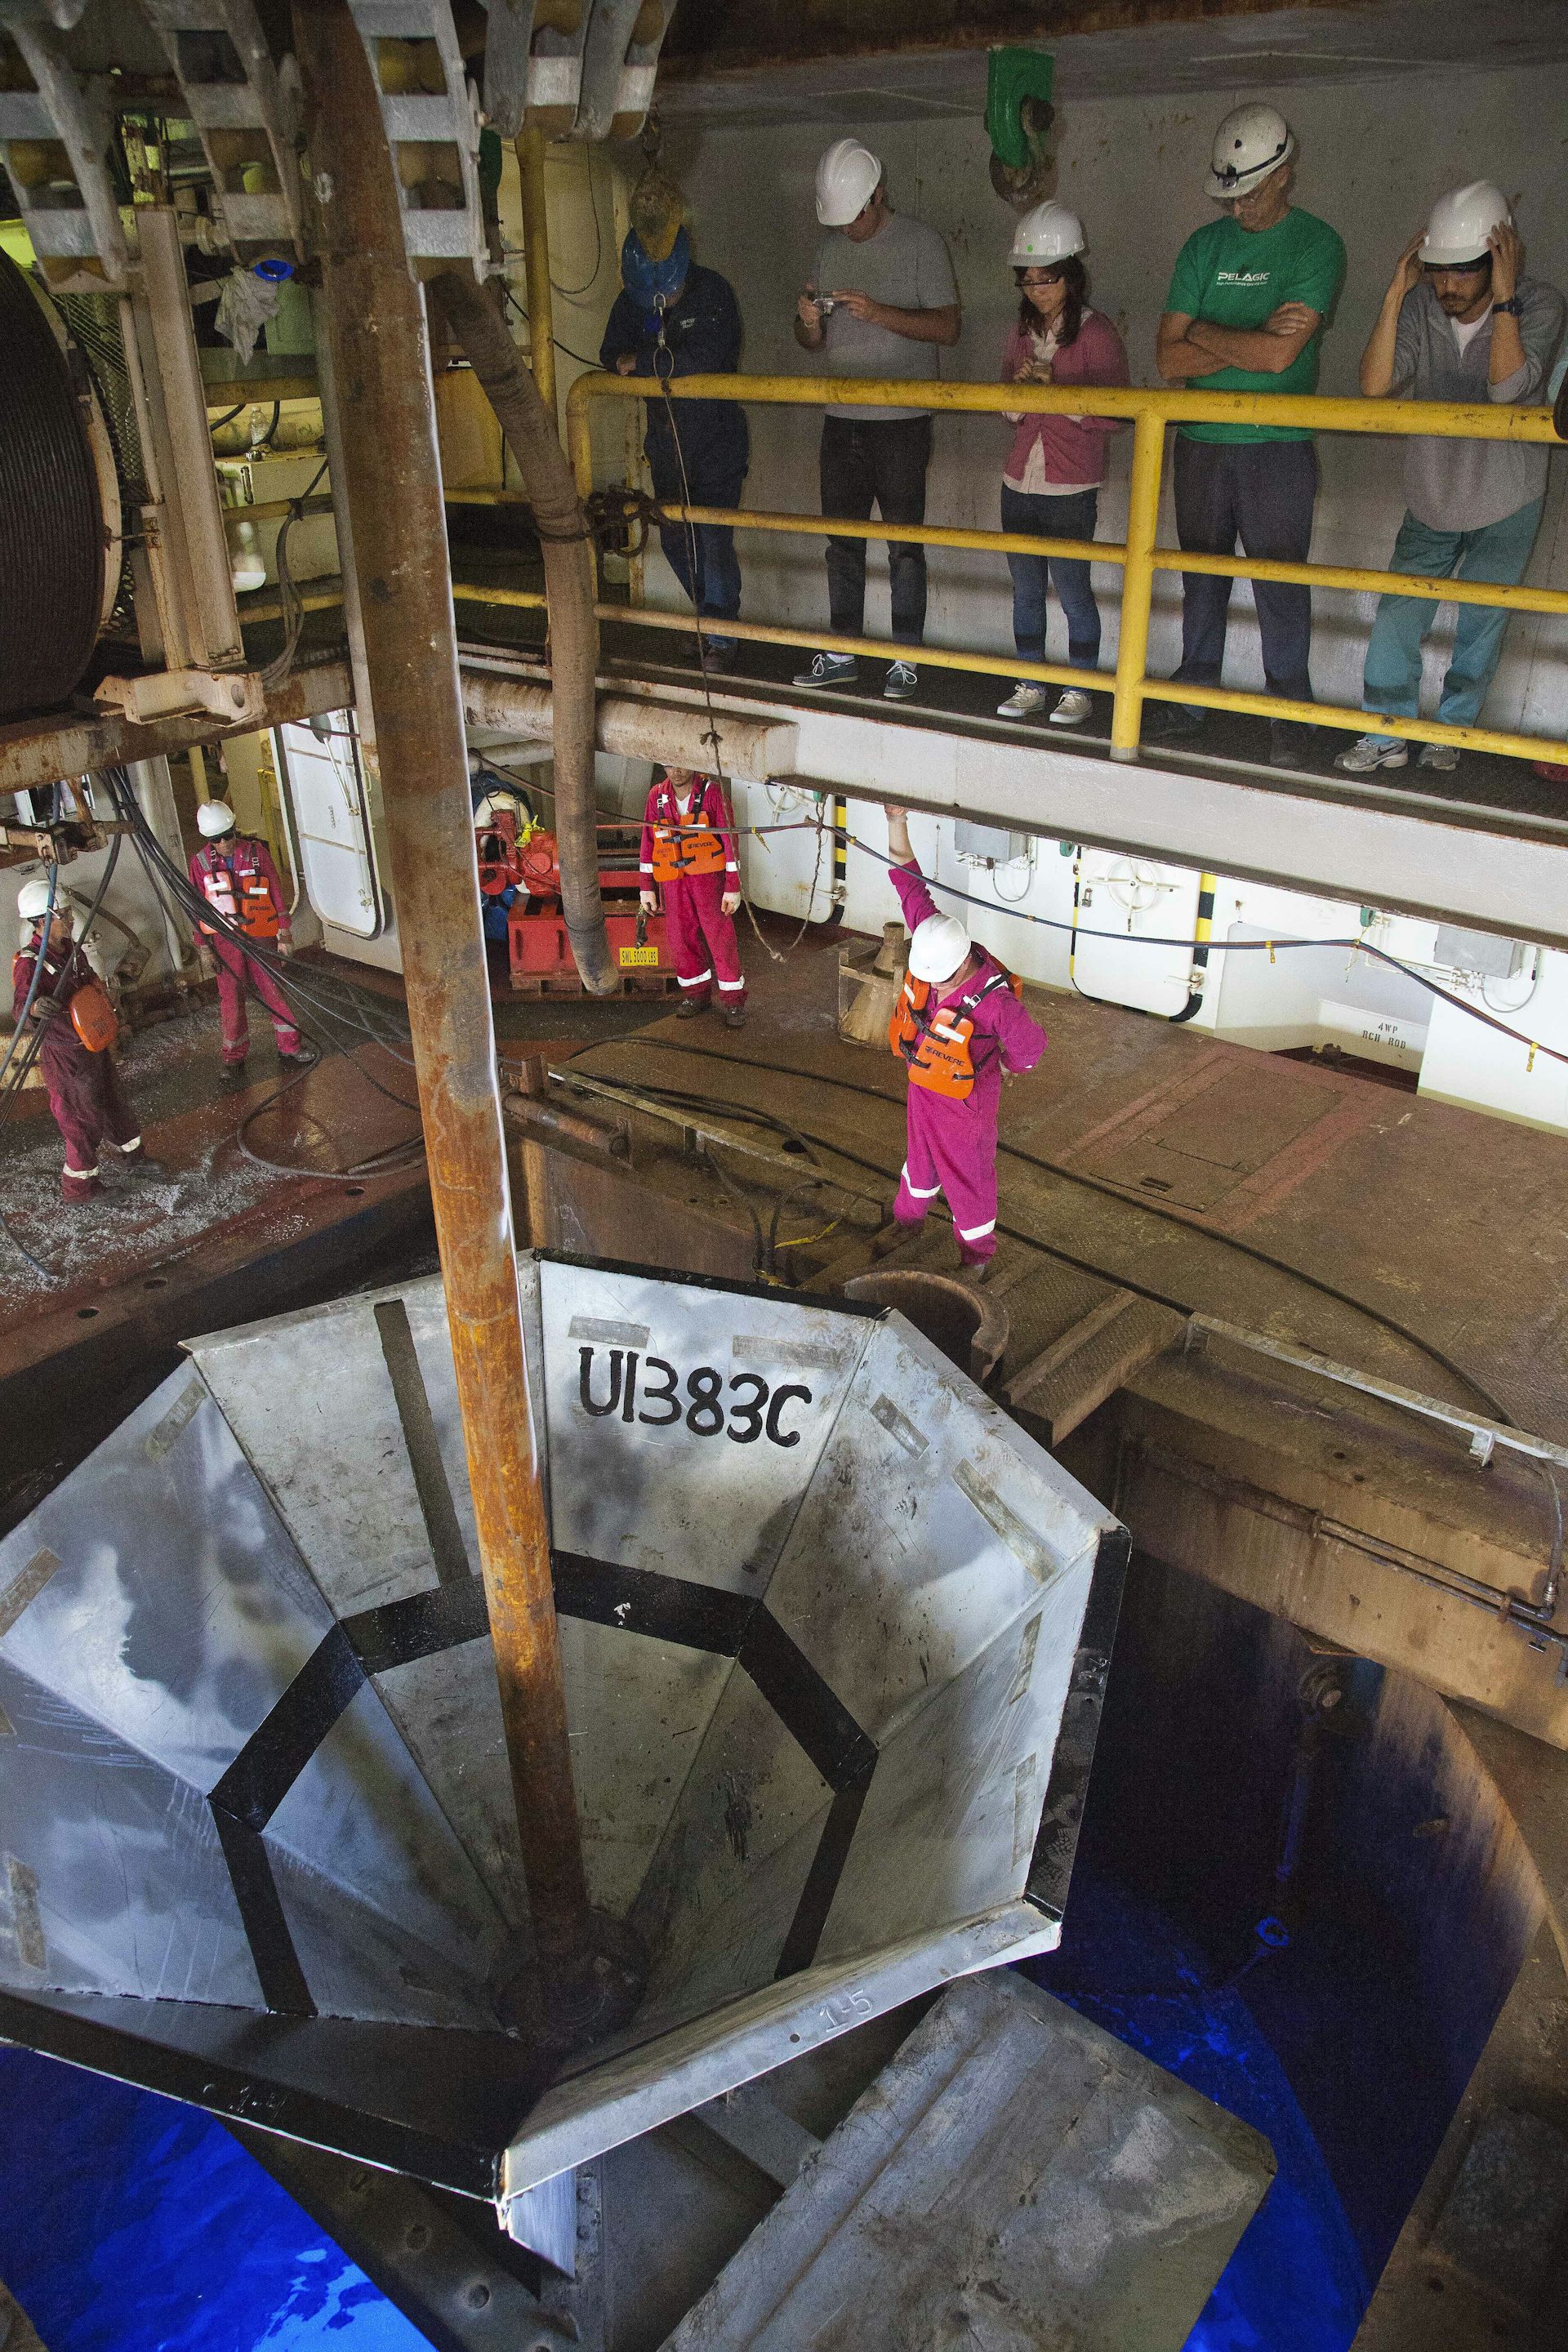
This requires guiding the pipe into a funnel shaped re-entry cone, less than 15 feet wide, placed in the bottom of the ocean at the mouth of the drilling hole.
The process, which was first accomplished in 1970, is like lowering a long strand of spaghetti into a quarter-inch-wide funnel at the deep end of an Olympic swimming pool.
The re-entry cone is welded together
around the drill pipe, then lowered down the pipe to guide reinsertion
before changing drill bits.
IODP
When scientific ocean drilling began in 1968, the theory of plate tectonics was a subject of active debate.
One key idea was that new ocean crust was created at ridges in the seafloor, where oceanic plates moved away from each other and magma from earth’s interior welled up between them.
According to this theory, crust should be new material at the crest of ocean ridges, and its age should increase with distance from the crest.
The only way to prove this was by analyzing sediment and rock cores.
In the winter of 1968-1969, the Glomar Challenger drilled seven sites in the South Atlantic Ocean to the east and west of the Mid-Atlantic ridge.
Both the igneous rocks of the ocean floor and overlying sediments aged in perfect agreement with the predictions, confirming that ocean crust was forming at the ridges and plate tectonics was correct.
Part of a core section from the Chicxulub impact
crater.
It is suevite, a type of rock, formed during the impact, that
contains rock fragments and melted rocks.
Reconstructing earth’s history
The ocean record of Earth’s history is more continuous than geologic formations on land, where erosion and redeposition by wind, water and ice can disrupt the record.
In most ocean locations sediment is laid down particle by particle, microfossil by microfossil, and remains in place, eventually succumbing to pressure and turning into rock.
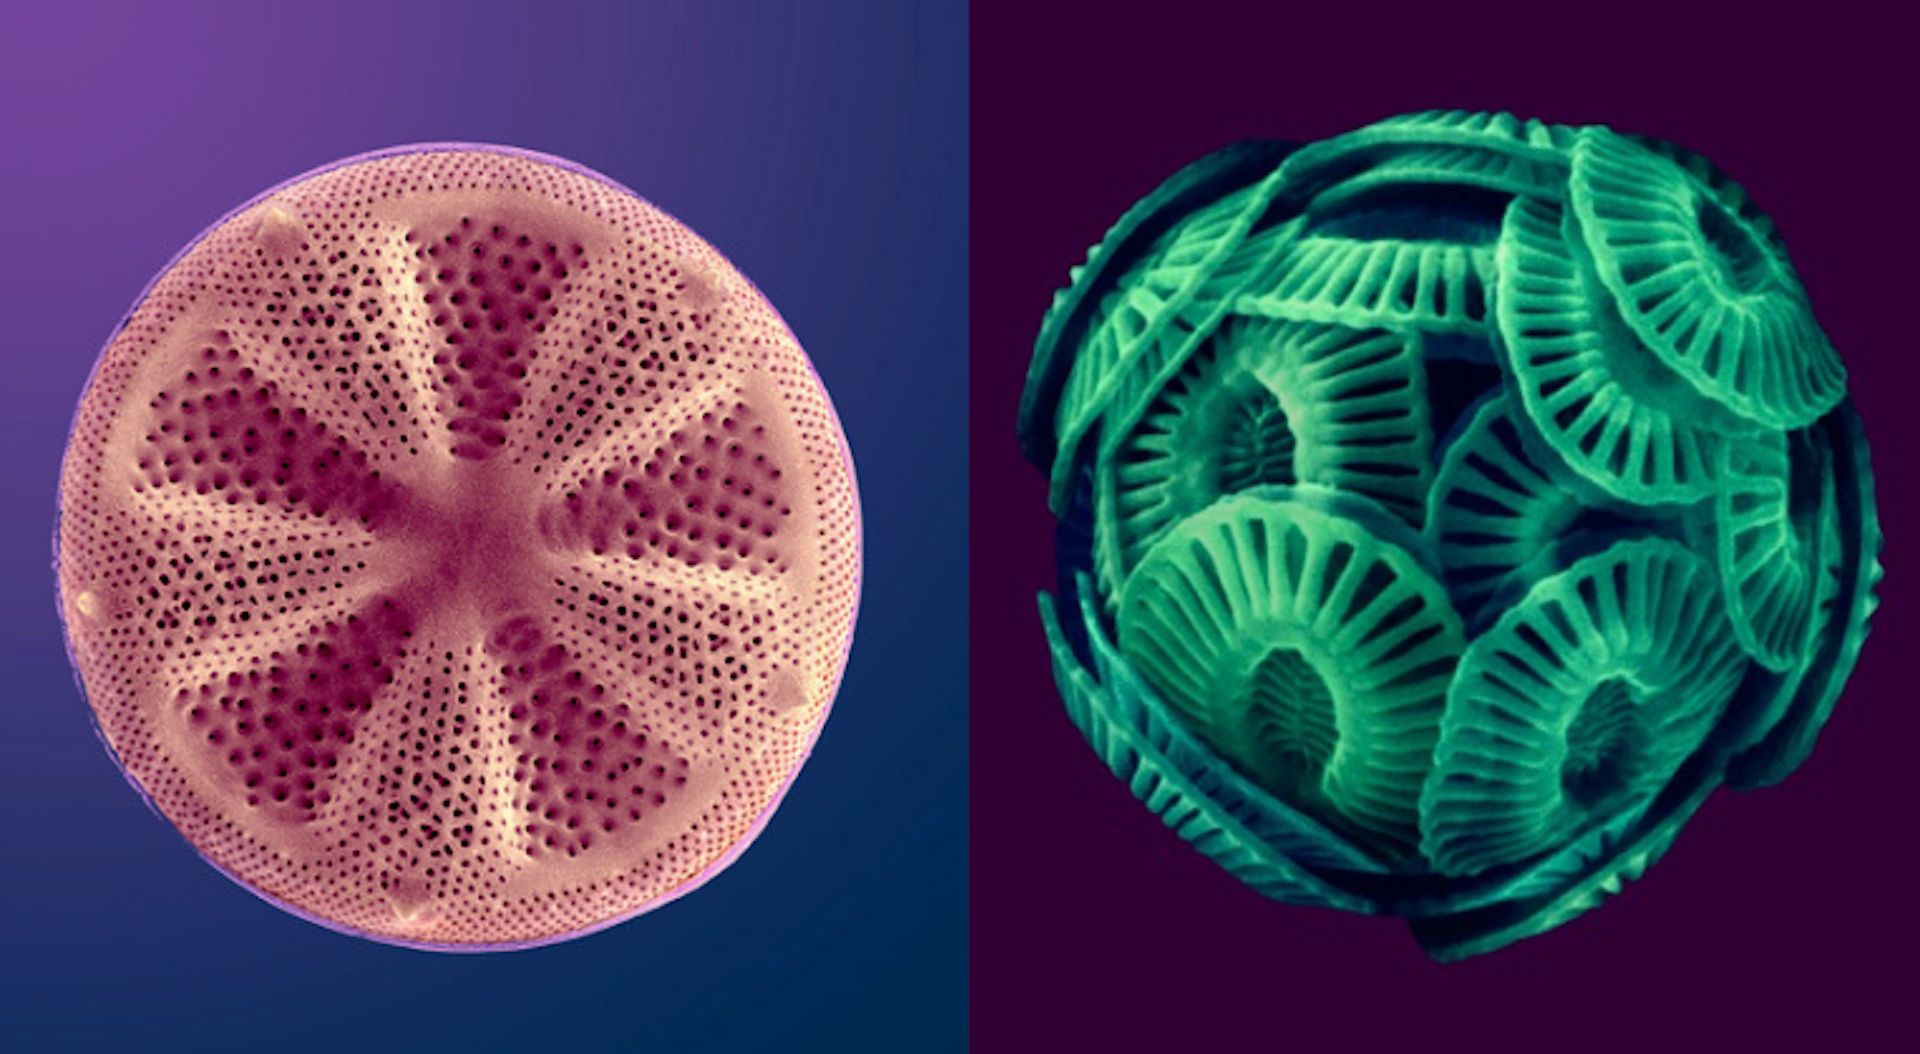
Microfossils (plankton) preserved in sediment are beautiful and informative, even though some are smaller than the width of a human hair.
Like larger plant and animal fossils, scientists can use these delicate structures of calcium and silicon to reconstruct past environments.
Thanks to scientific ocean drilling, we know that after an asteroid strike killed all non-avian dinosaurs 66 million years ago, new life colonized the crater rim within years, and within 30,000 years a full ecosystem was thriving.
A few deep ocean organisms lived right through the meteorite impact.
Ocean drilling has also shown that ten million years later, a massive discharge of carbon – probably from extensive volcanic activity and methane released from melting methane hydrates – caused an abrupt, intense warming event, or hyperthermal, called the Paleocene-Eocene Thermal Maximum.
During this episode, even the Arctic reached over 73 degrees Fahrenheit.
The resulting acidification of the ocean from the release of carbon into the atmosphere and ocean caused massive dissolution and change in the deep ocean ecosystem.
This episode is an impressive example of the impact of rapid climate warming.
The total amount of carbon released during the PETM is estimated to be about equal to the amount that humans will release if we burn all of Earth’s fossil fuel reserves.
Yet, an important difference is that the carbon released by the volcanoes and hydrates was at a much slower rate than we are currently releasing fossil fuel.
Thus we can expect even more dramatic climate and ecosystem changes unless we stop emitting carbon.
Enhanced scanning electron microscope images of phytoplankton (left, a diatom; right, a coccolithophore).
Different phytoplankton species have distinct climatic preferences, which makes them ideal indicators of surface ocean conditions. (Dee Breger)
Scientific ocean drilling has also shown that there are roughly as many cells in marine sediment as in the ocean or in soil.
Expeditions have found life in sediments at depths over 8000 feet; in seabed deposits that are 86 million years old; and at temperatures above 140 degrees Fahrenheit.
Today scientists from 23 nations are proposing and conducting research through the International Ocean Discovery Program, which uses scientific ocean drilling to recover data from seafloor sediments and rocks and to monitor environments under the ocean floor.
Coring is producing new information about plate tectonics, such as the complexities of ocean crust formation, and the diversity of life in the deep oceans.
This research is expensive, and technologically and intellectually intense.
But only by exploring the deep sea can we recover the treasures it holds and better understand its beauty and complexity.
Links :
- Houston Chronicle : Rolling back these offshore drilling measures would be a grave error ..
- Independant Online : Drilling threat to marine organisms
- National Geographic : The Race Is On to Mine the Deep Sea—But Scientists Are Wary
- Popular Science : Future offshore drilling could wreak havoc on deep sea ecosystems
Wednesday, September 26, 2018
Harsh climate: The struggle to track global sea level rise
How scientists know our seas are rising faster ?
Although it may not be immediately obvious when we visit the beach, sea-level rise is affecting coastlines all over the world.
Although it may not be immediately obvious when we visit the beach, sea-level rise is affecting coastlines all over the world.
For low-lying countries such as the Netherlands, sea-level rise and tidal surges are a constant threat. Our oceans are rising as a consequence of climate change.
As the temperature of seawater increases it expands and the ice melting from ice sheets and glaciers adds more water to the global ocean.
We know this because satellites high above our heads measure the temperature of the sea surface and of our changing ice.
While the global averaged trend is towards rising levels, there are many regional differences so that in some places it is rising and in other places it is falling.
Satellites carrying altimeter instruments systematically measure the height of the sea surface so that sea-level rise can be closely monitored.
Altimetry measurements over the last 25 years show that on average sea-level is rising about 3 mm a year and this rise is accelerating.
From Reuters by Lucas Jackson & Elizabeth Culliford
A loud rumble jolted climate scientist David Holland just before he went to sleep inside his fiberglass bear-resistant dome, set up next to a frozen fjord in Greenland.
He scrambled outside into the sunlit night at about 11 p.m.
The thundering sound grew louder as he watched a chunk of ice about a third the size of Manhattan break away from the Helheim glacier.
Over the next half hour, the iceberg cracked into pieces and tumbled into the water — a mesmerizing sighting of the sea level rise that Holland has devoted years to studying.
Such major glacial ruptures, known as calvings, are rarely observed in person.
A Reuters photographer captured the event on video as Holland, a New York University oceanographer, took in the “absolutely breathtaking” scene.
“It’s just amazing how beautiful nature is, how violent and unstoppable; it just does its own thing,” he said.
“We actually saw the process by which sea level rises from glaciers.”
Meltwater pools are seen on top of the Helheim glacier near Tasiilaq, Greenland, June 19, 2018.
(Lucas Jackson / Reuters)
Now Holland and other climate scientists just have to figure out how — and how fast — warming oceans are undermining the glaciers of Greenland and Antarctica.
The best predictions for sea-level rise this century are getting more dire, and yet less precise, in part because of a lack of understanding of these glaciers and how their behavior fits into global climate modeling
A key obstacle to producing better predictions is the extreme difficulty of the research, which requires dangerous field work in some of the world’s harshest terrain.
Researchers must contend with winds strong enough to sweep away bolted-down equipment; temperatures that can freeze skin on contact; and remote locations that make securing supplies a steep challenge.
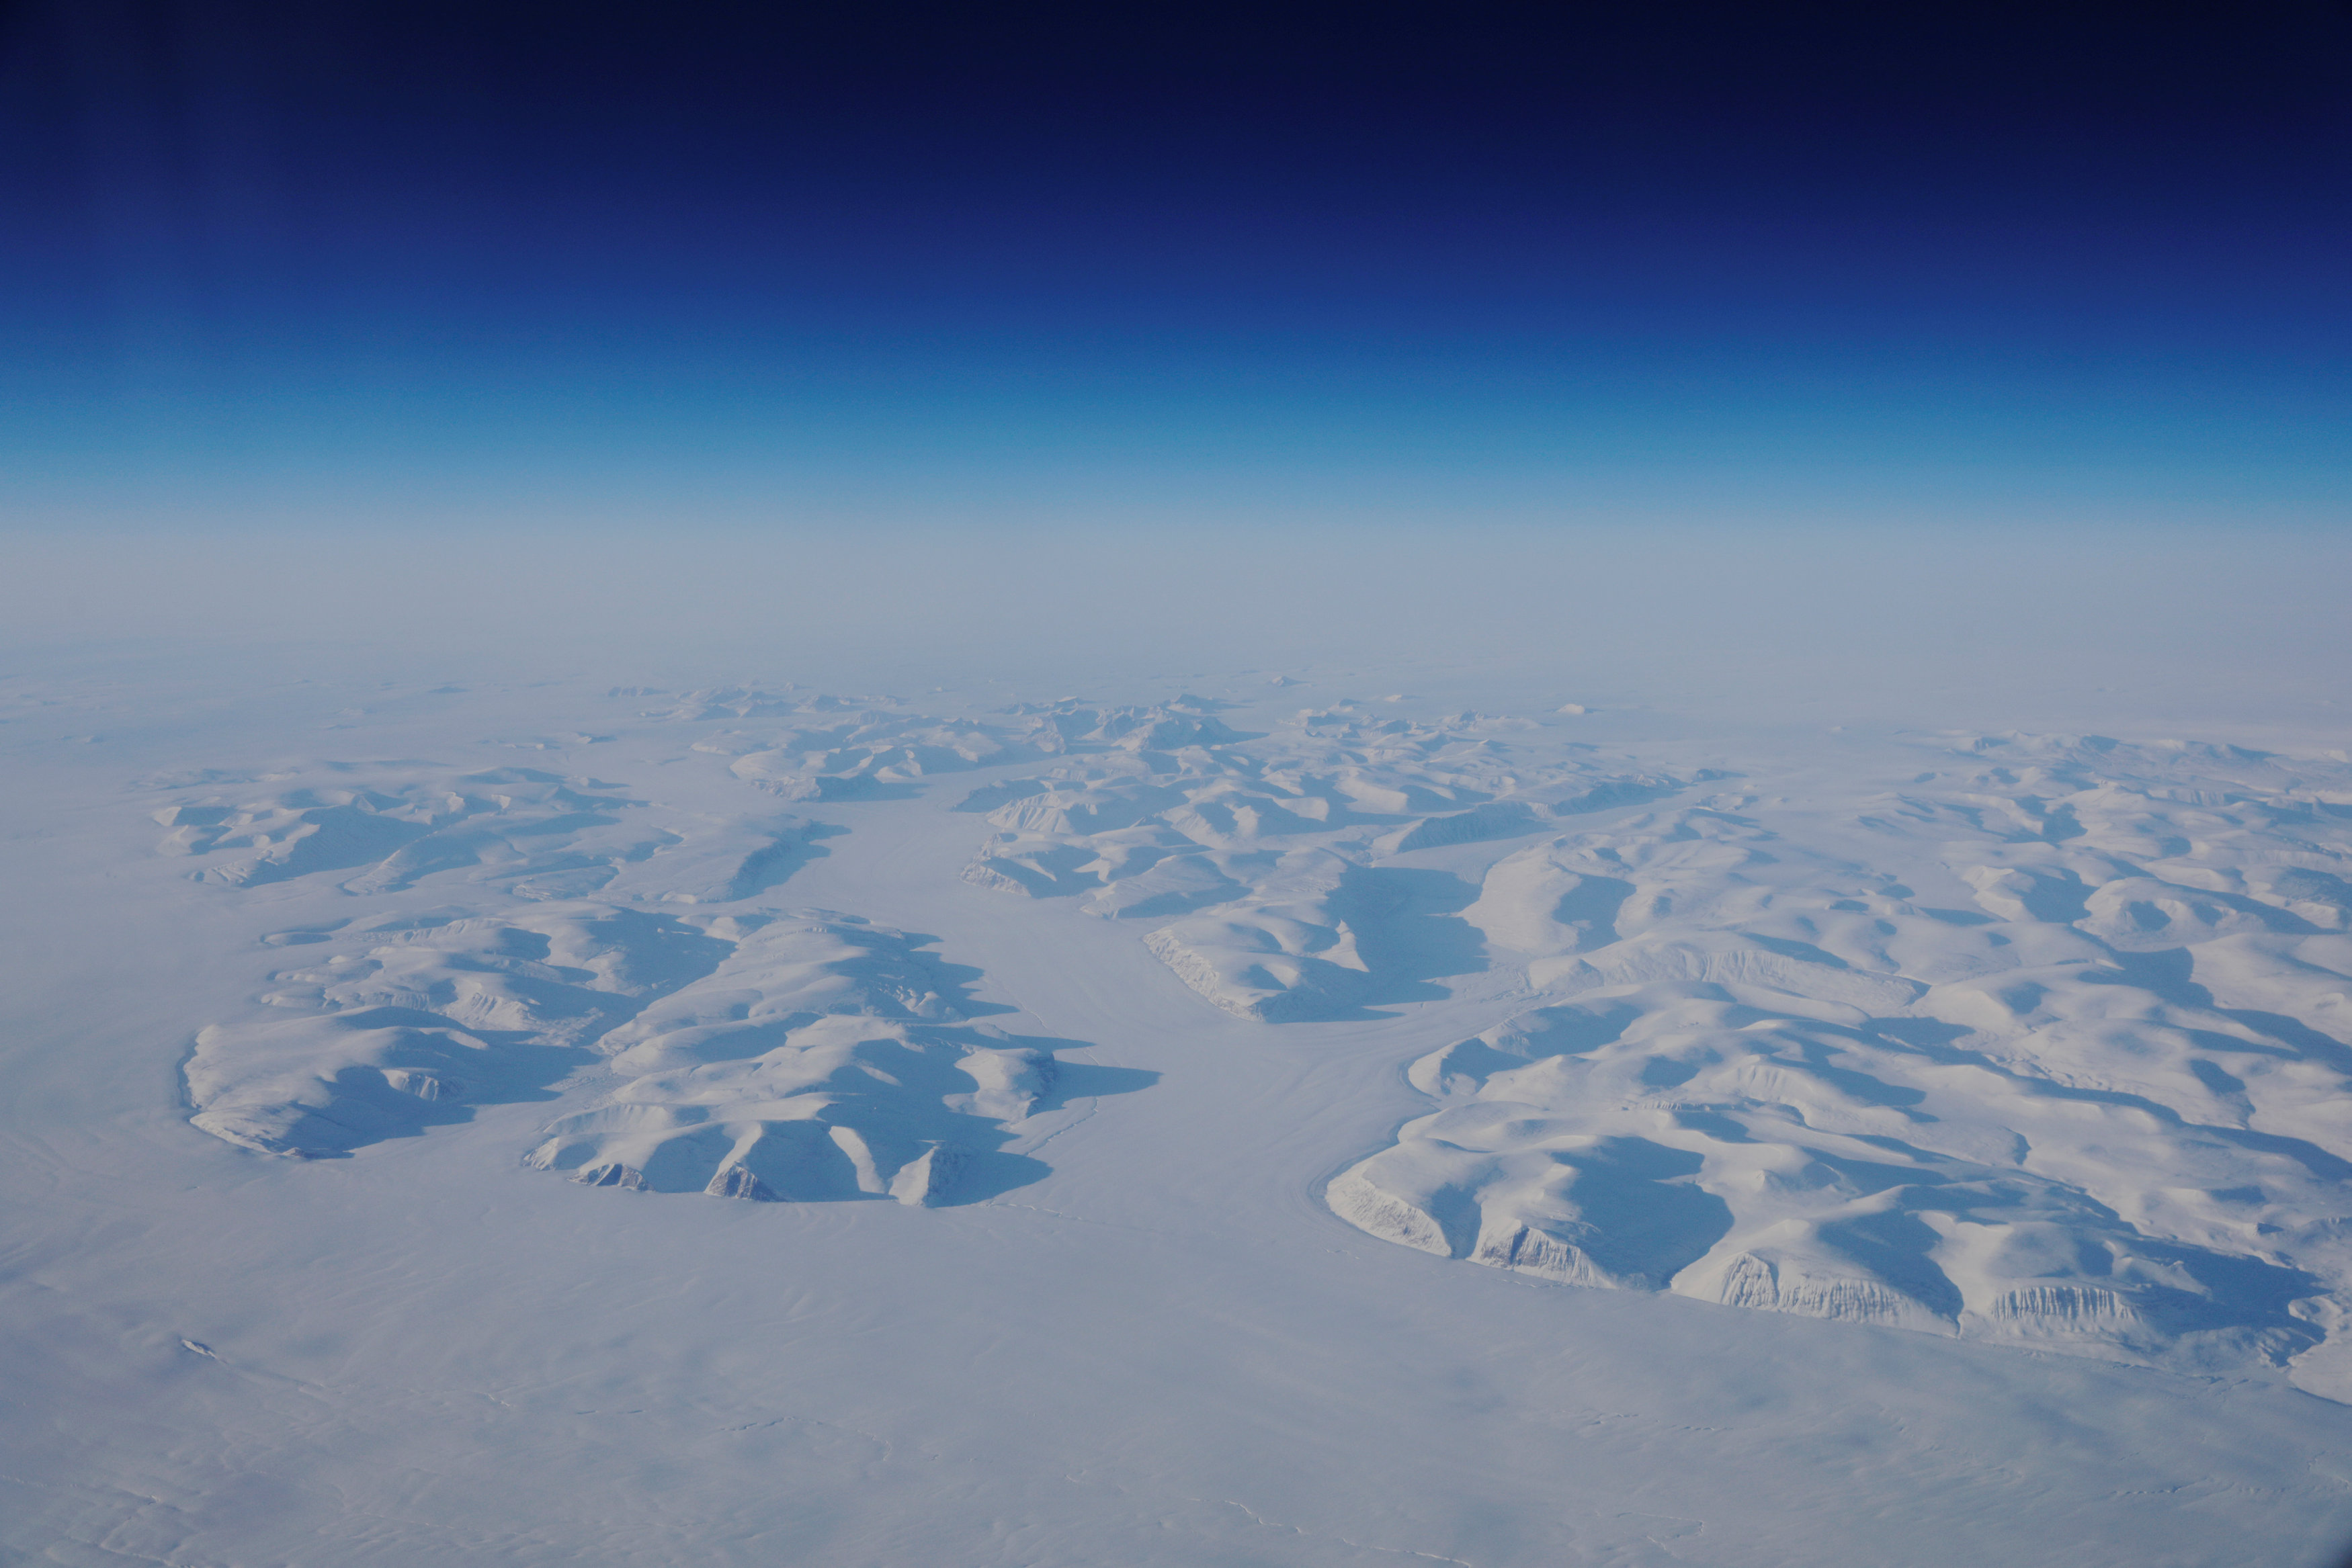
Glacial ice is seen from the window during a NASA flight to support the Oceans Melting Greenland (OMG) research mission above the east coast of Greenland, March 13, 2018.
(Lucas Jackson / Reuters)
Security teams help scientists avoid falling into hidden crevasses, and, in the Arctic, teams arm themselves with rifles and sleep in fiberglass shelters to avoid becoming a meal for polar bears.
The challenges of data collection also require a host of creative solutions that scientists are refining through trial and error.
A NASA team that is now three years into a five-year, $30 million project called Oceans Melting Greenland (OMG) has used radar to map changes in the sheet’s ice loss over time by returning each year to fly the same precise path; dropped probes from planes to measure water temperature and salinity at various depths; and mounted sonar instruments to ships to map the topography of the ocean floor.
The difficulties and dangers in accessing the ice-choked waters near Greenland’s glaciers caused some researchers to enlist the help of local wildlife by tagging seals, halibut or narwhals with sensors to gather data.
NASA researchers and Holland are focused on Greenland because it currently contributes more to sea level rise than the colder region of Antarctica — and because the research is so much harder in the Antarctic, with its punishing climate, massive scale and logistical challenges.
An iceberg floats in a fjord near the town of Tasiilaq, Greenland.
Reuters/Lucas Jackson
“It’s mind-boggling how difficult it is to do things in Antarctica,” said Holland, who has conducted studies in both regions.
“Work that can be done here in Greenland on the scale of summer takes five to ten years to set up and accomplish in Antarctica.”
$20,000 bolt
Scientists worry that the calving process underway at Helheim - named for the Vikings’ world of the dead - provides a preview of what might happen in Antarctica on a larger scale.
Another Greenland glacier called Jakobshavn has seen similar calving events.
In both polar regions, field researchers face serious hazards.
Bad weather can strand researchers for weeks and hidden dangers can lurk beneath the snow.
In 2016, Holland’s colleague Gordon Hamilton, a U.S.
climate scientist, was killed in Antarctica when his snowmobile plunged into a crevasse.
The job of keeping Holland’s team safe belongs to Brian Rougeux, a former mountaineering guide who has worked in both polar regions.
Rougeux, who originally met Holland in 2010 in Antarctica, where Holland was servicing weather stations, said sudden changes in weather and visibility in Antarctica can sometimes be life-threatening.
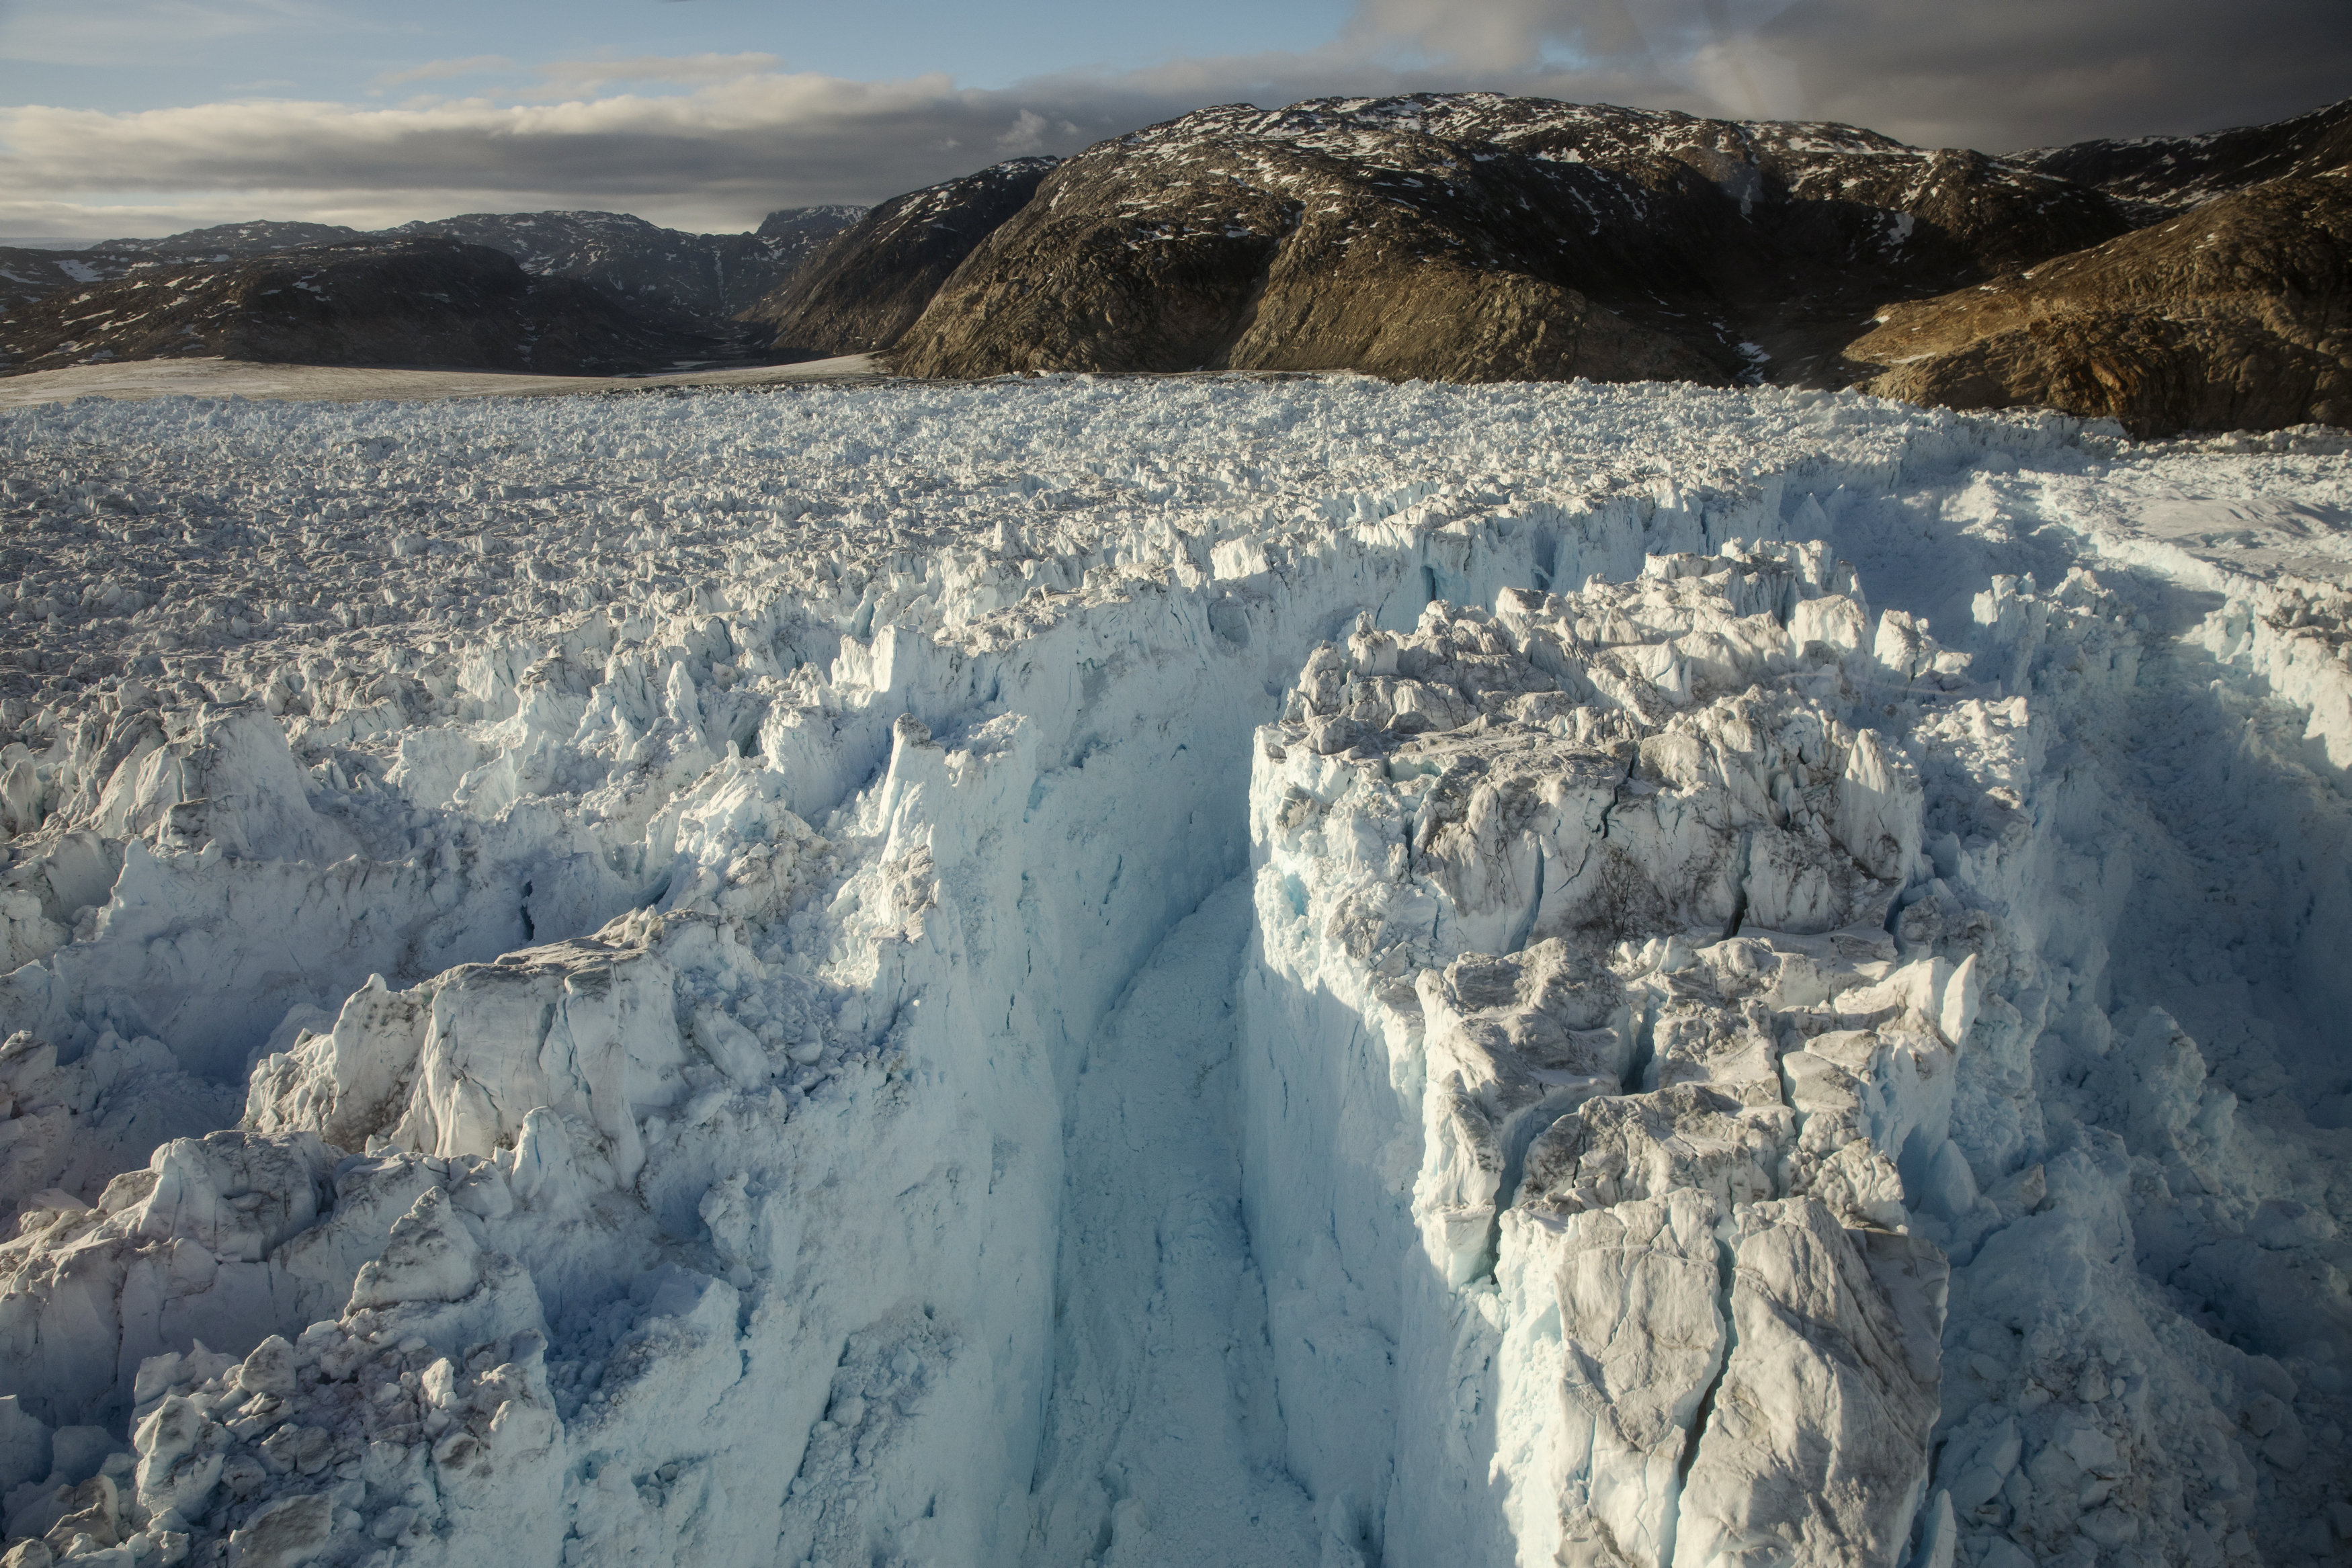
A large crevasse forms near the calving front of the Helheim glacier near Tasiilaq, Greenland, June 22, 2018.
(Lucas Jackson / Reuters)
“You’re trying to navigate to a tent in the middle of half a million square miles of flat white, with no real terrain features,” Rougeux said.
GPS can help, but could lead teams into areas with hidden crevasses.
Preparation is key to efficiency as well as safety.
“Going back to town to get a particular bolt takes $20,000 of helicopter time, so it becomes a pretty expensive bolt,” Holland said.
The research challenges often persist after researchers return home from the field.
The data-gathering tools they leave in place — from moorings that monitor oscillating water temperatures to radars encased in 10-foot-tall, egg-like protective shells that take images of melting ice — are vulnerable to the elements.
A buoy collecting ocean data for Holland’s team in Greenland was swept away by powerful currents and eventually surfaced on a beach in Scotland, and powerful winds swept away other equipment they had bolted in place.
An average sea level rise of 3.1 millimeters (0.12 inches) per year might not sound like much.
But it’s about 30 centimeters (about a foot) over a century.
In
recent years, the rate of rise has been more like 5 millimeters per
year. Image is a still captured from the video above, via ESA.
Help from the locals
Sometimes conditions are so brutal that researchers need to enlist the experts: local wildlife.
In the Ilulissat fjord in western Greenland, Holland’s team uses native ringed seals fitted with sensors to record depth, temperature, and salinity year-round near the Jakobshavn, the island’s fast-flowing river of ice.
They relied on seals because it was too dangerous to pilot a boat through the icy waterway near the glacier, which is believed to have produced the iceberg that sank the Titanic.
“It is difficult to find a way that a robot made by an engineer could do anything similar to what a seal can do,” said Holland.
A female narwhal surfaces in an open area surrounded by sea ice in
western Greenland March 30, 2012.
Photo courtesy of Kristin
Laidre/Handout via Reuters
Holland had teamed up with a local seal biologist, Aqqalu Rosing-Asvid, a former hunter and fisherman.
In 2010, they camped out on Greenland’s west coast for a week, but caught no seals.
It was not until their next attempt two years later that they finally tagged their first seal.
They also use halibut because their deeper swimming helps monitor the water column nearest the seafloor.
The team only tagged fish caught during the warmest days of the fishing season to prevent their eyes from immediately freezing in the cold.
The team relies on fishermen to retrieve the data: Rosing-Asvid’s phone number is on the fish tags.
“The fishermen call me on the phone, and we arrange to send the tag here,” he explained.
Last year, three out of the 20 halibut sensors made it back.
Another animal pressed into research in the Arctic is the narwhal, an elusive whale with a tusk protruding from the male’s head.
Marine biologist Kristin Laidre, of the Polar Science Center at the University of Washington, has in the past netted narwhals in order to pin a satellite tag to their dorsal ridge “like an earring.”
Laidre shared the narwhals’ depth, temperature and salinity readings with the NASA team, important because warmer, saltier Atlantic waters tend to sit below colder, fresher waters off the coast of Greenland.
Glaciers connected to the deeper waters are melting at faster rates.
“Even today, there are some places where we still don’t know how deep the water is,” said Josh Willis, lead scientist for NASA’s OMG project.
The tagging “gives us an idea that the water in some spots is at least as deep as a nearby narwhal dive.”
Links :
- Reuters : Graphic: Project Greenland series on climate change
- Reuters : Greenland and the hunt for better climate science
- National Geographic : The big thaw
Tuesday, September 25, 2018
Guilt-Free on the Sea? How Norway is using oil and gas riches to engineer a future in emission-free seafaring
Norway’s newest ships, including the passenger vessel Future of the Fjords, may portend the end of carbon-belching vessels.
Of the 60 or so fully electric or hybrid vessels in operation globally, 40 percent are Norwegian.
Photo by Peter Tubaas/NCE Maritime CleanTech
From HakaiMag by Paul Kockenos
How Norway is using oil and gas riches to engineer a future in emission-free seafaring.
Western Norway’s rustic port village of Flåm, a remote goat-farming hamlet and summer escape set deep among the region’s icy fjords and towering, snow-capped peaks, seems an unlikely launch site for the future of sustainable nautical travel.
Fjords north of Aurlandsfjord with the GeoGarage platform (NHS chart)
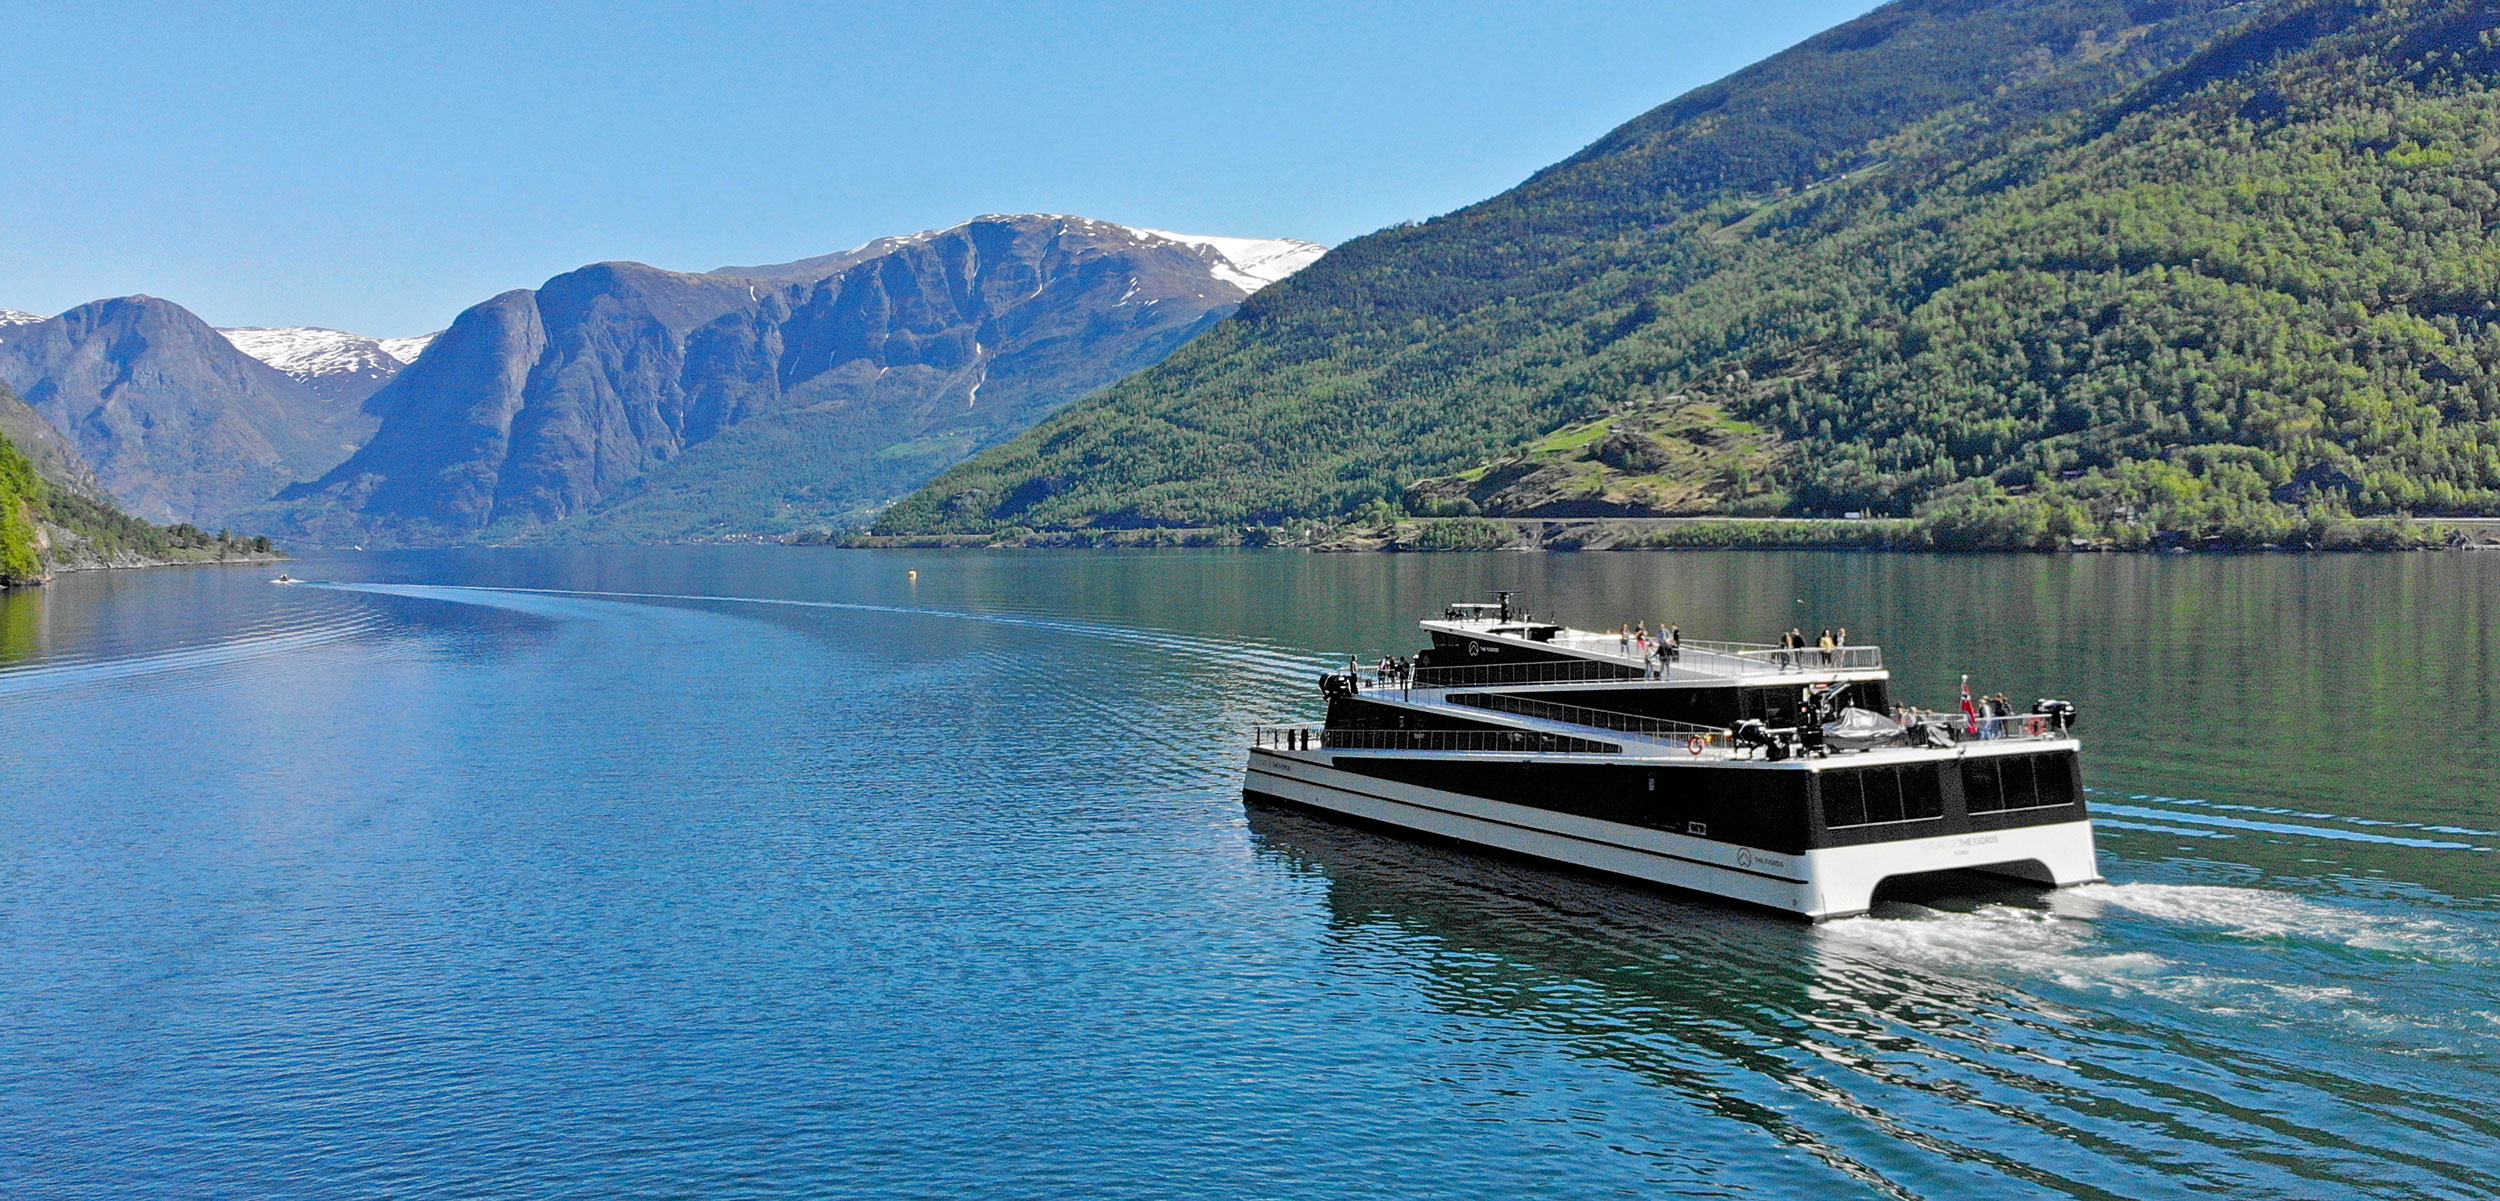
But, in the form of a sleek, black-and-white, 42-meter catamaran anchored in the village’s tiny harbor at the end of the glimmering Aurlandsfjord, the future has already arrived.
The mint condidtion vessel with raised dual hulls is joined to the quay by a cable plugged into a delivery-van-sized aluminum cargo container, which houses 5,500 kilograms of batteries.
Otherwise, nothing announces the curious boat as a pioneer of the next generation of seafaring, save for the neat block lettering on its bow: Future of the Fjords.
The zero-emission, battery-powered Future of the Fjords, fabricated out of ultra-lightweight carbon fiber, recently began carrying as many as 400 sightseers at a time through some of Norway’s most jaw-dropping fjords.
The Future, as its crew calls it, is Norway’s latest, most auspicious design in climate-friendly sea travel—part of a bold initiative that could revolutionize the global cruising and shipping industries, egregious emitters of greenhouse gases.
By eliminating the oversized carbon footprint of seafaring vessels, Norway and other shipping nations can dramatically curb carbon emissions, claim Norwegian scientists and clean-tech entrepreneurs.
Simultaneously, electricity-propelled vessels will reduce noxious air pollution in busy harbors.
A dreamliner among ferries, this carbon fibre hybrid electric ship called the Vision of the Fjords will make sure Norway's natural treasures stay pristine for future generations.
The country has ruled that by 2026, access to its two fjord areas classified as World Heritage Sites, which includes part of the Aurlandsfjord, will be restricted to zero-emission vessels.
Four years later, Norway will begin restricting other fjords and Norwegian waters to ships with low- or zero-emission technology.
Norway is already on track to turn much of its ferry fleet electric; the first batch of 63 new ferries is in production.
Throughout the country’s windswept western archipelagos, other craft—fishing boats, supply vessels, research ships, yachts, tugboats—are switching from traditional diesel-fueled combustion engines to electric propulsion, a prospect that just a few years ago sounded fantastical.
Experts say Norway’s innovations in green seafaring portend the transformation of most small- and medium-sized ships.
Engineers are currently working on expanding emission-free technology to the world’s biggest vessels, including cruise liners, which require significantly greater voltage and will go green much more slowly and in stages, at first in hybrid form.
The islands on Norway’s coast now host so many clean-tech start-ups that the area has been called Norway’s Silicon Valley.
The small firms design hardware such as propeller blades and lightweight hulls for electric ships and engineer the world’s most advanced charging technology, while workers at historical shipyards assemble the components into seaworthy vessels.
Six years ago, the Norwegian government began to plug funding into these pilot projects to determine the feasibility of reducing emissions in nautical travel.
The results of the test projects triggered a full-blown epiphany: alternatives to emission-heavy nautical travel are less complex and costly than anyone thought.
“The Norwegians are ahead on clean shipping,” Felix Selzer, an editor of Hansa, an international maritime journal based in Germany, says during a media tour a week before the Future’s official launch.
“And they’re acting fast to capitalize on it.
They’re changing the equation in the industry.”
The dark irony is that funding for Norway’s costly clean-energy projects is garnered indirectly from the revenues of the country’s sprawling oil and gas fields in the North Sea.
Norway, Europe’s largest petroleum producer after Russia, exports almost all of its reserves, supplying the European Union with about 25 percent of its gas demand.
This is one reason the state can fund the annual NOK 2.7-billion (US $320-million) budget of the Ministry of Climate and Environment’s development agency, known as Enova.
And that’s just one pot of government money available for clean-tech advances.
Around Kristiansund, Geiranger, Sognefjord, Briksdalbre, Aurland.
In the coming years, access to Norway’s iconic fjords may be limited to zero- or low-emission ships.
In the coming years, access to Norway’s iconic fjords may be limited to zero- or low-emission ships.
A scathing 2018 report published by several environmental groups claimed: “There is significant cognitive dissonance as [Norway] fails to address the impact of its oil and gas extraction … and indeed undermines global efforts to reduce emissions.”
The petroleum Norway exports represents 10 times the quantity of greenhouse gas emissions that the country produces itself—much of it emitted through the shipping industry.
Maritime technology, in Norway as elsewhere, has been much slower to turn to clean energy than the automotive sector.
Until very recently, a powerful lobby—in the form of the International Maritime Organization (IMO), a United Nations agency responsible for regulating shipping—had assiduously protected the global shipping industry from regulations to reduce carbon emissions.
The industry, which includes roughly 100,000 commercial oil tankers, bulk carriers, cargo ships, cruise liners, and container ships, runs much of its heavy-duty fleet on the notoriously polluting heavy fuel oil.
Shipping’s bunker fuels are essentially the low-grade (and thus inexpensive) waste products from the oil refining process.
Shipping bears responsibility for two to three percent of global CO₂ emissions.
In 2015, if treated as a country, the international shipping industry would have been the sixth largest emitter of CO₂ in the world—bigger even than Germany.
It will be belching out nearly a fifth of all emissions by 2050 if the sector isn’t cleaned up, experts say.
Because of resistance by the IMO, shippers and cruise companies managed to duck inclusion in the 2015 Paris climate accord, infuriating environmentalists.
Earlier this year, however, in the face of fierce pressure from the European Union, the global maritime industry finally set modest goals for decarbonization.
These included promises to explore battery-electric technology as well as alternative fuels and hydrogen power.
Though heavy-duty tankers, freighters, and jumbo cruise liners won’t go completely green overnight, the industry has pledged to bring down greenhouse gas emissions by at least 50 percent by 2050 (compared to 2008 levels).
So as other countries are now forced to consider clean-shipping initiatives, Norway is fathoms ahead in the race.
Shipping’s carbon footprint, as sinful as it is, almost seems benign when compared to the other pollutants that come from the industry’s fuels of choice.
Scientists say shipping is one of the largest emitters of sulfur, which causes respiratory problems and acidifies fragile ecosystems.
Heavy fuel oil contains 3,500 times more sulfur dioxide than diesel used in cars.
The vessels also discharge high concentrations of nitrogen oxides, highly carcinogenic components of smog.
Norwegian environmentalists say cruise liners have defiled many of the most popular fjords, which have always been reputed for their “pristine” natural beauty.
During harbor visits, the mammoth engines run on low throughout the day, blanketing port villages with smog.
Twelve years ago, the Norwegian Institute for Air Research rang the alarm bell with a damning report on the fjords’ inferior air quality.
The exposé shocked the Norwegian pubic.
Nevertheless, since then, the number of cruise visitors to Norway, a country of 5.2 million, has more than doubled, reaching almost 700,000.
Until now, there have been few alternatives for visitors keen on viewing the majestic byproducts of the last ice age but to sail on the soot-spewing cruise ships—including the storied Hurtigruten fleet, a Norwegian icon that has sailed the coastal route to the Arctic Circle since 1893—or on smaller, diesel-burning liners.
Cruise ships, which would require a significant amount of battery power, will be slower to convert to green energy than smaller vessels such as the Future of the Fjords.
“You don’t immediately see what’s novel about the Future,” explains its chief engineer, David Jansson, during a tour.
Jansson worked in Norway’s maritime freight sector before signing on with the Fjords, the Norwegian start-up behind the $17.2-million Future.
Hatches on either side of the main deck lead down narrow ladders into the catamaran’s dual hulls, where the engine room would be found in conventional craft.
On the Future, it’s called the battery room, because it holds seven tonnes of lithium-ion batteries and a 600-horsepower electric motor—the other hull holds the same.
The ship’s batteries are charged from the stationary, wharf-side battery pack in Flåm and a floating charging dock in the old Viking village Gudvangen, both of which are charged several times a day from Norway’s public power grid.
The long, glass fiber dock in Gudvangen, called Power Dock, also has tanks that receive black and gray water, making the Future the only boat that doesn’t just empty its waste into the fjord.
When the ship docks, the batteries transfer power to the Future through a cable in about 20 minutes.
The energy is 100 percent renewable as its source is Norway’s vast hydroelectric system, which supplies 96 percent of the country’s power.
“The Future’s electricity comes from these mountains,” explains Jansson, waving an arm toward the ranges’ melting snowcaps.
Batteries and hydroelectric projects take their own toll on the environment, of course; no energy source will likely ever be harmless—it’s a matter of degree.
But getting emissions under control is arguably the transport sector’s most pressing concern.
From Flåm, the Future plies the deep waters of the glacier-carved Aurlandsfjord and then sails on to adjacent, interlinked fjords in nearby canyons.
After docking and recharging in Gudvangen, it returns to Flåm.
The unhurried 74-kilometer round-trip journey lasts up to four hours.
Aboard the boat, I immediately notice how quietly the vessel glides across the serene surface of the long, finger-shaped inlet.
In stark contrast to noisy combustion engines, the Future’s motors purr softly like those of an electric car.
As the boat passes a farmstead famous for goat cheese, I can even overhear the local merchants’ chitchat.
Gulls cry as they circle the ship.
Much higher above them soar white-tailed eagles with immense, outstretched wings that appear to be supervising the Future’s maiden voyage.
The battery-powered Future of the Fjords began operation in spring 2018 and travels between the Norwegian villages of Flåm and Gudvangen each day.
Equally delightful, there’s no smokestack stench.
The smell of the sea mingles with that of the thick, coniferous forests that cling to the fjord’s rocky banks.
“You can actually smell the waterfalls,” gushes a fellow passenger, standing on the bow.
And the Future’s gentle motors (battery propulsion is still less powerful than the combustion motors of the average tourist boat) disturb neither herring nor blue whiting, nor mackerel, nor saithe, nor the shoreline’s flora and fauna.
The Norwegian green-transport revolution is being fine-tuned for the water but is rooted in terra firma.
The country started pondering alternatives to the combustion engine for passenger vehicles as early as the 1990s, a full decade before the US start-up Tesla entered the world.
Twenty-five years ago, Norway began encouraging the use of electric plug-in and hybrid vehicles, particularly in the capital city of Oslo.
In the metropolis of 670,000, rebates and a range of tax exemptions helped boost sales of electrics; their owners enjoyed free parking and ferry transport, the use of bus lanes, and even free charging.
Norway’s own electric carmaker, called Think, launched in 1991.
At the time, the phenomenon of climate change was just entering public consciousness.
“The electrification of mobility began because we saw it as a promising industry for Norway, as well as positive for the environment,” explains Øyvind Leistad of Enova.
“We’re a small country with high labor costs, so we have to offer something special, like highly specialized technology.” Initially, the response from customers was underwhelming.
Yet as technology and infrastructure improved and prices came down, electric vehicles gained momentum; by 2015, Norway had topped its goal of 50,000 registered electrics, securing its place as a European frontrunner in the shift to electrics.
Today, Oslo has the world’s highest share of electric vehicles per capita, and a third of its bus fleet runs on fossil fuel alternatives.
Norway has declared that by 2025, all new cars must be zero-emission.
The nation’s state planners and entrepreneurs were certain that tech-minded Norway had a place on the cutting edge of urban sustainability.
Yet Think, which struggled financially all along, finally failed in the face of stiff competition from Asia, the United States, and elsewhere in Europe.
Instead of Think vehicles, Oslo’s streets are full of electric Nissan Leafs, Mitsubishi Outlanders, Volkswagen e-Golfs, and Tesla Model Ss.
So Norway turned its sights to the mare incognita of electric shipping, which it wagered could prove an auspicious market, especially for sea-savvy Norsemen.
“The basics of electric shipping are the same as electric cars,” says Torleif Stokke, director of Servogear, a manufacturer of propeller systems on the island of Bømlo.
“But it’s a completely different thing too and not just because ships are bigger.
A ship doesn’t run like a car.
Transferring the knowledge and technology from a car to a ship is a complex feat of engineering.”
In light of e-vehicles’ strides, Norway’s transportation ministry pushed development of the 21st century’s pioneer fully-electric ferry.
Ferry travel is a vital means of transportation in the country, with about 200 vessels in operation.
The contract was awarded to the Norwegian shipping company Norled and shipyard Fjellstrand AS, in collaboration with the German brand Siemens, which designed the motor.
Just two years later, the consortium delivered the electric-powered car ferry MS Ampere.
Since 2015, the 80-meter catamaran, which accommodates 120 cars and 360 passengers, has crisscrossed the nearly six-kilometer breadth of the Sognefjord, north of Flåm, with 16 round trips a day, seven days a week.
The lightweight ship has a set of electric motors and the most advanced battery and storage technology of its day, which enables it to sail for about 20 minutes between chargings—just long enough to make it across the fjord.
Siemens delivered the electric propulsion system and the charging technology for the world’s first completely electrical car and passenger ferry in Norway.
Due to the change to battery, the ship owner Norled, who operates on the ferry link across Sognefjord between Lavik and Oppedal, is reducing the cost of fuel by up to 60 percent.
The electric car ferry MS Ampere has been running in Norway since 2015, charging after each six-kilometer crossing of the Sognefjord.
The electric car ferry MS Ampere has been running in Norway since 2015, charging after each six-kilometer crossing of the Sognefjord.
“The Ampere is the nautical equivalent of Henry Ford’s Model T,” says Jan Kjetil Paulsen of Bellona, a Norwegian environmental think tank.
Despite the Norwegians’ bravado, electric shipping itself is not entirely novel—nor exclusively Norwegian.
The first electric ships appeared in the United Kingdom late in the 19th century and flourished briefly before losing out to more powerful internal combustion engines in the 1920s.
The Ampere, with the latest technology adopted from the best of electric car technology, declared that the electric ship was back and much improved, illustrating that small and medium ships traveling short distances (relatively slowly) could do so with battery propulsion.
Much like the Ampere, Future of the Fjords is the collective brainchild of several tech companies—all Norwegian.
And they benefitted significantly from government R & D funding and start-up grants.
About an eighth of the Future’s financing was put up by Enova, which started supporting projects in the transport sector in 2016 and has also helped finance a hybrid fishing vessel, a retrofitted historical tall ship, and a fully autonomous, electricity-propelled container freighter—the country’s biggest endeavor yet—which will be launched in 2020, among others.
“The point is not to subsidize the new solutions forever but to make them profitable as soon as possible,” says Leistad of Enova.
In Norway at least, this looks feasible for electric shipping in the near future, in part because of the country’s abundant and inexpensive hydropower.
Few other countries share the same advantage and will need to wait for the cost of green seafaring technology to come down.
Norway may be out in front, but it has competition hot on its heels.
China, for example, purports to have the first all-electric freighter, which hauls coal—yes, carbon-rich, climate-ravaging brown coal—along southern China’s Pearl River to a power plant.
This fall, the Dutch company PortLiner intends to launch two cargo barges to operate between Amsterdam, Antwerp, and Rotterdam.
France, Denmark, Finland, and Belgium are all charging into the waters of electric seafaring too.
Every new generation of electric vessel, as it is with automobiles, has longer range, more battery power, and charges faster.
The Future has nearly twice the power of the Ampere, which looks dated in contrast.
The Dutch barges will be 52 meters long and carry six-meter-long batteries—enabling them to cruise for 15 hours without charging.
Dutch shipbuilders Portliner are going to build the “Tesla of Cargo-ships”.
An artist’s rendering depicts one of two electric Dutch cargo barges that are set to run between Amsterdam, Antwerp, and Rotterdam after they launch in fall 2018.
As for the cruise ships that dock in Flåm and other ports, there’s progress too, though more incremental.
Because they have motors as big as multistory houses and travel stretches of hundreds of kilometers at a time along western Norway’s 2,400-kilometer-plus coast, they’re more difficult to convert.
“The big ships and tankers won’t run on electricity alone for some time,” says Kjetil Paulsen.
“You’d need a whole power plant to charge the batteries.”
But Norway’s Hurtigruten is testing the limits—pushed by the reality that if it doesn’t slash emissions, it will relinquish the privilege to enter protected fjords, just as international ships will.
It has already sworn off heavy oil fuel, opting instead for lower-sulfur variations of diesel.
The company will soon introduce two new hybrid ships designed by the British carmaker Rolls-Royce to its fleet, with the intent of reducing fuel consumption by 20 percent.
Ventures like the Ampere and Future of the Fjords show how quickly the industry can reinvent itself, with the right incentives in place.
Yet, as I sail through the fjords, relishing the beauty, I wonder whether Norway could do more for the climate—much more—by scaling back its prodigious oil and gas production in the North Sea.
As temperatures here inch up like everywhere else in the world, those snowcaps above Flåm will melt away, leaving Norway with less renewable energy for its electric cars and boats to draw upon, and thus leaving a big question mark about the future of electric mobility of all kinds.
Still, in the short term, the Future and other zero-emission ships are a critical first step toward decarbonizing the maritime industry.
Links
- Ship technology : Future of the Fjords Sightseeing Vessel / Ampere Electric-Powered Ferry
- Seatrade cruising : Vision 2030: electric cruise ships, destination management and changing perceptions
- Forbes : Is The Arctic The Cruise Industry's Newest Frontier
- GeoGarage blog : Norway takes lead in race to build autonomous ... / The ships that could change the seas forever / Self-driving boats: the next tech transportation race / Ghost ships IRL: How autonomous cargo boats ...
Monday, September 24, 2018
Finally, a world map that's all about oceans

The connectedness of the worlds ocean - from the German magazine mare
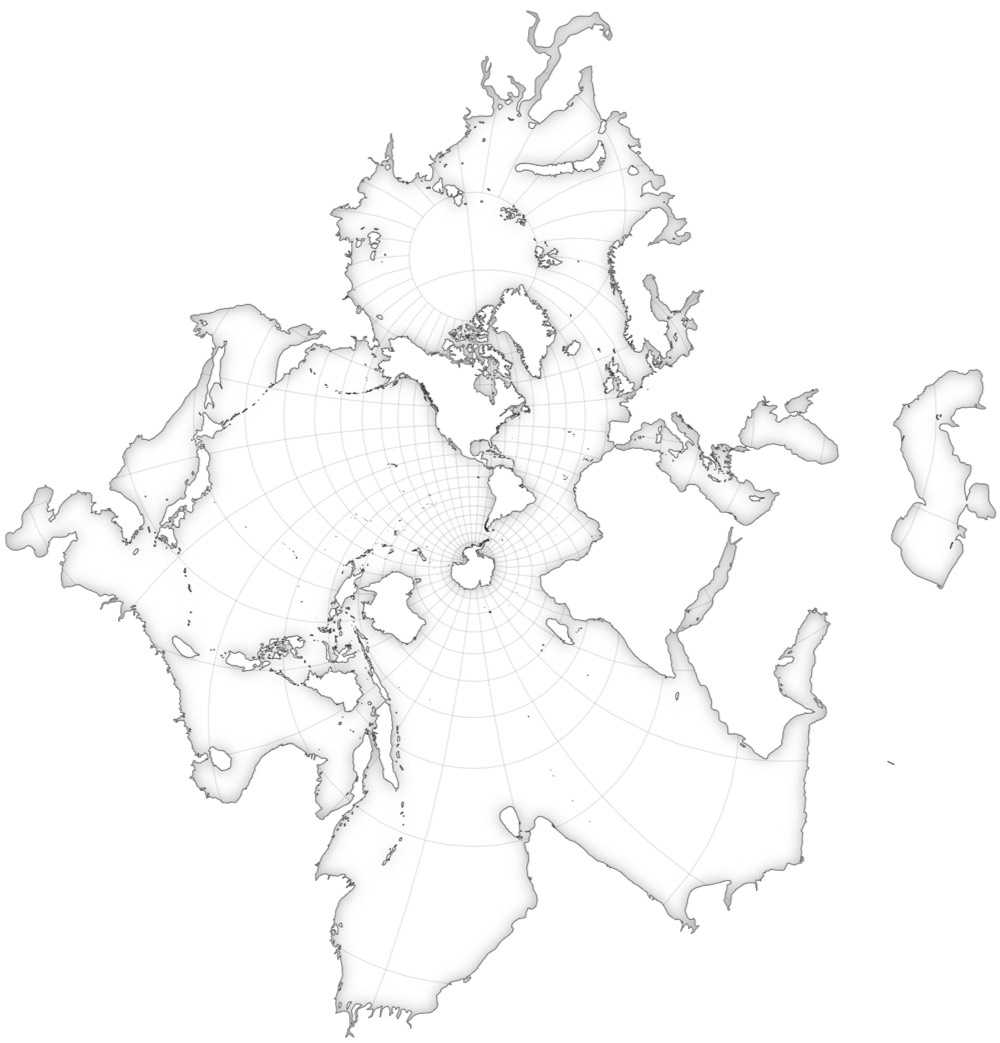
Athelstan Spilhaus (1911-1998), geophysicist and oceanographer, offers a representation of the Earth centred on the oceans.
The poles are placed in South America and China, particularly distorting the continents, but the oceans merge into a closed inland sea.
Athelstan Spilhaus (1911-1998), geophysicist and oceanographer, offers a representation of the Earth centred on the oceans.
The poles are placed in South America and China, particularly distorting the continents, but the oceans merge into a closed inland sea.
From BigThink by Franck Jacobs
The Spilhaus Projection may be more than 75 years old, but it has never been more relevant than today.
Athelstan Spilhaus designed an oceanic thermometer to fight the Nazis, and the weather balloon that got mistaken for a UFO in Roswell
In 1942, he produced a world map with a unique perspective, presenting the world's oceans as one body of water
The Spilhaus Projection could be just what the oceans need to get the attention their problems deserve.
In 1942, the South African-born oceanographer and geophysicist Athelstan Frederick Spilhaus produced a fascinating map.
The marine regions are represented in the centre of the world.
An immense inland sea (a little more than 70% of the Earth's surface) appears before our eyes.
Let
us remember that the World Ocean generates more than 60% of the
ecosystem services that allow us to live, starting with the production
of most of the oxygen we breathe.
This map is therefore very symbolic of the importance of the seas.
In order to achieve this, the author uses the principles of the following two projections.
The
screening by Ernst Hammer and August Heinrich Petermann (co-author with
Hermann Berghaus and Carl Vogel of the Atlas Stieler).
The result is an interrupted projection in which the oceans form a unit.
It's both awesome and totally confusing.
The deformation is such that the American and Asian continents are completely torn apart.
Europe, Africa and South-East Asia, on the other hand, have a coherent form.
This projection is rarely used and it's a shame!
from thecartographe.net
This is a world map unlike any other.
Uniquely, it centres on Antarctica.
Disturbingly, it rips Asia and the Americas to shreds.
And compellingly, it presents the seas and oceans – 71% of the Earth's surface – as a unified body of water.
Spilhaus shoreline maps by Mike Bostock (d3)
The map was designed by a renaissance man who also invented the skyways of Minneapolis and the secret weather balloon that caused the Roswell Incident.
And yet you've never heard of him.
It's a name you would have remembered: Dr Athelstan F. Spilhaus.
But neither this map, connected to a wartime invention for fighting Nazi U-boats, nor his other creations have earned his name household status.
Born in Cape Town in 1911, Spilhaus studied and worked both in his native South Africa and in the U.S., where he settled later in life.
In 1937, he was named assistant professor in at NYU, where he set up the meteorology and oceanography department.
Dr Spilhaus was not just a distinguished meteorologist and oceanographer, but also a prolific inventor.
During the Second World War, he developed the bathythermograph, a device for measuring sea temperature at great depth – making it easier to detect German submarines.
In 1948, he moved to the Minnesota Institute of Technology in Minneapolis.
Perhaps because of the huge contrast between the harsh local winters and Cape Town's Mediterranean climate, he conceived of a network of elevated covered walkways between buildings, sheltering people from severe weather.
The Minneapolis Skyway System is currently 11 miles long, connecting buildings across 80 city blocks.
Following his work on the undersea thermometer, Dr Spilhaus helped develop a similar system of weather balloons for the Air Force, to spy on Soviet nuclear testing.
When one such balloon crashed in New Mexico in 1947, the wreckage was whisked away with such speed and secrecy that the rumour mill went into overdrive.
Some today still claim the crashed device was an extra-terrestrial space ship – the infamous 'Roswell UFO'.
A man of many talents, Dr Spilhaus built some 3,000 varieties of children's toys and for 15 years authored a science-focused, globally syndicated weekly comic strip called Our New Age.
In 1954, Dr Spilhaus became America's first representative on the executive board of Unesco, the UN's educational and cultural department.
A few years later, president Kennedy appointed him to direct the U.S. exhibit at the 1962 Seattle World's Fair.
"The only science I ever learned was from your comic strip", JFK told him.
another example of this projection, taken from this article.
Dr Spilhaus also proposed the establishment of Sea Grant Colleges – a network of institutes of higher learning focusing on the exploitation and conservation of marine areas.
Which brings us back to the sea, and to this map.
Designed in 1942 while Dr Spilhaus was working on his bathythermograph, it reverses the land-based bias of traditional cartographic projections.
The Spilhaus projection – a combination of the Hammer and Spielmann projections – places the poles of the map in South America and China, ripping up continents to show the high seas as one interrupted whole.
The earth-sea is perforated by Antarctica and Australia, and fringed by the other land masses.
Two small triangles, one at the top of the map and the other on the lower right hand side, mark the same spot: the Bering Strait – as a reminder that what we're looking at is not in fact a vast inland sea, but a body of water that circles the entire globe.

a French graphic designer who has a side project producing strange new countries.
On most maps, the oceans are so vast that they become easy to ignore.
Rather than just use them as background noise, this map focuses on the watery bits of our planet.
That's not just a refreshingly different viewpoint but, it could be argued, also a desperately needed one.
Our oceans produce between 50% and 85% of the world's oxygen and are a major source of food for humanity.
But they are in mortal danger, from overfishing, acidification, plastic pollution and climate change.
Maritime 'dead zones' – with zero oxygen and zero marine life – have quadrupled since the 1950s. Low-oxygen zones have increased tenfold.
The trend is fuelled by climate change (warmer waters hold less oxygen) and, in coastal zones, fertiliser and sewage runoff from the land.
Perhaps this map can do what Earthrise did for the planet as a whole. Taken in 1966 by astronaut Bill Anders of Apollo 8 – the first manned mission to circle the moon – that picture shows our planet rising above the lunar surface, an inversion of the moonrises so familiar to humankind.
It's been called "the most influential environmental photograph ever" because it so clearly visualises the earth as a single, fragile ecosystem.
Earth rising above the lunar horizon; image taken by Bill Anders of
Apollo 8 on 24 December 1968. The land mass visible in the lower
right-hand side is northwest Africa.
The oceans need a similarly powerful unifying visual.
Even though it's over 80 years old, this projection reminds us that saving the planet is pointless if we don't also save the seas
- NYTimes : Athelstan Spilhaus, 86, Dies; Inventor With Eye on Future
- Shilhaus : Atlas of the World with geophysical boundaries
- Jason Davies : Spilhaus map
- Kootke : Shoreline maps of the world
Sunday, September 23, 2018
100 Island Challenge
This model was collected on Ta'u, part of American Samoa. Collection of this model was made in partnership with NOAA's Pacific Islands Fisheries Science Center (PIFSC) on an expedition to monitor the reefs around American Samoa.
This particular model is of the coral nicknamed "Big Mama"- a large Porites colony thought to be over 500 years old!
This model was created using Structure from Motion (SfM) technology and is visualized using the custom built software Viscore developed by Vid Petrovic and Falko Kuester as part of the Cultural Heritage Engineering Initiative (CHEI) at UC San Diego.
Learn more at 100islandchallenge.org !
For the hundreds of millions of people living adjacent to coral reefs, this productive ecosystem provides important shoreline protection and critical food security.
Alarmingly, a combination of local human influences and global climatic changes are altering the structure and functioning of many reef ecosystems.
For years, our team at Scripps Institution of Oceanography has been working to establish a regional scale perspective of coral reef health, investigating how reefs are structured, how they change over time, and how we can better manage them in the face of global change.
This 3D model was collected at Flint Island, Southern Line Islands,
Republic of Kiribati, in 2013.
One of the most remote and pristine
islands on the planet, Flint Island, and the southern Line Islands as a
whole, offer researchers from the Scripps Institution of Oceanography
the rare opportunity to study coral reefs in pristine states over large
scale physical gradients known to influence reef development.
To accelerate this crucial effort, we propose a campaign of field surveys across the tropical Pacific and beyond that will generate critical data about reef ecosystems through time.
By using a collection of survey technologies coupled with ecological theory and quantitative models, we will gain important insights into the relative condition of coral reefs from across locations, using large-scale geographic scope to provide context for comparisons across locations.
By developing a rigorous and repeatable sampling protocol, especially with the inclusion and sharing of high-resolution data (fish, benthic, oceanographic) and novel reef visualization products (i.e. large-area ‘photomosaics’) in collaboration with engineers, we can inform and educate managers and other stakeholders about how their coral reefs work and what is needed to ensure that reefs persist into the future.
Subscribe to:
Comments (Atom)

