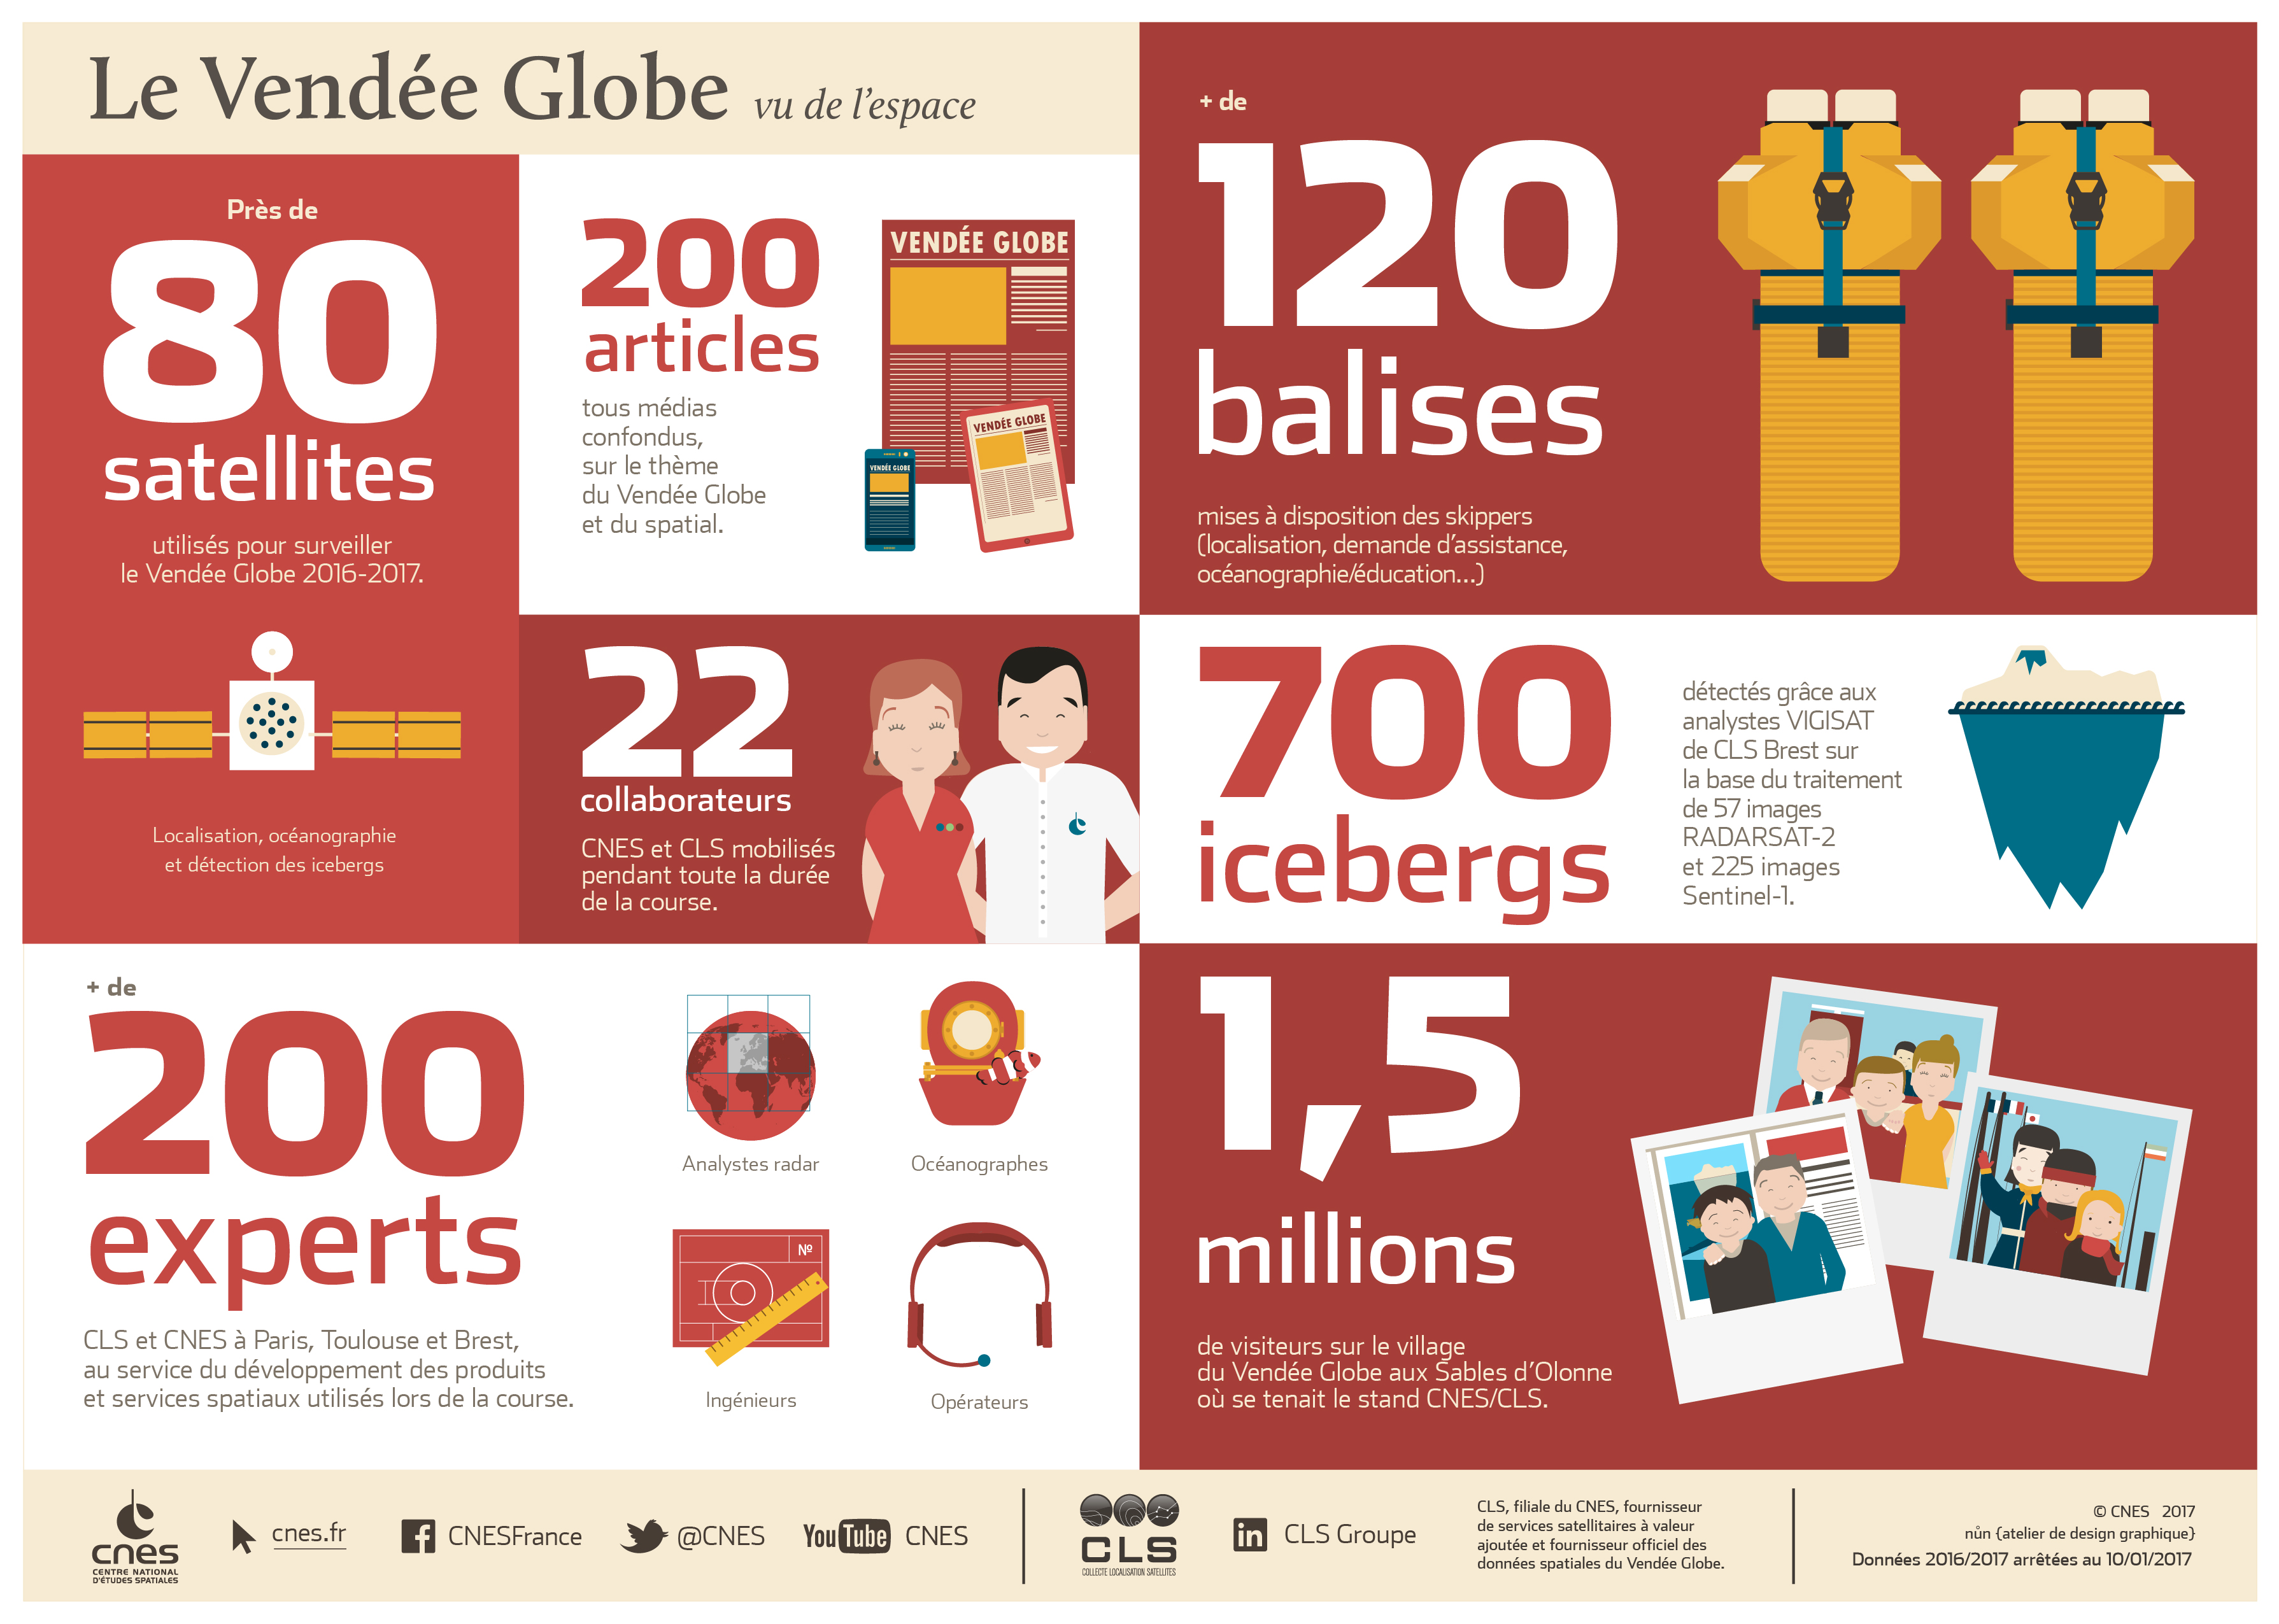
The Vendée Globe is the only solo, non-stop, without assistance sailboat race around the world. Nicknamed “Everest of seas”, only 71 sailors under 138 managed to reach the fish line since its creation. This figure is showing how difficult this worldwide event is, in which sailors are facing extreme cold, huge waves and threatening sky across the great south. Extremes conditions involve exceptional means. The race department asks CLS, Collecte Localisation Satellite, a CNES subsidiary, to watch this modern times adventurer from space. Read more on : race.cls.fr
Iceberg detection
To detect the presence of icebergs and predict their direction, CLS has developed a solution used to:
Detect iceberg populations produced by glaciers in the Antarctic using radar satellite observation data
Define risk zones
Model the direction of icebergs and their melt-rate according to currents and surface temperatures, wind levels and the shape and size of the iceberg
Readjust the direction model using observation data from radar satellites in the Subantartic zone (around 50° South).
Perform (using these radar images) a correct display of icebergs of a significant size (>50m).
CLS is thus able to provide race organisers with maps of the Antarctic, with the location of iceberg populations and predictions concerning their drift direction
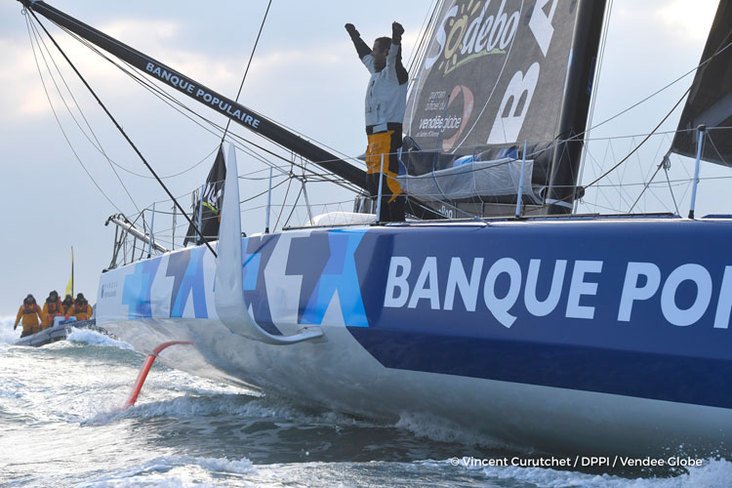
Armel Le Cléac'h smashes Vendée Globe race record in spectacular style 74 days 3 hours 35 min 46 sec... this is what it took Armel to win this Vendée Globe. In reality, it took Armel 10 years to win this race after finishing twice at the second place in the last editions.
After
two and a half months at sea, Armel Le Cleac'h has finally achieved his
dream in one of the world's toughest yacht races -- and in
record-breaking fashion.
Twice a
runner-up in the grueling Vendee Globe event, the French skipper
celebrated his first victory Thursday as he crossed the finish line off
the coast of western France.
He completed the solo round-the-world race in a new fastest time of 74
days, three hours, 35 minutes and 46 seconds.
It was almost four days
quicker than the previous record set by compatriot Francois Gabart in
the 2012-13 edition.
In the morning of the arrival
That time Le Cleac'h was just two hours
back in second place -- the smallest losing margin since the race, held
every four years, started in 1988.
"This
is a dream come true," said the 39-year-old, who covered 24,499.52
nautical miles at an average speed of 13.77 knots during the race.
"Today is a perfect day. My team have been amazing they're the dream team, and this is their day too."
Historical records
(Infographie : Olivier Bernard)
Race
organizers predicted that second-placed British sailor Alex Thomson
would cross the line 12 hours after Cleac'h, who finished at 1537 GMT
(1037 ET).
"I'm very happy for Alex, it's a great
second place," Le Cleac'h added. "It has been very difficult with him
behind me, he gave me a really hard time in this Vendee Globe."
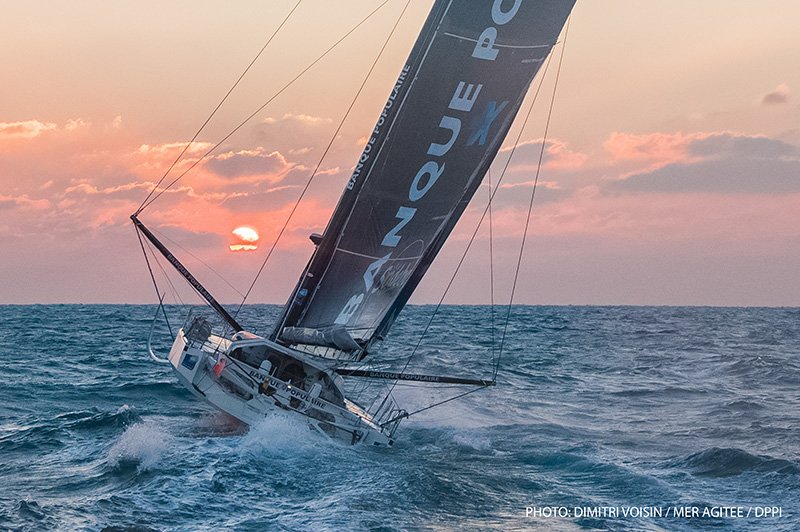
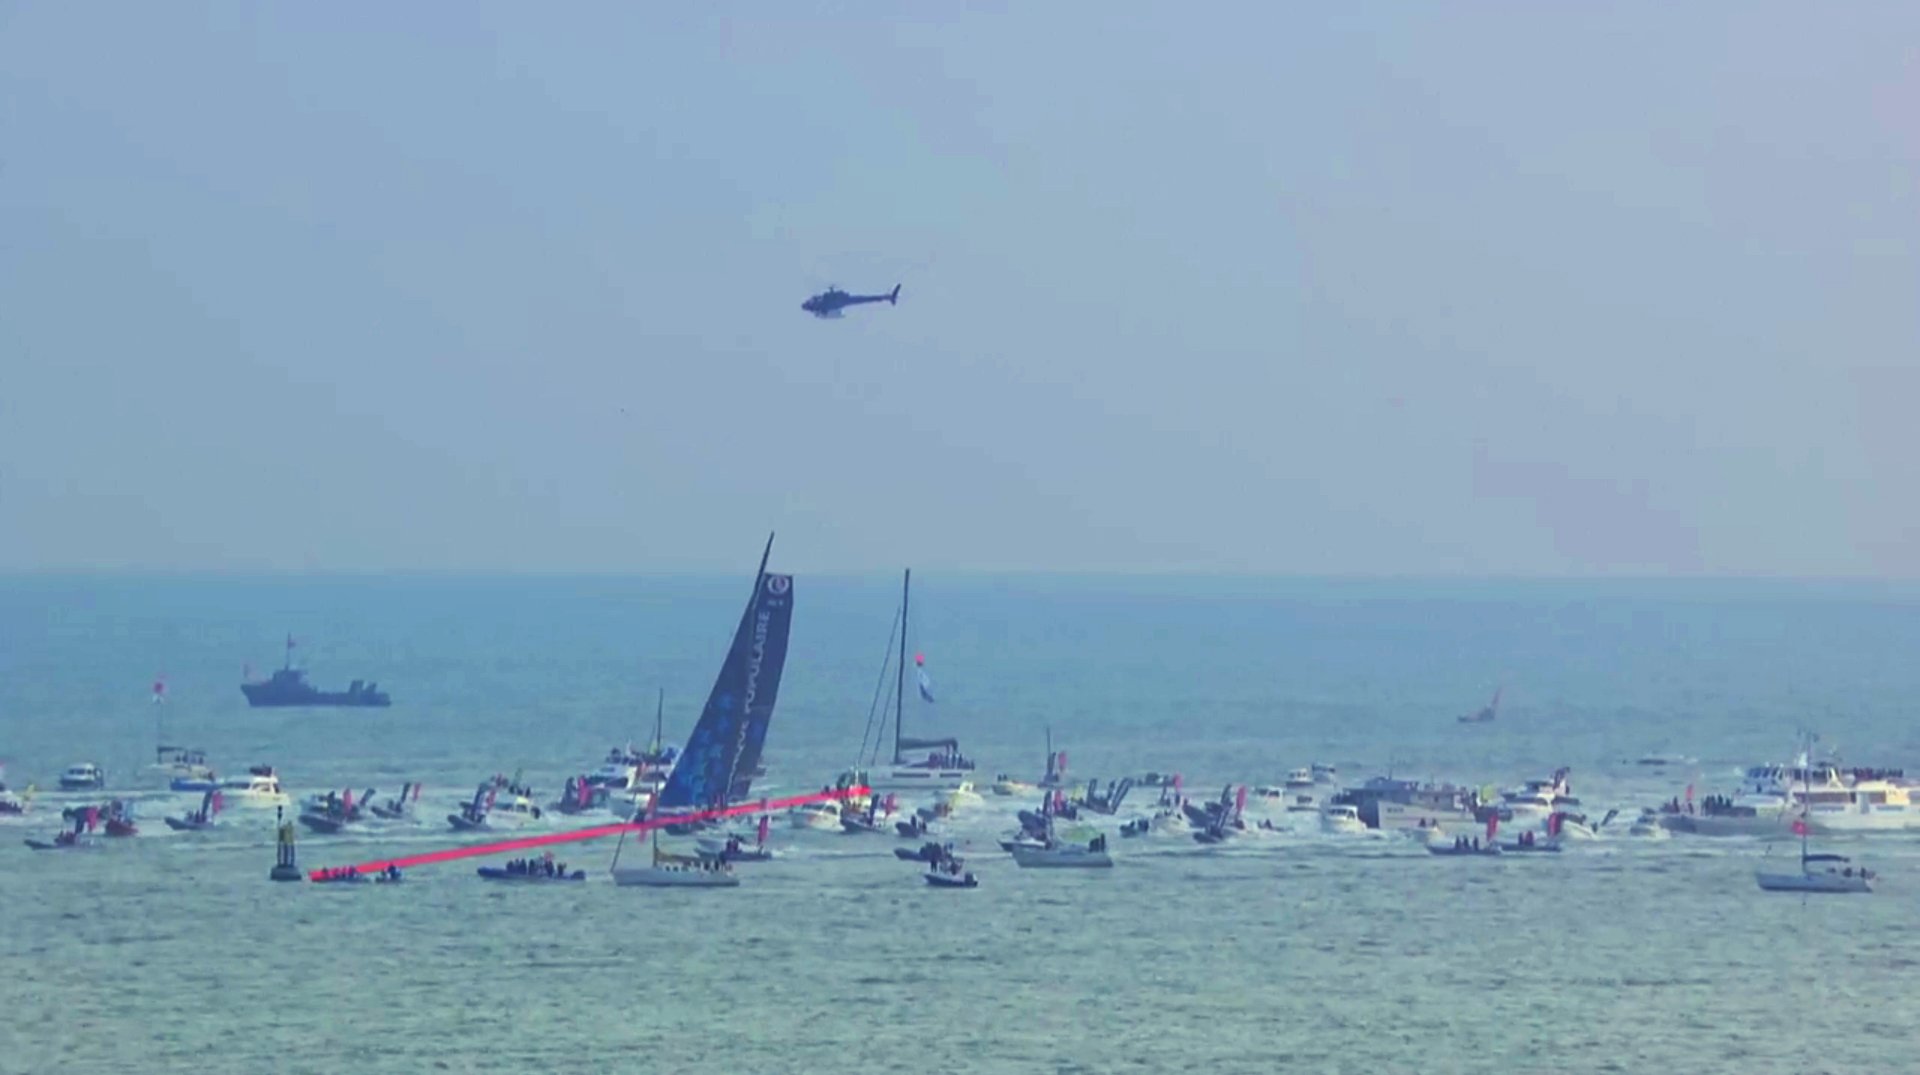
Le
Cleac'h, sailing his 60-foot vessel Banque Populaire, was met by an
estimated 350,000 fans in freezing conditions at Les Sables d'Olonne.
France has now won all eight editions of the race.
Thomson,
who finished third in 2013, looked to be threatening a late comeback
after sailing 536.8 nautical miles in 24 hours -- reclaiming the record
he held between 2003-2012 for distance covered in that time span.
Hugo Boss damaged startboard foil
(photo : Pierre-Henri Beguin)
He
led the race in the opening weeks, and set two records in reaching
South Africa's Cape of Good Hope, but a damaged starboard foil dented
Thomson's chances of breaking the French monopoly of the title.
Often referred to as "the Everest of the Seas," only half the entrants usually complete the course.
Of the 138 sailors to start the previous seven races, just 71 finished -- while three competitors died.
This time, 11 of the 29 sailors who began the voyage in Les Sables d'Olonne on November 6 have pulled out.
The
man in last place, Sebastien Destremau, was almost 10,000 nautical
miles behind Le Cleac'h and had yet to pass the notorious Cape Horn off
the coast of Chile.
This year's race also features 66-year-old
US skipper and lifelong acute asthma sufferer Rich Wilson, who is
almost three times the age of youngest competitor Alan Roura.
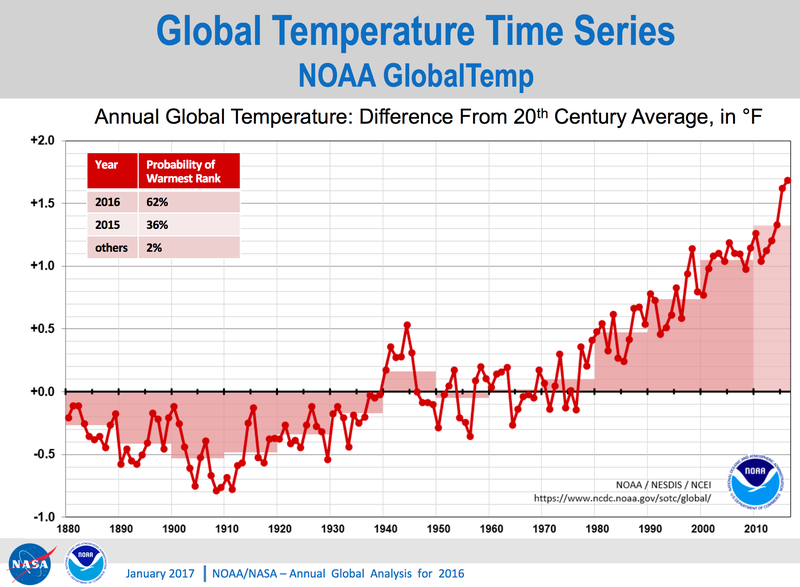
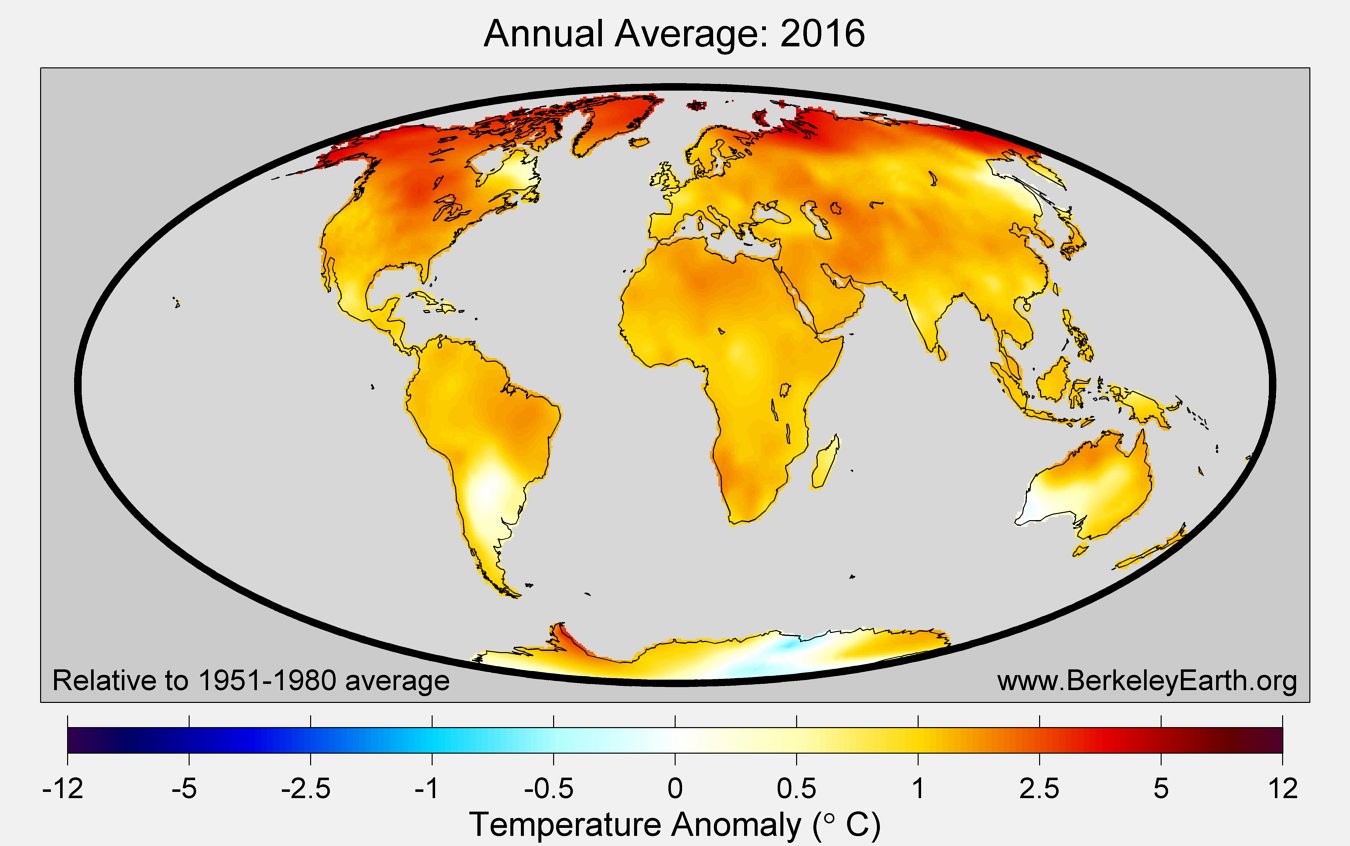
2016 was the hottest year on record, continuing a decades-long warming
trend.
Scientists at NASA’s Goddard Institute for Space Studies (GISS)
analyzed measurements from 6,300 locations and found that Earth’s
average surface temperature has risen about 2.0 degrees Fahrenheit (1.1
degrees Celsius) since the late-19th century, largely a result of human
emissions into the atmosphere.
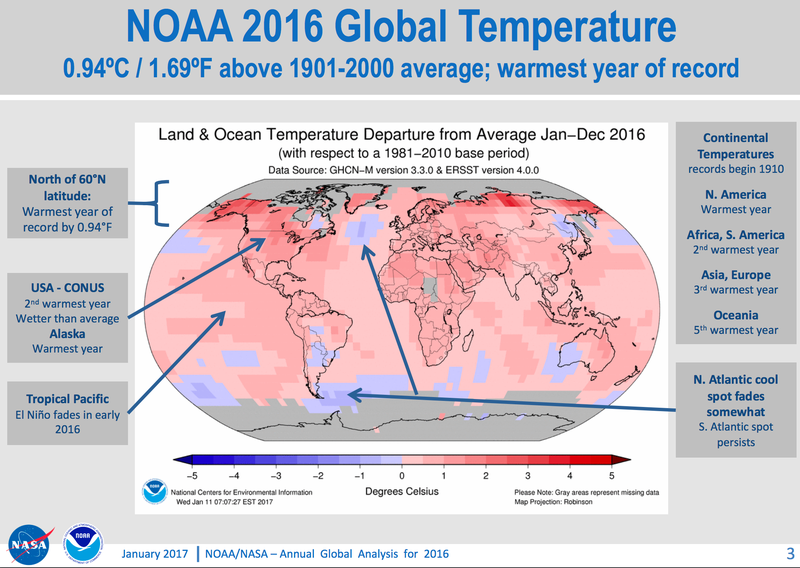
Earth’s 2016 surface temperatures were the warmest since modern
recordkeeping began in 1880, according to independent analyses by NASA
and the National Oceanic and Atmospheric Administration (NOAA).
Globally-averaged temperatures in 2016 were 1.78 degrees Fahrenheit
(0.99 degrees Celsius) warmer than the mid-20th century mean.
This makes
2016 the third year in a row to set a new record for global average
surface temperatures.
Scientists declare that 2016 was the hottest than year on record since records began. other image from NOAA
The 2016 temperatures continue a long-term warming trend, according
to analyses by scientists at NASA’s Goddard Institute for Space Studies
(GISS) in New York.
The planet’s long-term warming trend is seen in
this chart of every year’s annual temperature cycle from 1880 to the
present, compared to the average temperature from 1880 to 2015. Record
warm years are listed in the column on the right. Credits: NASA/Joshua Stevens, Earth Observatory
NOAA scientists concur with the finding that 2016
was the warmest year on record based on separate, independent analyses
of the data.
Because weather station locations and measurement practices change
over time, there are uncertainties in the interpretation of specific
year-to-year global mean temperature differences.
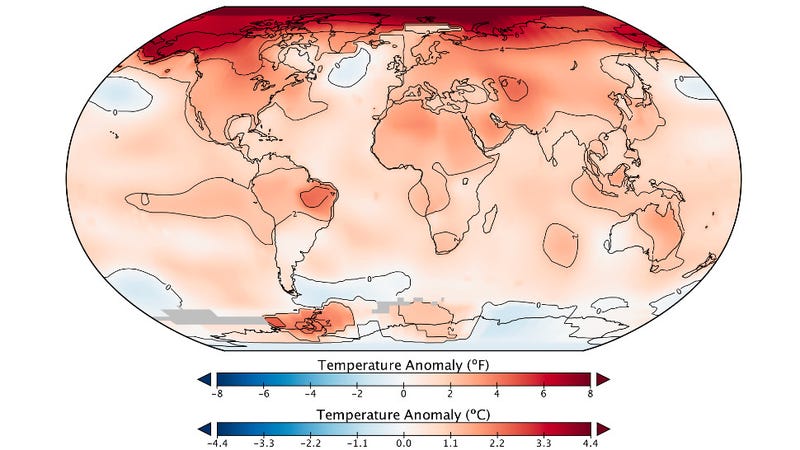
Global temperature anomalies for 2016
image : NASA/NOAA (other image from BerkeleyEarth.org)
However, even taking
this into account, NASA estimates 2016 was the warmest year with greater
than 95 percent certainty.
“2016 is remarkably the third record year in a row in this series,”
said GISS Director Gavin Schmidt. “We don’t expect record years every
year, but the ongoing long-term warming trend is clear.”
The planet’s average surface temperature has risen about 2.0 degrees
Fahrenheit (1.1 degrees Celsius) since the late 19th century, a change
driven largely by increased carbon dioxide and other human-made
emissions into the atmosphere.
Chunks of Arctic sea ice, melt ponds and open water are
all seen in this image captured by NASA's Digital Mapping System
instrument during an Operation IceBridge flight over the Chukchi Sea in
July 2016. Last year was particularly bad for Arctic sea ice.
Most of the warming occurred in the past 35 years, with 16 of the 17
warmest years on record occurring since 2001.
Not only was 2016 the
warmest year on record, but eight of the 12 months that make up the year
– from January through September, with the exception of June – were the
warmest on record for those respective months.
October, November, and
December of 2016 were the second warmest of those months on record – in
all three cases, behind records set in 2015.
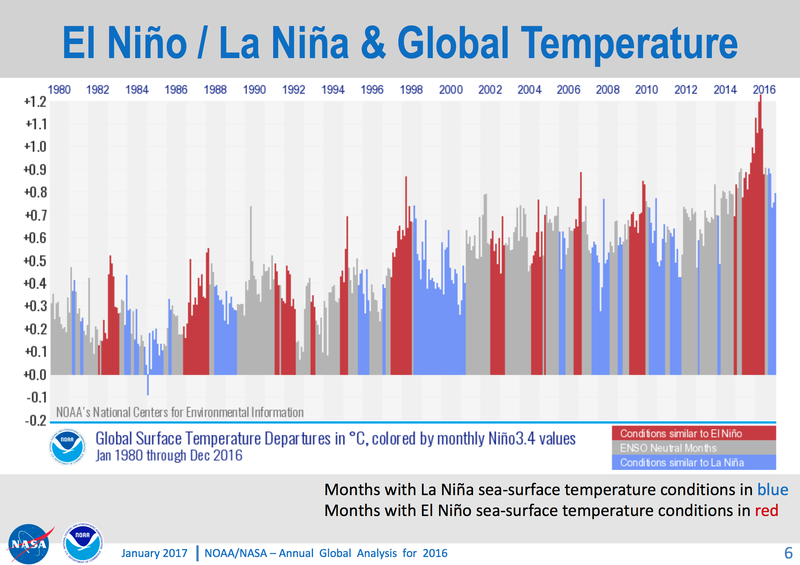
Phenomena such as El Niño or La Niña, which warm or cool the upper
tropical Pacific Ocean and cause corresponding variations in global wind
and weather patterns, contribute to short-term variations in global
average temperature.
A warming El Niño event was in effect for most of
2015 and the first third of 2016.
Researchers estimate the direct impact
of the natural El Niño warming in the tropical Pacific increased the
annual global temperature anomaly for 2016 by 0.2 degrees Fahrenheit
(0.12 degrees Celsius).
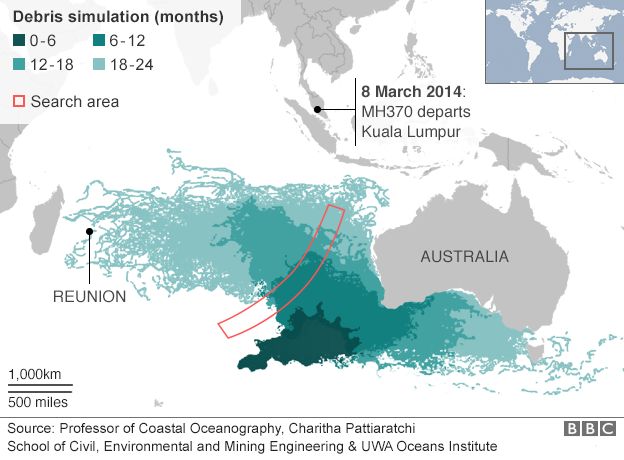
Almost three years after Malaysia Airlines Flight MH370 disappeared from civilian radar screens, the search for the missing aircraft has come to a close.
Malaysia, Australia and China have jointly agreed to “suspend” the search after combing 120,000 km² of the southern Atlantic Ocean without finding the crash site.
So what now for the hunt for MH370?
Could the wreck of the Boeing
777-200 be somewhere outside the search zone?
Could parts of the plane
that washed up in the western Indian Ocean give clues to where it might have crashed?
Was the search in vain? The search for clues
Initially the search region was in the South China Sea.
But on March
24, 2014, it was revealed that the plane most likely crashed in the
southern Indian Ocean along a line defined as the 7th arc, based on
satellite data from Inmarsat.
Analysis of a series of seven “pings”, originating from the aircraft
engines, indicated the likely location of the plane.
Each ping allowed
analysts to draw an arc that showed the likely path of the aircraft.
The Australian Transport Safety Bureau (ATSB),
which led the search, identified the most likely region of the crash as
being the southern section of the 7th arc, corresponding to the final
ping received from MH370.
Based on the the Inmarsat data and flight simulations, the ATSB
defined a detailed search area of the sea floor within 40 nautical miles
of the southern segment (39.3°-36°S) encompassing an area of
120,000km².
Location of the 7th arc and the main search regions.
In addition to the Inmarsat data, other evidence for the search area was provided by the discovery of aircraft debris
that washed up on the shores of countries of the western Indian Ocean,
including Reunion Island, Madagascar, Mozambique, South Africa, Tanzania
and Mauritius. Drifting target
Oceanographic drift modelling has indicated that these discoveries were consistent with the debris originating from the region of the current search area.
But considering the time the debris took to travel to the western
Indian Ocean, it was proposed that the most likely origin of the debris
was to the north of the search area.
These findings were confirmed by recent CSIRO drift modelling as part of an ATSB first principles review, as well by other international research groups.
The ATSB review concluded that the crash site was “unlikely”
to be in the defined search area and recommended extending the search
to an additional area of approximately 25,000km² located to the north.
It should be noted that the original 120,000km² search area was
defined before any debris was discovered in the western Indian Ocean.
Thus this did not take into account the oceanographic evidence.
The proposed additional 25,000km² search area (in black) identified as the most likely crash region.
The oceanographic drift modelling allowed for identification of particular regions in the western Indian Ocean that the debris from MH370 would make landfall.
These predictions facilitated the discovery of many pieces of debris by US lawyer and amateur investigator Blaine Gibson in Mozambique and Madagascar.
Recently, possible debris maps provided to Gibson and next-of-kin of
crash victims discovered additional debris in Antongila Bay, Madagascar.
Predicted landfall sites of particles tracked from
the oceanographic drift modelling.
White dots represent the areas where
aircraft debris represented by particles beached.
More than one
particle in a region location means higher likelihood of finding debris.
Blaine Gibson found many pieces of debris at Raike Beach on the Island
of Sainte-Marie and in Antongila Bay last November.
The group also
visited Nosy Mitsio but reported that the shoreline was very rocky and
not able to retain any debris.
The model resolution does not take into
account the shoreline type.
This means the most likely crash site was to the north, most likely
between 36°S and 32°S.
The ATSB first principles review acknowledged
this to be consistent with all the available information.
Some of this area was searched but only within 25 nautical miles
either side of the 7th Arc (not the 40 nautical miles searched before).
It is highly likely that the crash site of the MH370 is located in this
region.
If another search was to be conducted, this is where it could
start. Not in vain
Even though MH370 was not found in the search area, some useful information was gleaned from the process.
The intensive underwater search for MH370 was undertaken using
tethered underwater vehicles in a region with limited information on the
sea floor, which included complex terrain such as Broken Ridge.
It was necessary to obtain detailed information on the sea floor to
ensure the search was undertaken safely and effectively.
Survey vessels
obtained high-resolution bottom topography data not only along the
120,000km² intensive search region but also regions to the north.
Map of the regions where high-resolution bottom topography data were collected.
The data revealed many seabed features that were previously unknown.
The high-resolution bottom topography, which will soon be made public,
will contribute to new research, particularly on marine geology and
fishery resources.
Improved bottom topography data will also contribute to increased
accuracy in oceanographic modelling and in the propagation of tsunami
signals.
So, while the search for MH370 may not have uncovered the wreck, it
has contributed to our knowledge of a very remote part of the world.
Rising sea temperatures are pushing shoals hundreds of miles from native grounds
Scottish
fishermen have uncovered an intriguing way to supplement their income:
they have added squid to the menu of marine creatures they regularly
pull from the sea.
A species normally associated with the warmth of the
Mediterranean, rather than the freezing north, may seem an odd addition
to their usual catches of cod and haddock.
Nevertheless, squid has
become a nice little earner for fishing boats from Aberdeen and the
Moray Firth in recent years.
Thirty years ago, squid was a rarity in the North Sea.
Today, boats
bring back thousands of tonnes a year – though cod and haddock still
dominate catches.
Nor is this warm-water addition to northern fish menus
a unique feature.
Red mullet, sardines and sea bass have also appeared
with increasing frequency in North Sea fishermen’s nets in recent years.
All of them are associated with warmer waters and their appearance is
seen by many scientists as a sign that climate change is beginning to
have a serious impact on our planet’s oceans.
For Scottish lovers of fresh squid, this is good news.
However, in
many other parts of the world, rising sea temperatures – triggered by
climate change – are providing fishing industries and governments with
major headaches.
Fish are moving hundreds of miles from their old
grounds, sometimes out of zones that had been set up to protect them.
Climate Change Effects on Fisheries
source FAO
In
other cases, fish are simply disappearing from nets.
Part of the problem has its roots in past overfishing.
But now climate change is exacerbating the issue.
Last week, scientists revealed that a vast chunk of ice was set to break away from the Antarctic Larsen C ice shelf, while Arctic sea ice extent is now at its lowest level for this time of year since records began.
And if sea temperatures continue to rise, even greater disruption
will be caused to fishing stocks.
Fishermen will lose their livelihoods
and communities will be deprived of their only source of food.
“There is an unambiguous trend,” said marine biologist Andrew Bakun
of Miami University.
“If you look at the world’s fish catches as a
whole, you find they are made up, more and more, of warm-water species
as opposed to catches in previous years which had more species that were
from cooler waters.”
Seafood is the critical source of protein for more than 2.5 billion
people today.
However, over-exploitation in the past has resulted in a
crash in fish stocks, with the result that the world’s annual catch is
now decreasing by more than 1 million tonnes every year – despite the
availability of the latest fishing technology: nets big enough to engulf
cathedrals, echo locators, satellite navigation, and powerful engines
to drive boats.
Now climate change is making the management of this threatened supply
even more difficult.
“All the world’s oceans are facing intense
problems but the problem is going to be particularly serious for
tropical countries, which are often underdeveloped and are far less able
to maintain sustainable management regimes for their fisheries,” said
marine biologist Callum Roberts, of York University.
An example is provided by Bangladesh.
Fish gives the nation 60% of
its animal protein and is vital to the 16 million Bangladeshis living
near the coast, a number that has doubled since the 1980s.
However, a
study – led by Jose Fernandes, of the Plymouth Marine Laboratory – of
two key fish species, Hilsa shad (Tenualosa ilisha) and Bombay duck (Harpadon nehereus),
showed that stocks of both could be devastated by climate change that
would affect nutrient flows in coastal waters, ocean temperatures and
sea levels.
The introduction of sustainable management measures would offset some
of these impacts but stocks still face being cut significantly, the
group added.
“Both the sea and land environment are changing,” said
Fernandes.
“The problem is that we know much less about the sea than the
land, so it is harder to observe and to intervene.”
Think of the problem as a double whammy, said marine ecologist Malin
Pinsky, of Rutgers University, New Jersey.
“Fish have already been
reduced to low numbers by intense overfishing and that makes them far
less able to deal with increasing temperatures or other effects of
climate change.”
Pinsky points to the example of the Atlantic cod in the Gulf of
Maine.
“It has been badly hit by intense overfishing.
Now it appears
that warmer waters have been reducing survival even further.
The trouble
is that the fisheries management in the area did not realise this and
allowed fishing to continue there at a too high level.”
Fishermen in South Italy - Climate Change in European Marine Ecosystems
Global warming is profoundly changing the seas and oceans that surrounds us.
Fishermen in Milazo (South Italy) catch fish they never used to catch before.
90% of the alien fish species in Milazo have a tropical or a subtropical origin.
Managing fish stocks in a warming world is proving to be a
particularly thorny problem, he added.
“Fish management maps have lines
drawn on them but it turns out fish don’t see those lines.”
As waters warm, fish seek cooler waters and head to higher latitudes, a
problem that has also been highlighted in the North Sea.
There, closure
areas have been set up to protect spawning and nursery grounds of
plaice, herring and sandeel from intense fishing.
“But if species shift
their distribution in response to climate change it is possible such
measures will become less effective in the future,” says a study by a
group of scientists led by John Pinnegar, of the government-funded
Centre for Environment, Fisheries and Aquaculture Science (Cefas).
Another example of the problem was highlighted last week by the New York Times,
which noted that the centre of the US black sea bass population is now
found in waters off New Jersey.
In the 1990s, it was hundreds of miles
further south.
Under fishing rules that were laid down then, North
Carolina fishermen are still entitled to the largest share of black sea
bass catches – which requires them to steam north for 10 hours to reach
the black sea bass’s current fishing grounds.
By contrast, local New
England fishermen are allowed to catch a small fraction of the black sea
bass now found in their own neighbourhood and must throw all excess
overboard.
The issue has already reached the status of causing international
discord, as is revealed through the example of the humble mackerel.
“Until recently, mackerel in the Atlantic were fished mainly by Britain,
Ireland and Norway and stocks were protected by an EU quota system,”
said Roberts.
“Then stocks began to head north, most probably because
sea temperatures were rising.
Eventually, mackerel reached Iceland – at
which point Iceland asked to be included in fishing quotas.
This request
was rejected – so Iceland went ahead and started catching mackerel in
any case.”
The result was a drop in mackerel stocks and an international dispute
that lasted several years and which has only recently been resolved –
though this respite may only be temporary.
“Unless we find ways to adapt
quota agreements speedily and efficiently, we are going to see a lot
more disputes like this one in future,” Roberts said.
This point is highlighted in the study led by Pinnegar, which
revealed that anchovy stocks are now spreading along the south coast of
England.
Talks are taking place to determine whether French or Spanish
boats can fish for these – on the grounds that these stocks are
extensions of existing populations from the south.
Others argue that the
new anchovy stocks are a separate population that is only now
rebounding in numbers thanks to greatly improved climatic conditions,
and that French and Spanish boats should be allowed only restricted
access to them.
The “anchovy wars” are looming, it would seem.
In addition to overfishing and warming sea temperatures, marine
creatures face a further danger: ocean acidification.
Increased amounts
of carbon dioxide, pumped into the atmosphere from cars and factories,
are being absorbed by the oceans, making their waters more acidic.
The
impact on coral reefs, which provide homes to thousands of different
species of fish, is already being felt.
Last year, it was reported that a
rare underwater heatwave, combined with an increase in ocean acidity,
had destroyed swaths of Australia’s Great Barrier Reef.
This has led marine biologists to warn that all coral reefs risk
being destroyed by the end of the century even if carbon dioxide
emissions are kept to relatively low levels in future decades.
Apart
from the impact on one of the world’s greatest natural wonders, the
effect on fish stocks, and in particular shellfish, could be grim.
Shells of marine creatures are made from calcium carbonate and their
formation is disrupted by acidic water.
Climate Change Hits Home - Warming Waters, Fewer Fish
This video shows how climate change is causing waterways to warm, eroding fish populations from the Pacific Northwest to the Midwest and Maine.
A warming world means warmer waters, threatening the livelihood of our fishermen, our traditions, and what we can serve on our dinner tables.
An example is provided by oyster farms on the Oregon coast.
These
farms regularly suffer from upwellings of acidic water from deep regions
of the Pacific.
When this happens, larval oysters die at the point when
they have to form their first shells.
“From the time eggs are
fertilised, Pacific oyster larvae precipitate roughly 90% of their
bodyweight as calcium carbonate shell within 48 hours,” George
Waldbusser at Oregon State University told the Climate News Network.
“They must build their first shell quickly on a limited amount of energy
– and, along with the shell, comes the organ to capture external food.
It becomes a death race of sorts.
Can the oyster build its shell quickly
enough to allow its feeding mechanism to develop before it runs out of
energy from the egg?”
Increasingly, the answer to this question appears to be no.
This point is summed up by Roberts.
“Prawns, lobsters, clams and
scallops – which now dominate our intensively fished seas – all lay down
carbonate shells.
The fishing industry is therefore badly exposed to
risk from more acidic seas.
Not only that, acidification threatens the
important role that filter-feeding shellfish play in cleansing ocean
water.
Quite frankly, increased acidity is the last thing marine life
needs given all of the other ways in which we are making oceans a
tougher place to live.”
And then there is question of just how much seafood is actually eaten
today.
This turns out to be an issue of considerable controversy, one
that was stoked last year in a study – by Daniel Pauly and Dirk Zeller
of the University of British Columbia – that was published in the Nature
Communications online journal.
It indicates that the UN’s Food
and Agriculture Organisation (FAO) has seriously underestimated the
world’s appetite for fish and miscalculated global annual catches.
The
FAO – using figures provided by individual governments – had suggested
that annual catches began rising significantly over the 20th century,
peaked at 96m tonnes in 1996 and have been declining slowly since then –
largely due to the fact that fish stocks had been so seriously
overfished.
Pauly and Zeller put the annual “peak fish” figure for 1996 at 130m
tonnes while adding that levels have fallen off far more dramatically
and worryingly as stocks have become depleted at a rate that is far
sharper than realised previously.
In other words, far more fish –
millions of tonnes – is being taken from the seas than has been recorded
by official statistics.
This extra annual catch is made up by
small-scale and subsistence fisheries and fish thrown back in the sea as
discards, according to Pauly and Zeller.
What is particularly worrying about this discovery is the sharp rate
of decline of fish catches in recent years.
Despite sending out more
boats, fitted with advanced fish detection technologies, fishermen are
unable to catch as much as they used to.
Nor do Pauly and Ziller anticipate that it will stop.
“I expect a
continued decline because I don’t expect countries to realise the need
to rebuild stocks,” Pauly told the Guardian.
“I don’t see
African countries, for example, rebuilding their stocks, or being
allowed to by the foreign fleets that are working there, because the
pressure to continue to fish is very strong.
We know how to fix this
problem but whether we do it or not depends on conditions that are
difficult.”
It is against this grim background that the world’s oceans are
warming significantly, with temperature rises of several degrees being
forecast by the end of the century.
Inexorably, fish stocks will be
pushed further towards high latitudes, confusing attempts to manage and
to protect them, while the make-up of local fisheries will undergo
drastic changes.
The stress on one of the world’s most important
resources is going to be intense.
The great fish migration has begun. Links :
Climate change research relies on models to better understand and predict the complex, interdependent processes that affect the atmosphere, ocean, and land. These models are computationally intensive and produce terabytes to petabytes of data. Visualization and analysis is increasingly difficult, yet is critical to gain scientific insights from large simulations. The recently-developed Model for Prediction Across Scales-Ocean (MPAS-Ocean) is designed to investigate climate change at global high-resolution (5 to 10 km grid-cells) on high performance computing platforms. In the accompanying video, we use state-of-the-art visualization techniques to explore the physical processes in the ocean relevant to climate change. This project exemplifies the benefits of tight collaboration among scientists, artists, computer scientists, and visualization specialists.
The global ocean is the Earth's heating and cooling system, pushing
balmy tropical waters toward the poles and bringing back colder,
nutrient-rich waters.
But modeling this system is extremely complex,
resulting in billions of data points.
To tackle the complexity, researchers at three Princeton-area
institutions have transformed complex modeling data into an easily
understandable animated movie showing how ocean temperatures and
saltiness change over time.
The animation could help climate researchers
explore how factors such as rising carbon dioxide levels alter the
ocean's ability to transport heat.
A new video animation demonstrates the power of data visualization
techniques to make sense of vast amounts of information.
The animation,
which reveals how ocean temperatures and salinity change over the course
of a year, is based on data from global climate models.
These models
aid our understanding of the physical processes that create the Earth's
climate, and inform predictions about future changes in climate.
"People are working with increasing amounts of data in all areas of
science, and they need better ways to evaluate their results," said
Feibush, who divides his time between PPPL and PICSciE.
"The techniques
we developed are being applied to climate modeling but the methods can
be used for other complex data sets that change over time," he said.
Data visualization techniques make it easier to comprehend
information, spot trends and even identify mistakes, Feibush said.
"Visualization helps us to understand complexity — it is more than just a
pretty picture."
Hindcast of the peak of the 2008 hurricane season, one of the most active on records, simulated by an FV3-powered GFDL model at 13-km resolution.
FV3 improves representation of small-scale weather features such as hurricanes while maintaining the quality of large-scale global circulation.
Matthew Harrison, a climate scientist at GFDL, worked with Feibush to
adapt results of climate models into formats that could be used to
generate the animation.
Climate models are computer programs that combine real-world
observations of temperature, salinity, rainfall amounts and other
factors with physical laws.
The models can help researchers better
predict long-term climate changes and short-term weather forecasts.
"Understanding how heat moves through the ocean is essential for
predicting the behavior of the climate we experience on land," Harrison
said.
The process starts when tropical waters soak up the sun's heat.
Ocean
currents push heated water toward the poles, warming not only the
northern and southern oceans but also the air and land.
This "ocean heat
engine" makes northern Europe considerably more habitable than it
otherwise would be.
In the North Atlantic, warm water from the tropics rides the
Gulfstream extension northward toward the Norwegian Sea and mixes with
cold water from the Arctic.
Cold water is denser than warm water, so the
mixed water sinks and makes its way eventually southward, bringing
nutrients to fisheries off the coast of North America.
The water's saltiness, or salinity, plays a significant role in this
ocean heat engine, Harrison said.
Salt makes the water denser, helping
it to sink.
As the atmosphere warms due to global climate change,
melting ice sheets have the potential to release tremendous amounts of
fresh water into the oceans.
Climate visualizations can help researchers
see how the influx of fresh water affects global ocean circulation over
time.
The animation reveals how factors like evaporation, rainfall and
river runoff affect salinity. For example, the Mediterranean Sea, which
lies in an arid region and has only a narrow outlet, is much saltier
than the nearby Atlantic Ocean.
In contrast, over 250 rivers flow into
the Baltic Sea between mainland Europe and Scandinavia, so the sea is
about seven-times less salty than the Atlantic Ocean.
One of the special aspects of this video animation is its high
resolution, Harrison said.
The simulation's resolution is six million
pixels, which is like dividing up the world's ocean surface into a grid
consisting of six million sectors.
Each sector corresponds to an ocean
area of about 10 kilometers on each side.
The model calculates the
temperature and salinity for each sector, which becomes a pixel, or a
colored spot on the screen.
In the real world, weather conditions change from moment to moment.
To capture this variability, GFDL's climate models incorporate weather
conditions collected from ground stations and satellites to update the
model hourly with near-surface wind speeds, temperature, rainfall and
solar radiation.
The calculations run on supercomputers at Oak Ridge National Laboratory in Tennessee.
"There is an art to handling large amounts of data," said Whit
Anderson, deputy director of GFDL and himself an oceanographer.
"You
cannot just brute-force the large and complex data produced at
facilities like GFDL and PPPL through a commercial product.
"The increase in the amount of data is due to our better
understanding of climate and weather," Anderson continued.
"These large
amounts of data in turn are giving us improved skill in predicting
future climate and weather."
The video animation could help climate researchers explore how factors
such as rising carbon dioxide levels alter the ocean's ability to
transport heat.
(Photo by Nick Donnoli, Office of Communications)
Student involvement
Feibush credits the project's success to
his student interns, some who started on the visualization project at
PPPL while in high school.
"Without the students, this wouldn't have
happened," Feibush said.
One of these students, Matthew Lotocki, started working with Feibush
while a senior at the Bergen County Academy for Technology and Computer
Science, a public magnet high school in New Jersey.
"It was an amazing opportunity," said Lotocki, a member of
Princeton's Class of 2017.
"You get to work with cutting-edge computer
clusters and systems, really interesting projects, and with a mentor who
teaches you how to make the tools to create really cool
visualizations."
One of the challenges was figuring out how to combine different types
of computer processors to work on the task.
Today's scientists often
take advantage of the power of video-game graphics processing units
(GPUs) to do their computations.
Lotocki had to get the GPU to do the
calculations and generate the graphics on the screen.
Another student
intern, Michael Knyszek, who attends the University of
California-Berkeley and who had an internship with Feibush as part of
the Department of Energy Science Undergraduate Laboratory Internship
program, programmed the GPU to combine layers of data.
The developers made the video animation look more realistic by
incorporating NASA satellite data of the changing colors of the terrain
to show typical seasonal changes.
Zachary Stier, Princeton Class of
2020, also worked on the project as a student at the Bergen Academies.
"A lot of the challenge was figuring out the right tools to address the
questions we had at hand," Stier said.
"There were some tasks for which
there was no documentation for what we wanted to do."
The experience working at PPPL was one of the factors that influenced
Stier's decision to come to Princeton.
"I am much more able to look at a
problem and do the research into what tools are available to attack the
problem," he said.
The consortium combines three institutions, each with a different
research focus. Princeton University is home to expert scientists in a
wide range of disciplines.
Scientists at PPPL, which is managed by
Princeton University, are developing fusion energy, which involves
creating charged gases known as plasmas in a confined reactor for safe
and abundant sources of electricity. GFDL's expertise is climate
modeling.
"Our organizations all work on very different things but one thing
that we all have in common is the need to visualize large and complex
data," Anderson said.
Funding was supplied by the U.S. Department of Energy and the National Science Foundation.


