Saturday, April 28, 2012

Sailing fast on a Figaro - 35kts - rough weather

Jean-Pierre Nicol sailing around Porquerolles with 35 knots of wind.

>>> geolocalization with the Marine GeoGarage <<<< 


The french skipper Corentin Douguet sailed his Figaro Beneteau in 55 knots wind

Friday, April 27, 2012

Chasing ice: could time-lapse photography save the planet?


From Time

The Extreme Ice Survey, an artistic and scientific project founded by award-winning photographer James Balog, has 27 cameras pointed at 18 glaciers around the world.
Together, they snap 8,000 frames worth of time-lapse footage per year.
Thus the Extreme Ice Survey (EIS) is able to capture alterations to the arctic environment—changes that might seem to be slow, glacially so, are rendered dramatic.
Almost equally dramatic was the organization’s beginning, which is documented in a film called Chasing Ice, now screening at South by Southwest.

Rappelling into Survey Canyon, looking down at moulin channel dropping meltwater 2,000 vertical feet into crevasses through the Greenland Ice Sheet. EIS director James Balog is shown.

Between equipment unable to withstand the icy conditions and a faulty timer in an early camera, the project had a difficult start.
“I thought I was going to buy off-the-shelf parts and I was naïve about the hardware. I ended up designing custom stuff,” Balog says.
“We had a lot of money on the line, we had a lot of plans on the line, a lot of people on the line.”

It took months of trial and error, but their system of Nikon D200 DSLR cameras, solar panels, batteries, heavy-duty tripods, waterproof cases and wind-proof anchors is now reliable.
Some of the cameras are checked on and their images downloaded only once a year.

Balog’s initial attraction to the ice was one of aesthetics—“the sculpture, the beauty, the light, the form, the color,” he says—and a forthcoming photo book from EIS will showcase those facets of the glaciers.
But the technology innovated by Balog and his team doesn’t just allow EIS to take those pictures: the Survey aims to put them to good use.
Balog, who had been a skeptic about climate change until about 20 years ago, says that seeing the evidence of climate change may make a difference where human stubbornness otherwise persists.
He takes a zen perspective on change, believing that whatever landscape is underneath the glaciers, to be revealed by their melting, will also be perfect in its own way, but says he is disheartened by the extent to which people refuse to recognize their place in causing that change and its inevitable climatic, political and military consequences.


Photographer James Balog shares new image sequences from the Extreme Ice Survey, a network of time-lapse cameras recording glaciers receding at an alarming rate, some of the most vivid evidence yet of climate change.

“The deeper I got into it, the more I realized that our aesthetics were the pathway to communicate the science effectively, the knowledge base that the scientists had,” Balog says.
“The visual information can only be part of the puzzle but that’s the piece of the puzzle that I know how to put in the board.”

The footage from Chasing Ice dates back to the very beginning of the project.
At the time, Balog predicted he would want to have it on film but had no definite plans in mind.
It was not until 2009 that Jeff Orlowski, who had begun as an unpaid assistant cameraman for EIS, asked Balog for the rights to put the video to use.
The resulting film, directed by Orlowski, was given the Excellence in Cinematography Award at the 2012 Sundance Film Festival and has been acquired for TV broadcast by the National Geographic Channel.

Although Balog was not involved in the film’s production, he sees it as a part of the larger mission of EIS.
“I hope this becomes part of the wake-up call that will jostle people out of their intellectual hibernation,” he says, “and at the same time, if you stand back from all of that and you just look at the incredible beauty of what we’ve been shooting the past six years, it’s mind-boggling.”

Thursday, April 26, 2012

Visualizing ocean shipping

100 years of ship paths in the seas :
This shows mostly Spanish, Dutch, and English routes--they are surprisingly constant over the period (although some empires drop in and out of the record), but the individual voyages are fun.
And there are some macro patterns--the move of British trade towards India, the effect of the American Revolution and the Napoleonic Wars, and so on.

 From SpatialAnalysis

I recently stumbled upon a fascinating dataset which contains digitised information from the log books of ships (mostly from Britain, France, Spain and The Netherlands) sailing between 1750 and 1850.


The creation of this dataset was completed as part of the Climatological Database for the World’s Oceans 1750-1850 (CLIWOC) project.
The routes are plotted from the lat/long positions derived from the ships’ logs.
I have played around with the original data a little to clean it up
(I removed routes where there was a gap of over 1000km between known points, and only mapped to the year 1800).
As you can see the British (above) and Spanish and Dutch (below) had very different trading priorities over this period.


What fascinates me most about these maps is the thousands (if not millions) of man hours required to create them.


 A looped visualization of all the voyages in the Climatological database for the world's oceans as if they occurred in the same year, to show seasonal patterns in ship movements and predominant shipping lanes from 1750 to 1850.

Today we churn out digital spatial information all the time without thinking, but for each set of coordinates contained in these maps a ship and her crew had to sail there and someone had to work out a location without GPS or reliable charts.


Contrast that with this map of cargo ships (bigger than 10,000 gross tonnage) during ONLY 2007 :


Routes, ports and betweenness centralities in the GCSN.
(a) The trajectories of all cargo ships bigger than 10 000 GT during 2007.
The colour scale indicates the number of journeys along each route.
Ships are assumed to travel along the shortest (geodesic) paths on water. 
(b) A map of the 50 ports of highest betweenness centrality and a ranked list of the 20 most central ports.

Links :

Wednesday, April 25, 2012

Cryosat mission's new views of polar ice

 
 This animation, generated using data from ESA's CryoSat satellite, shows changes in Arctic sea-ice thickness between October 2010 and March 2011.
Every year, the Arctic Ocean experiences the formation of vast amounts of floating ice during the winter months, and melting during the summer months.
(Note: due to the satellite's 92° inclination, a small area around the north pole is not observable)
credit: CPOM/UCL/ESA/Planetary Visions

From BBC

Europe's Cryosat mission is now watching the ebb and flow of Arctic sea ice with high precision.

The radar spacecraft was launched in 2010 to monitor changes in the thickness and shape of polar ice..Scientists have spent the past two years getting to grips with its data.
And on Tuesday, they reported that Cryosat was now delivering an unprecedented view of the seasonal growth and retreat of sea ice spanning the entire Arctic basin.
The researchers also released a map showing the difference in height across the Greenland ice sheet.

"The message is that Cryosat is working extremely well.
Its data are very reliable and the measurements we have match reality," said Prof Volker Liebig, the director of Earth Observation at the European Space Agency (Esa).
"We now have a very powerful tool to monitor the changes taking place at the poles," he told BBC News.
The Esa director delivered an update on the mission at London's Royal Society.
The information was also being released here at the European Geosciences Union (EGU) meeting in Vienna, Austria.

Several satellites have already detailed the recent and rapid erosion of summer sea ice extent as the Arctic has warmed.

But Cryosat's innovation has been to provide a means to get at a figure for ice volume - a far more significant number in terms of understanding the long-term viability of the ice.

To do this, the satellite carries one of the highest resolution synthetic aperture radars ever put in orbit.
The instrument sends down pulses of microwave energy which bounce off both the top of the ice and the water in the cracks, or leads, which separate the floes.
By measuring the difference in height between these two surfaces, scientists can, using a relatively simple calculation, work out the overall volume of the marine cover.

The Cryosat team, led from University College London, has spent the period since launch working through the satellite's measurements, validating and calibrating them against a number of independent observations.
These include data from plane-borne instruments, from direct on-the-ice assessments, and even from scientific sea-floor moorings that profile the ice floes as they pass overhead.
"We can now say with good confidence that Cryosat's maps of ice thickness are correct to within 10-20cm," said Dr Seymour Laxon, from UCL's Centre for Polar Observation and Modelling (CPOM).

Tuesday's release shows a complete seasonal cycle, from October 2010, when the Arctic Ocean was beginning to freeze up following the summer melt, right through to March 2011, when the sea ice was approaching peak thickness.
Cryosat found the volume (area multiplied by thickness) of sea ice in the central Arctic in March 2011 to have been 14,500 cubic kilometres.

This figure is very similar to that suggested by PIOMAS (Panarctic Ice Ocean Modeling and Assimilation System), an influential computer model that has been used to estimate Arctic sea ice volume, and which has been the basis for several predictions about when summer sea ice in the north might disappear completely.

In addition to the announcement on sea ice, the Cryosat team also published a digital elevation model (DEM) of Greenland.
The big island, too, has experienced some rapid changes of late and is losing tens of billions of tonnes of its ice cover to the ocean annually.
The DEM is a map of varying height, and the visualisation on this page incorporates a year's worth of data.


How to measure sea-ice thickness from space
Cryosat's radar has the resolution to see the Arctic's floes and leads
Some 7/8ths of the ice tends to sit below the waterline - the draft
The aim is to measure the freeboard - the ice part above the waterline
Knowing this 1/8th figure allows Cryosat to work out sea ice thickness
The thickness multiplied by the area of ice cover produces a volume

For Cryosat, it is another illustration of its capability.
Radar satellites have traditionally struggled to discern the detail in the steep slopes and ridges that mark the edges of ice sheets, but the Esa spacecraft can recover far more information thanks to a special interferometric observing mode that uses two antennas.

"This is really the first demonstration of the interferometer in action," said Prof Andrew Shepherd from Leeds University.
"The DEM contains about 7.5 million data points, and we're pretty confident this will be the best elevation model for Greenland, by some margin. Our next step is to compare it to previous data to see how Greenland has changed."

Cryosat's principal investigator, Prof Duncan Wingham - formerly of UCL but now chief executive of the UK's National Environment Research Council - summed up: "We have years of data to come, but I think it's quite clear that we will provide synoptic, accurate, Arctic-wide thickness; and that we will be able to determine the accuracy of the predictions of when the Arctic will be ice-free in Summer.

"And I think it's also clear we can now sustain coverage of [ice sheets on Antarctica and Greenland] right down to the coast."

The Cryosat update was timed to coincide with this week's 50th anniversary of UK activity in orbit.
April 1962 was the month Britain became a space-faring nation with the launch of its first satellite, Ariel-1.
As part of the celebration, current capabilities and missions with strong UK interest are being highlighted.

Tuesday, April 24, 2012

No protocol ready for Deepwater oil spill

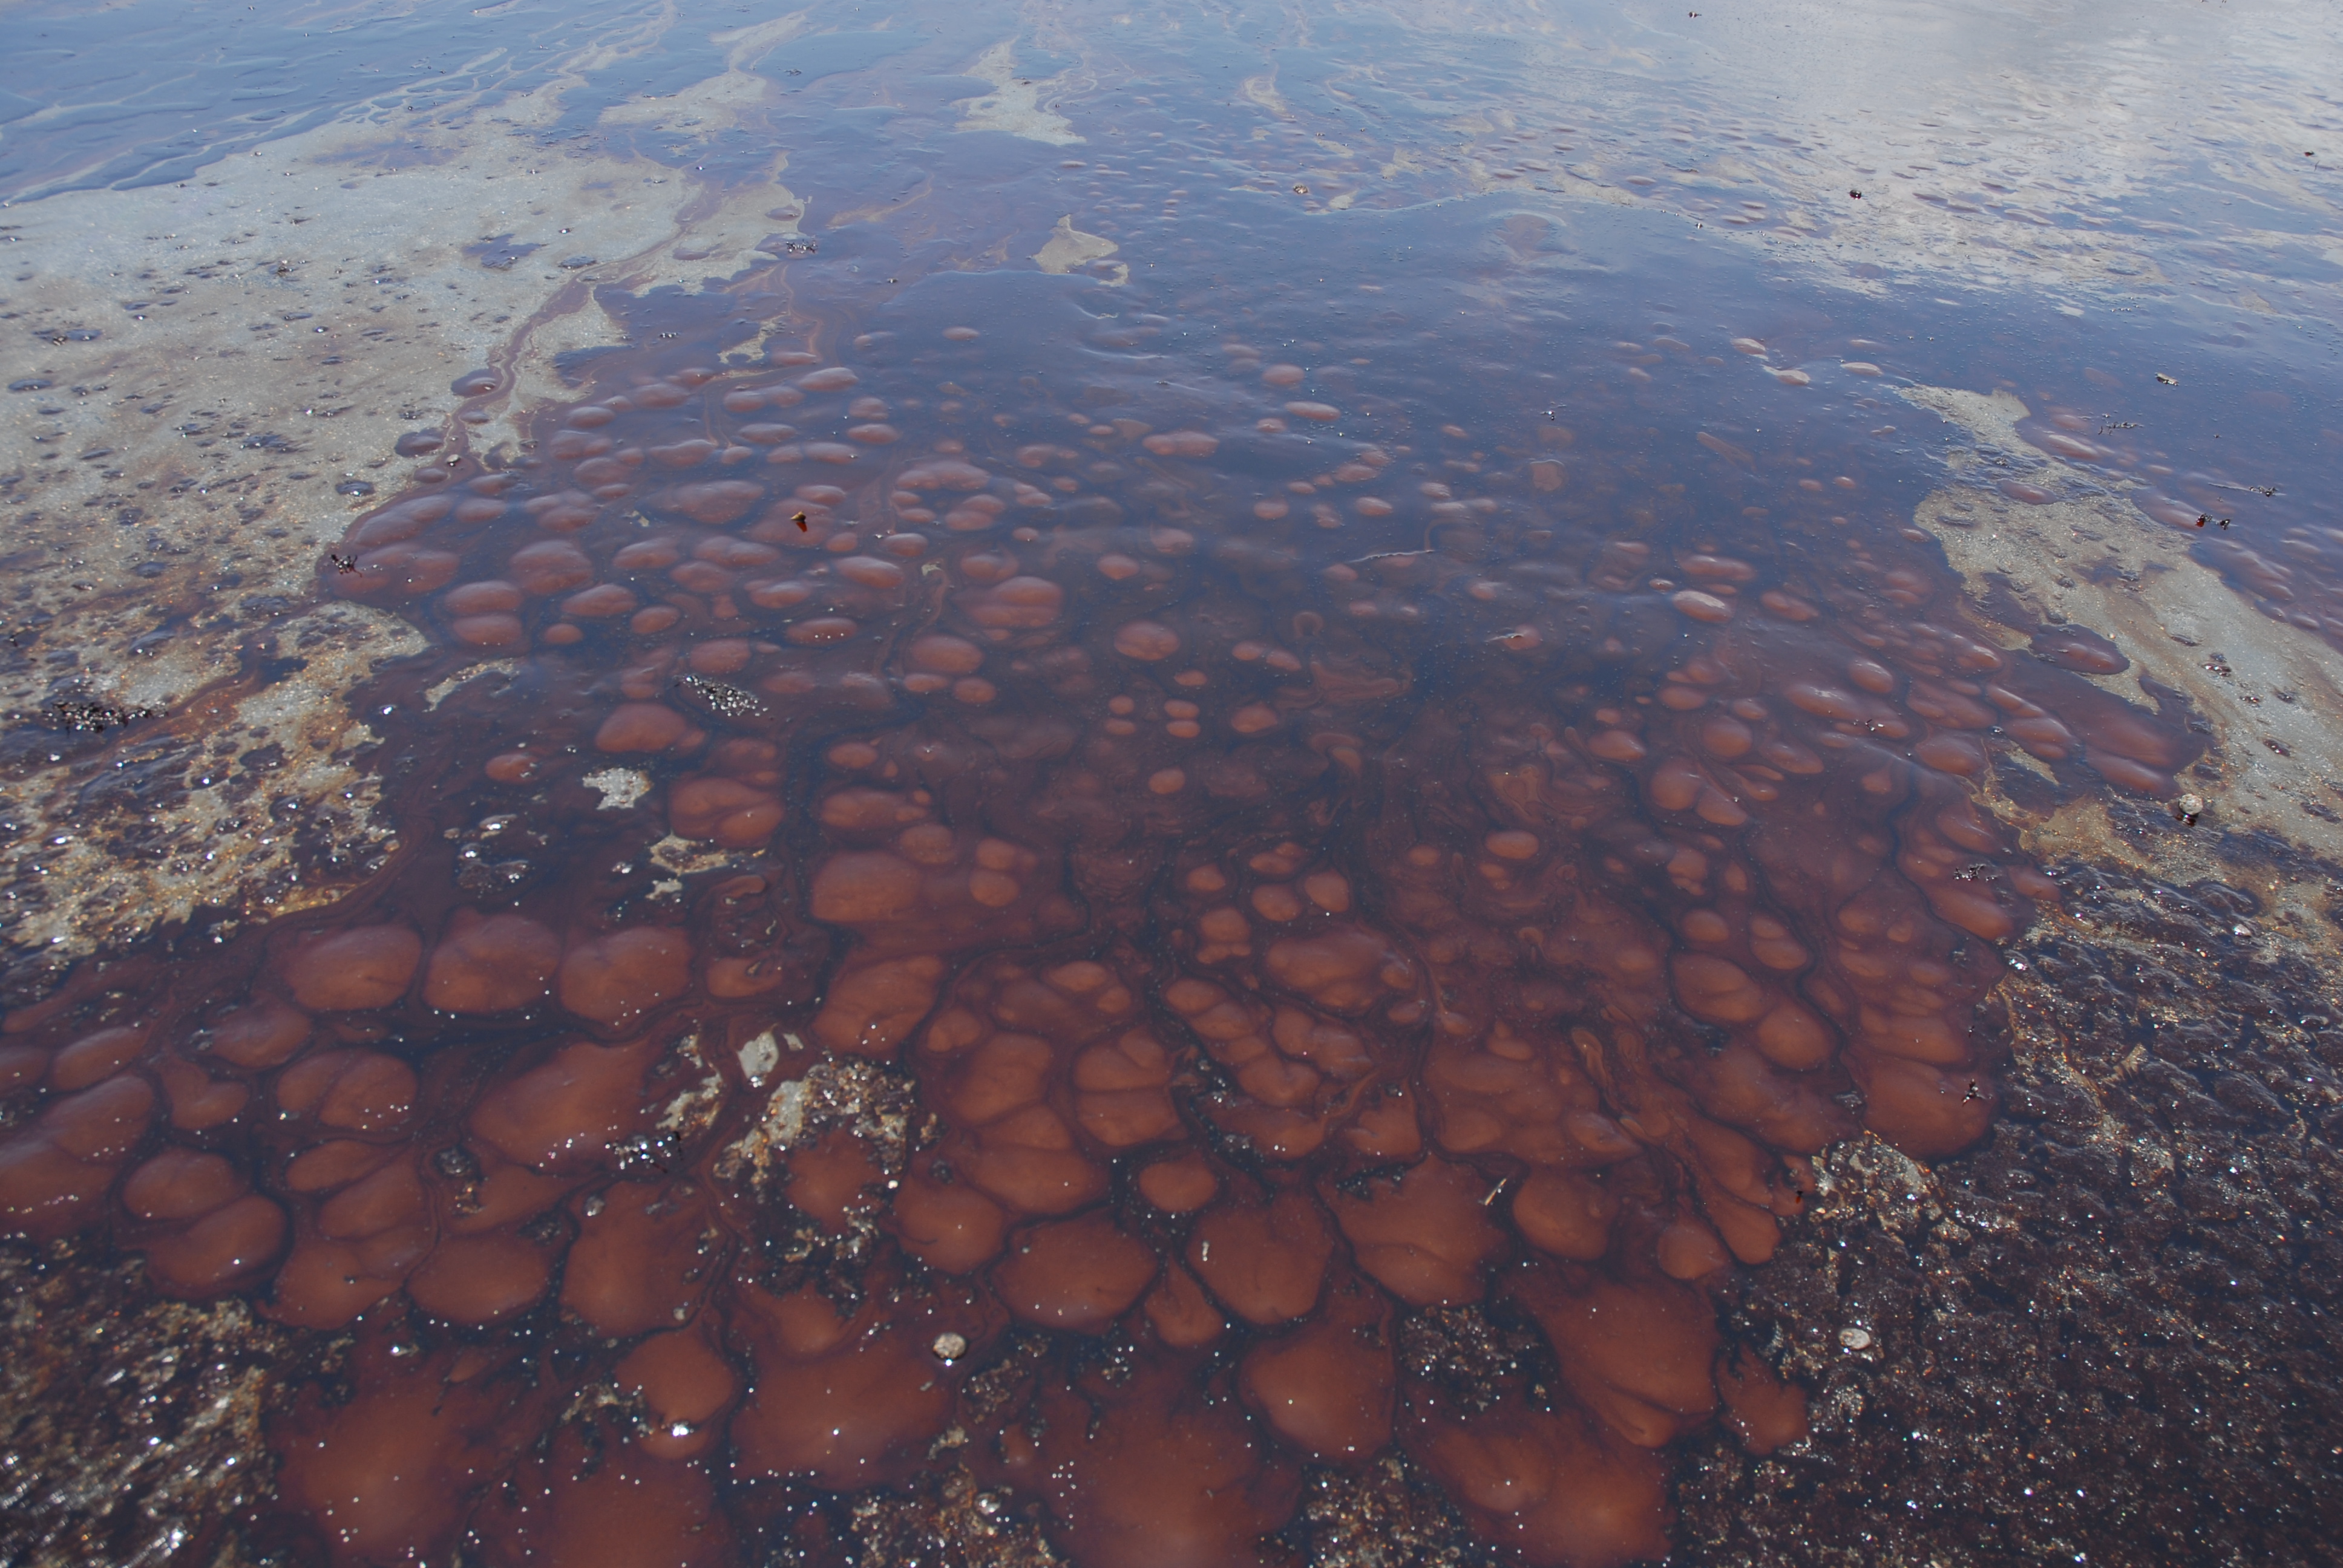
"The old model assumed that oil would simply float up to the surface and accumulate there and along the coastline," says co-author Sean Anderson.
"That model works well for pipeline breaks and tanker ruptures, but it is inadequate for this novel type of deep blowout."
(Credit: Louisiana GOHSEP/Flickr)

From Futurity

Scientists have created the first complete conceptual model for understanding the Deepwater Horizon oil spill and any similar disasters in the future.

On the second anniversary of the Deepwater Horizon oil platform blowout, a national panel of researchers is providing new insight into what happened in the disaster, as well as a guide for how to deal with such events in the future, and why existing tools were inadequate to predict what lay before them.


The study, produced by the Gulf Oil Spill Ecotox Working Group at University of California, Santa Barbara’s National Center for Ecological Analysis and Synthesis (NCEAS), is published in the May issue of the journal Bioscience.
“The old model assumed that oil would simply float up to the surface and accumulate there and along the coastline,” says co-author Sean Anderson, an associate professor at California State University Channel Islands.
“That model works well for pipeline breaks and tanker ruptures, but it is inadequate for this novel type of deep blowout.”


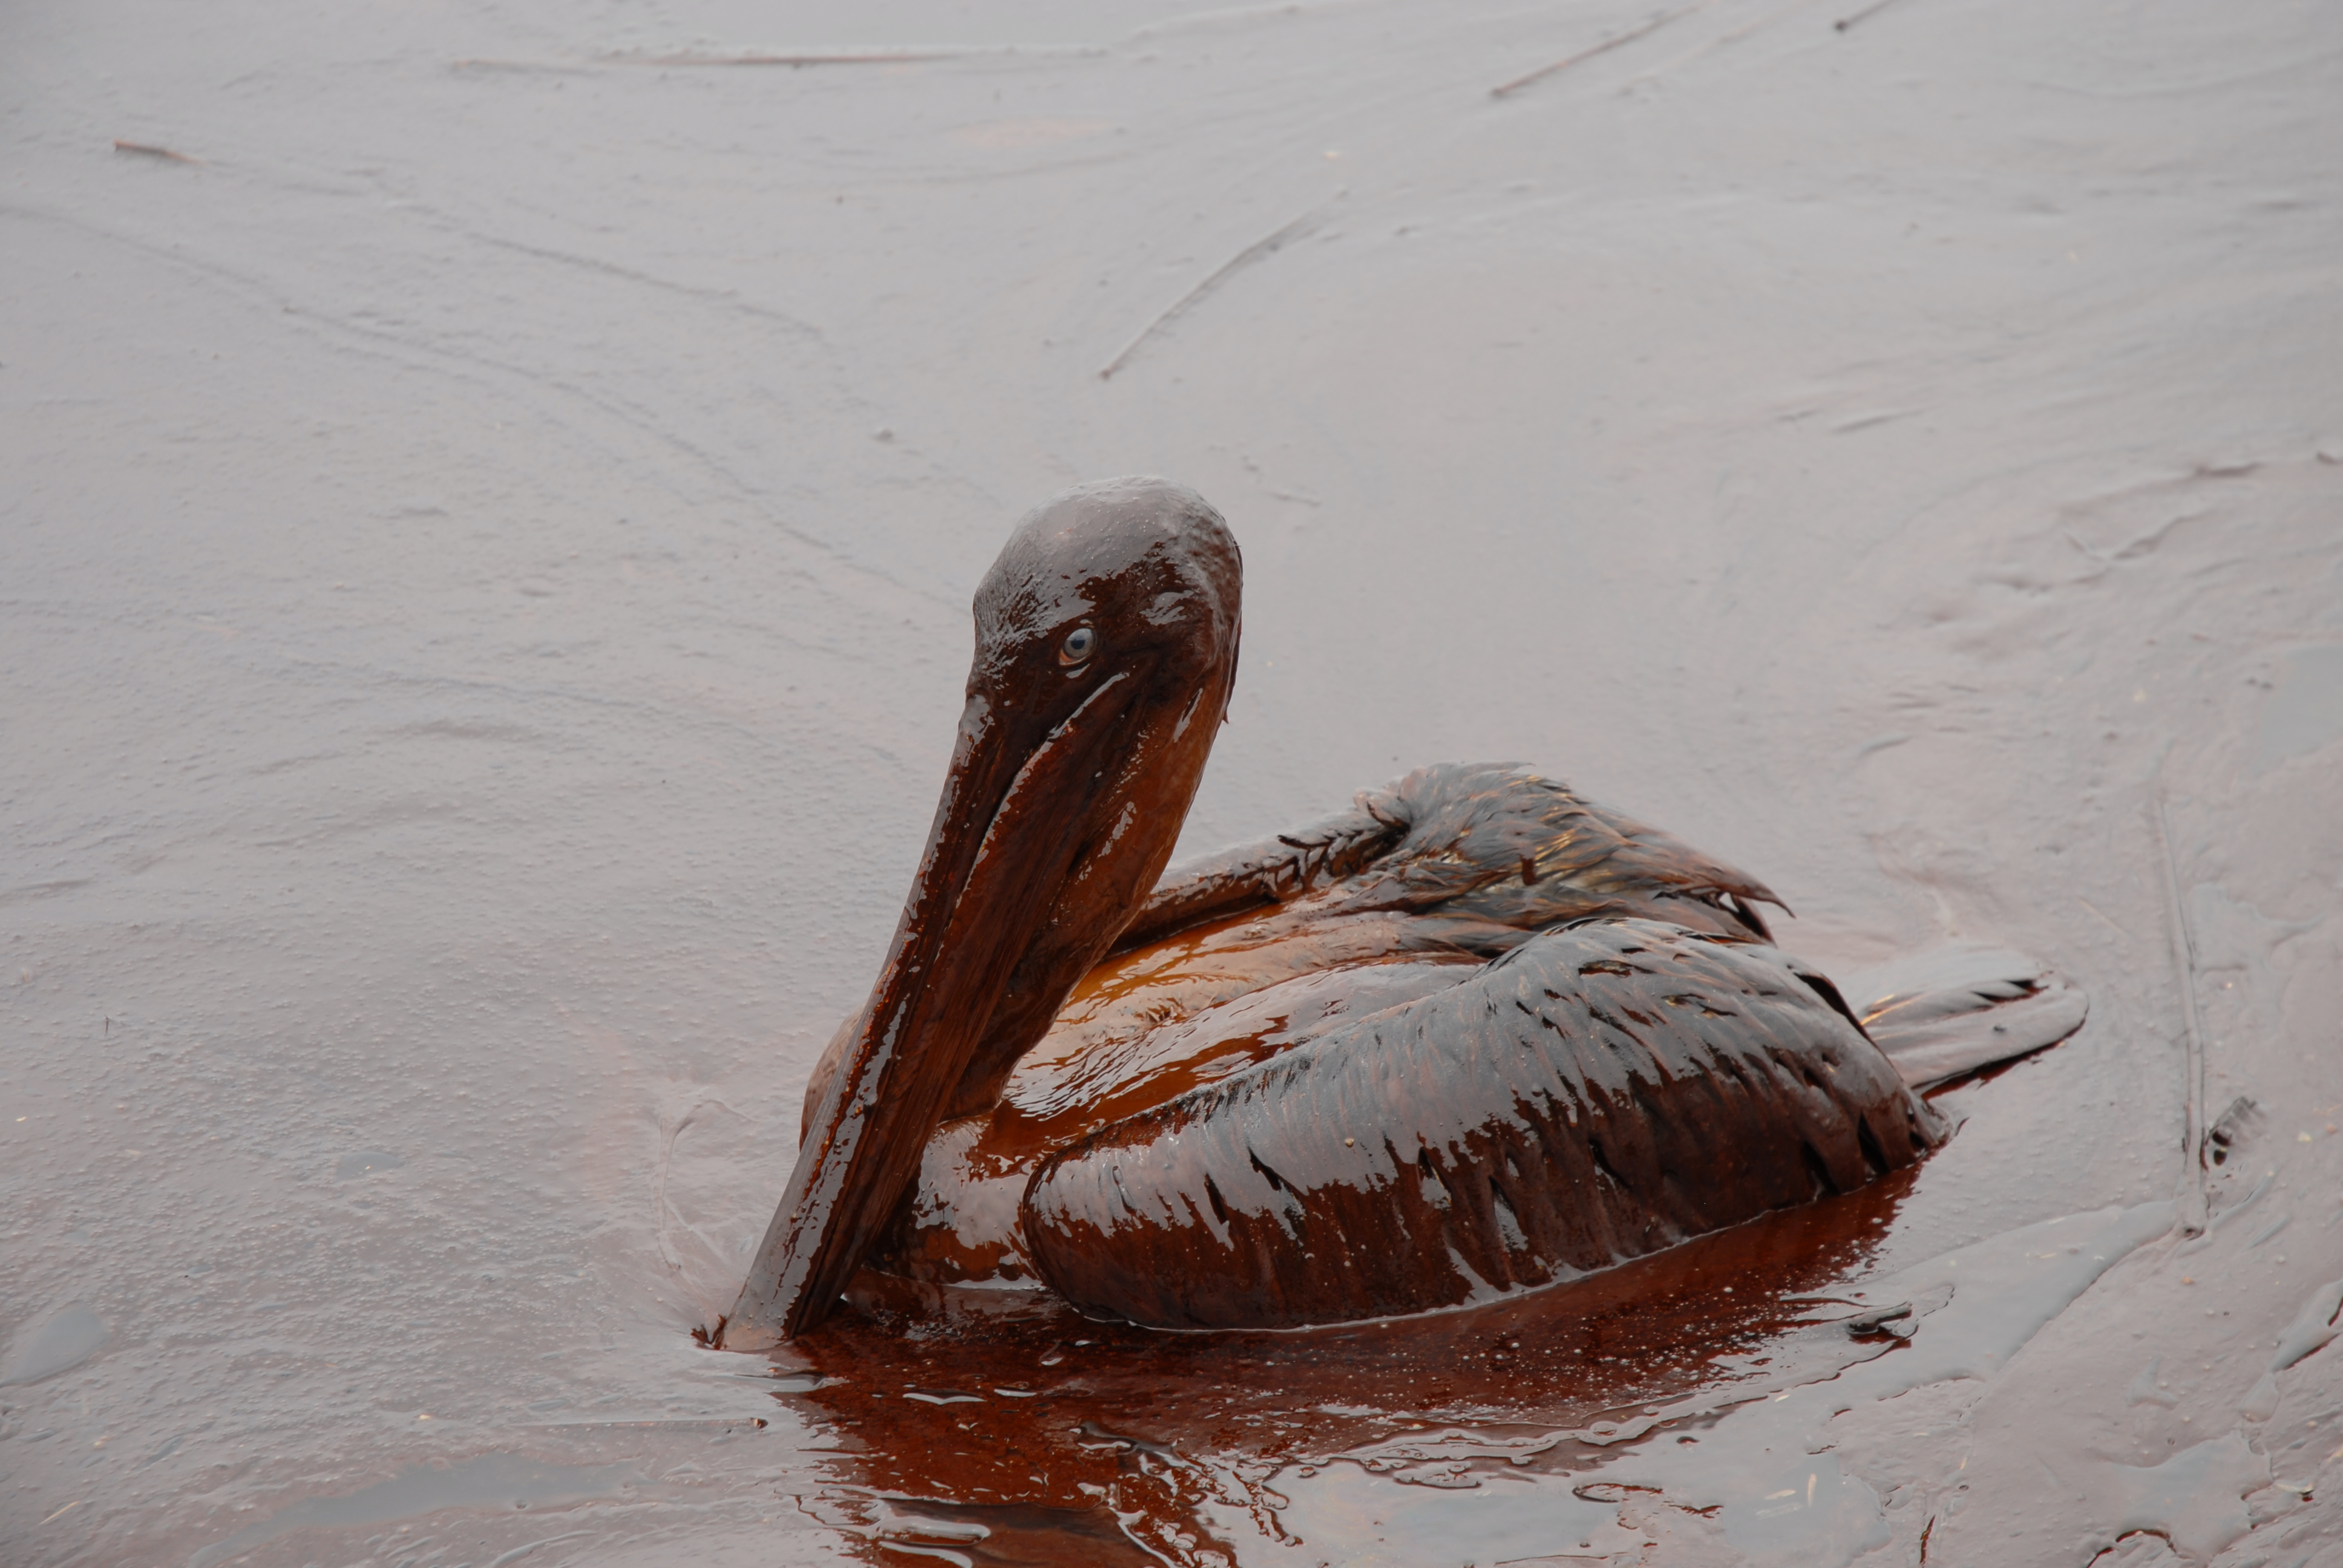
Panel A depicts the traditional model for crude oil fate and effects that prevailed before the DWH blowout, based on synthesis of experience with nearshore maritime spills in shallow water, and panel B shows the newly emerging and still developing model of a deepwater blowout like the DWH.
(Credit: UCSB)

The 2010 Deepwater Horizon oil spill in the Gulf of Mexico was unlike any oil spill science and society had encountered.
The blowout occurred at unprecedented depths and released enormous quantities of oil (an estimated 4.9 billion barrels, or 206 million gallons).
Marine and wildlife habitats suffered major damage, and, according to authors, the damage continues to happen today, out of sight.
Local and regional economies and livelihoods suffered as well.

According to the researchers—a renowned group of ecotoxicologists, oceanographers, and ecologists who convened under the auspices of NCEAS while the spill was still active—the response to clean up and contain the oil followed a framework that assumed the oil’s behavior would mimic the more familiar shallow-water and surface spills, despite the fact that the dynamics, fate, and effect of deep-water oil on ecosystems are not understood.
“As the Deepwater Horizon spill unfolded, you would hear folks saying things like, ‘We all know what happens when oil and water mix; the oil floats.’
That wasn’t the whole story, and that oversimplification initially sent us down an incorrect path full of assumptions and actions that were not the best possible use of our time and effort,” says Anderson.


A new model

After synthesizing existing knowledge to anticipate the potential ecotoxicological effects of the spill, and highlighting major gaps in scientific understanding, the scientists have created the first complete conceptual model for understanding both the Deepwater Horizon spill and analogous disasters in the future.
This new model accounts for how deepwater oil spills unfold and where the resulting ecological impacts accrue.

It also emphasizes that the vast majority of the oil is retained at depth—rapidly emulsified and dispersed due to the physics of the pressurized oil jetting from the tip of the wellbore—and, among other response actions, calls into question the efficacy of dispersants.
“We have generally hailed the use of (chemical) dispersants as helpful, but really are basing this on the fact we seemed to have kept oil from getting to the surface,” argues co-autho Gary Cherr, director of University of California, Davis’s Bodega Marine Lab.
“The truth is, much of this oil probably was staying at depth, independent of the amount of surfactants we dumped into the ocean. And we dumped a lot of dispersants into the ocean—all told, approximately one-third of the global supply.”

Co-author Ron Tjeerdema, chair of the Environmental Toxicology Department at UC Davis, concurs.
“The problem is, we really must address the downside of such compounds, particularly in light of the fact that the upside probably was not so great as it seemed at the time,” he says.
Armed with a new foundation for research and policy implications, the NCEAS Gulf Oil Spill Ecotox Working Group is calling for further investigation into the long-term effects of deep-water oil spills.
“We now have a sense that the bulk of the impact was probably in the mid-water and deep ocean,” says the study’s lead author, Charles “Pete” Peterson, a professor at University of North Carolina at Chapel Hill, who has been deeply involved in the study of the environmental effects of the Exxon Valdez oil spill for over two decades.
“Who the heck knows what oil does to the mid-water pelagic and deep-dwelling critters?
We need an integrated collaboration between deepwater explorers, modelers, ecotoxicologists, microbial ecologists, and so on—all working together in unprecedented ways.
We need a whole new type of marine ecology.”


Links :
  • Wired : How science failed during the Gulf oil disaster

Monday, April 23, 2012

Redpark ships GPS cable for use with iPad, iPhone, and iPod touch

"App developers now have a simple and reliable way
to communicate with external navigation devices."

From RedPark

Redpark GPS Cable allows customers to connect iPad, iPhone and iPod touch to navigation devices

Redpark Product Development today announced the Redpark GPS Cable that allows customers to connect iPad, iPhone and iPod touch to navigation devices is now available.

The Redpark GPS Cable is a one meter long cable with a male DB-9 connector.
It is designed for use with navigation devices that use the NMEA 0183 communications protocol.

“Customers have told us that they would like to connect their iPhone to navigation devices in a glider, truck, tractor, airplane, or boat," explained Redpark president Mike Ridenhour.
“App developers that serve these markets now have a simple and reliable way to communicate with external navigation devices."

The Redpark GPS Cable - part number C2-GPS - is compatible with iPad, iPad 2, iPhone 4S, iPhone 4, iPhone 3GS and iPod touch (4th generation).
see GPS cable mobile free App

The cable is compatible with location aware iOS apps, including the Maps and Compass apps that are standard on iOS devices.
It supports data rates up to 57.6 Kbps and requires iOS 5.0.x or later.
See FAQ.

The Redpark GPS Cable has an MSRP of $59 and is available today.
Further information about the cable and points of purchase is available at:
http://www.redpark.com/c2gps.html


Filming the forgotten resistance at sea

From The Guardian

Allan Sekula photographer's new film, about global maritime trade, has been hailed by Occupy activists. Its maker has spent a life challenging new forms of capitalism.

Water has always played a large part in the photographer Allan Sekula's life.
As a student in San Diego at the end of the 1960s, he used to wander downtown and gaze up at the flophouse hotels through whose windows he could see money being exchanged between prostitutes and sailors
"It was Edward Hopper on military steroids," he recalls.
"That was the time of Vietnam, and there were even mutinies on some ships – especially among African-American sailors who were protesting against racism in the navy.
Young guys my age from the west coast were being dehumanised and turned into a few good men."

They'd come to the fence of the Marine Corps Recruiting Depot and say: 'If I can get over this fence will you meet me at the laundromat down the street in an hour with a car?'
We managed to get some of them out.
But often the shore patrol and navy police would come and pull them away.
They'd be taken to brigs, assigned to a motivation platoon, and beaten up.
The depot was next to an international airport on the waterfront, and some of the recruits were so desperate to escape they'd tried to get away by running across the runways, where they'd be hit by planes and be killed.
This never appeared on the news."

Sekula, who had grown up in the Los Angeles harbour town of San Pedro, was learning that the maritime world, far from being a realm of pleasure cruises and play, was riven by struggle and class conflict.
Since then much of his extraordinary body of experimental work has been devoted to chronicling the social, economic and political dynamics of life on the oceans.
His latest exercise in hydropoetics, a cine-essay entitled The Forgotten Space that he co-directed with Noël Burch, uses the statistic that 90% of cargoes today are carried by ship as its cue to develop a wide-ranging thesis about containerisation, globalisation and invisible labour.

Seas are fascinating, Sekula argues, because of the counter-orthodoxies and refutations they offer to modern political thought. "
In Alain Tanner's Les Hommes Du Port, a documentary about dockworkers in Genoa, he says: 'The time of the sea runs counter to the lie.' He doesn't say what the lie is. But you know: it's everything about neoliberalism. The sea is all about slow time – things move slowly, there's a lot of waiting – and as such it contradicts all the mythologies of instantaneity perpetuated by electronic media."

Sekula believes that seafaring work, like many other forms of manual labour, is ignored by many journalists whose own class status predisposes them towards fixating on white-collar and mental labour.
But, as The Forgotten Space shows to haunting effect, this invisibility is also structural: containerisation has depeopled the bustling port cultures of previous eras and left in their wake automated landscapes.

Sekula, who was born in 1951 and whose grandfather migrated to the US from Poland, thinks that America has a particular amnesia regarding its relation to the sea.
"We've always focused on the frontier hypothesis of US history. In spite of the takeover of the Panama Canal and the annexing of Hawaii, the sequential opening of western space has mainly been seen as a matter of terrestrial dominion. Today the function of the US navy is to protect the sea lanes of the world – that's free trade. And it's America's technical and legal innovations that have made the globalisation of sea trade possible."

This kind of systematic analysis, allied with deep, almost ethnographic research, is also present in Sekula's influential book Fish Story (1995), which he describes as "a sort of experimental essay in words and pictures that sometimes reads like fiction, sometimes like an essay, sometimes journalism, sometimes prose-poetry".
Its photo-text form recalls earlier investigations of immiserated labour such as George Orwell's The Road to Wigan Pier (1937) and James Agee and Walker Evans's Let Us Now Praise Famous Men (1941), both of which Sekula admires."

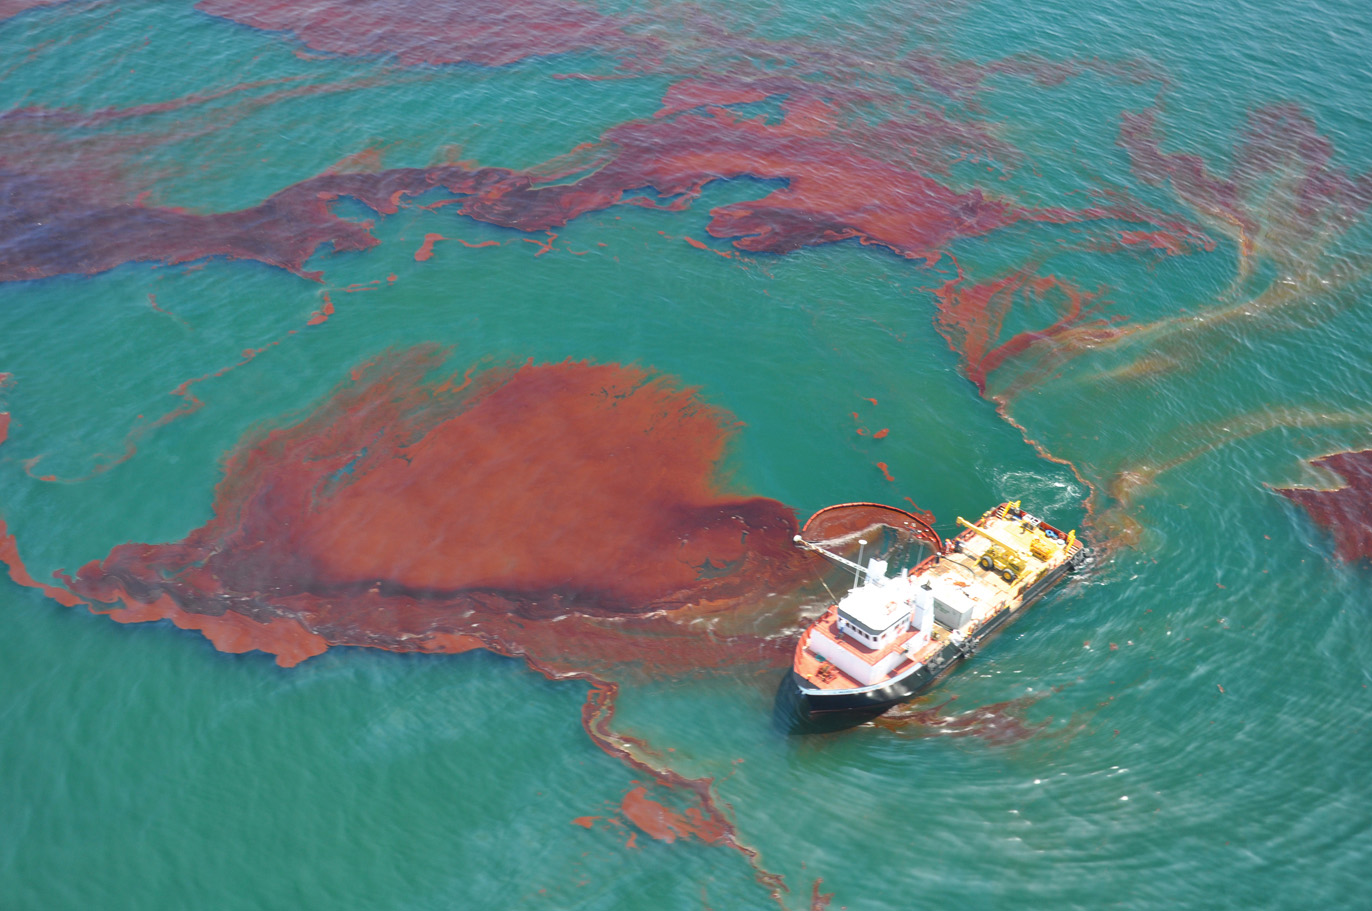
I'm more sympathetic to traditions of critical realism than a lot of people in the art world," he admits.
"They treat journalism as a bad object and always think that when they intervene it's without the naivety of the journalist. That doesn't seem fair to what the best journalism and non-fiction has been."
Sekula's search for what the film historian Edward Dimendberg has called an "honest materiality" is informed by his own upbringing in San Pedro (a working-class town).
His first major work, Aerospace Folktales (1973), featured interviews with his father, a chemical engineer at Lockheed, who had lost his job. "
Being working class gives you a bitter sense that all the promissory notes of the American Dream are rarely cashed in. You see failure and blockages all around you."


At San Diego, he took classes with the Frankfurt School philosopher Herbert Marcuse and conceptual artist John Baldessari, and studied alongside Martha Rosler, who would later come to prominence for her interest in questions of geopolitical infrastructures and social exclusion.
He also read essays on photography by John Berger and Roland Barthes, and as a result began to theorise his future work. "
I wanted to explore the discursive split between art and documentary, the myth of Alfred Stieglitz against the myth of Lewis Hine."
(Stieglitz was a revered figure in the development of art photography. Hine, by contrast, used his camera as a tool in the service of social reform.)

Sekula was sceptical of the romanticism and love of metaphors he discerned in the work of Stieglitz. "
I saw the path of symbolism as one that led to hermeticism or a retreat from the social," he recalls. "
I was trying to defend a critical social realism."
His success at doing this, both in his often-cited study Photography against the Grain: Essays and Photoworks 1973–83 (1984) and recent films such as The Lottery of the Sea (2006), has won him many admirers.
Among them is the American maritime historian Marcus Rediker, co-author with Peter Linebaugh of The Many-Headed Hydra (2000): "The old national stories just aren't making much sense to people any more. Once you start thinking transnationally, you're led to the sea: the ship is the first great instrument of globalisation.
Allan's idea that you can observe the compression of time and space in the modern world from the decks of a containerised cargo vessel is brilliant."

It's certainly an idea that has considerable potency in the present climate, when growing numbers of people all around the world are questioning the capitalist orthodoxies they've been fed by economists and politicians.
In Barcelona last year, a gallery that screened The Forgotten Space was visited by many of the indignados who were protesting nearby.
In Oakland, Occupy activists planned to show a pirated version of the film on a temporary screen they installed after blocking some of the streets in the port area.

This kind of resistance reminds Sekula that his collaborator Noël Burch had "hoped the film could 'be completed by other means – and of necessity it would have to be completed by different means'.
He meant by self-organised political means on the part of the people.
The sea has often been thought of as recuperative; that more and more dockers and working people are insisting on not being moved on or not being swept away by the forces of efficiency and rationalisation gives me grounds for optimism."


Links :

  • Afterall : Material Resistance: Allan Sekula's Forgotten Space
  • Stills : Ships fools

Sunday, April 22, 2012

Sea creatures' true beauty revealed in underwater photos

This amazing jellyfish photograph received nearly half of the 1,221 online votes in the underwater photography contest.
The photo was taken by Todd Aki from Florida.

From LiveScience

A dashing-red sea slug that seems to be hamming it up for the camera in the U.S. Virgin Islands has come into focus in this year's winning underwater photograph in an annual contest put on by the University of Miami Rosenstiel School of Marine & Atmospheric Science.


More than 700 images were submitted for this year's underwater photography contest, Ximena Olds' photo of the headshield sea slug against a brilliant background of green seagrass taking home the "best overall" award.
Olds is a local Key Biscayne, Fla., resident.

The photos were judged by a panel of experts that included: photographer and UM lecturer Myron Wang; underwater photographer Nicole Wang; and Michael Schmale, a professor at Rosenstiel School Marine Biology & Fisheries
They awarded prizes in three categories, macro, fish or marine animal portrait, and wide angle.
Best overall photo was the equivalent of first place.


The first-place award in the macro-photography category went to Canadian Todd Mintz's photo of cute-as-can-be yellownose gobies (Elacatinus randalli) peering out from brain coral in Bonaire, Dutch Caribbean.


A swirl of lionfish, Pterois species, in the Red Sea snapped by Mark Fuller of Israel snagged first place in the wide angle category.


Though not a category, the judges awarded the "Best UM Student Photo," which went to Kyra Hartog's image of a whale shark.
The whale shark is one of the most mysterious creatures and the largest fish in the world.
They live their lives mostly out of sight; in fact, little is known about where they go and what they do when they aren't in shallow-water feeding groups in Mexican and other waters during springtime.
Satellite-tagging studies as well as a genome-sequencing project are underway that could shed light on the beasts.

"The quality of photos keeps getting better each year," Wang, who has been judging the contest since its inception, said in a statement. "
Judging becomes more difficult when you have so many wonderful pictures to choose from."


For Wang, "this year’s standout was the great picture of the juvenile sperm whale taken by Douglas Kahle in Dominica – it is spectacular!
(That photo took home first place in the animal portrait category.)

In a new addition to the contest, an online "fan favorite" poll garnered more than 1,200 votes on the school's blog.
The winner, Todd Aki's shot of a giant and graceful jellyfish, took nearly half of the votes.

The annual underwater photography contest is open to all amateur photographers who earn no more than 20 percent of their income from their photography.