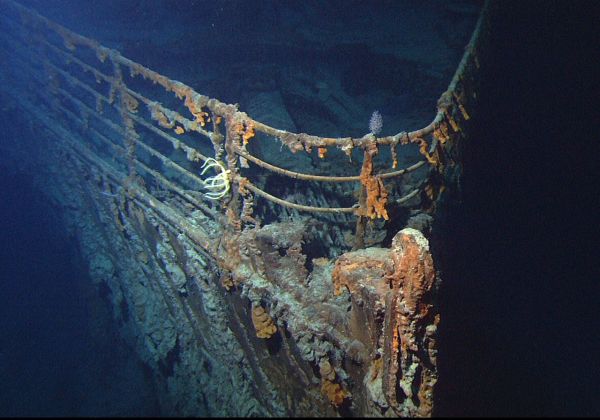
Saturday, February 27, 2021

Underwater photographer of the year 2021

Renee Capolzzola (USA), for her graceful image: “Shark’s Skylight“.
 
The full set of UPY2021 results is now available to view in the Winners’ gallery, and the complete collection is available to download and keep in the free Yearbook.
The UPY team would like to thank all the talented photographers who supported this year’s competition with their pictures, especially in these challenging times.
We hope that this year’s stunning collection of winning images provides a welcome escape to everyone who enjoys them and a chance to reconnect with the underwater world.

Friday, February 26, 2021

The Titanic disaster and its aftermath

View of the bow of the RMS Titanic photographed in June 2004 by the ROV Hercules during an expedition returning to the shipwreck of the Titanic.
(Courtesy of NOAA/Institute for Exploration/University of Rhode Island)


From Hydro by Albert E. Theberge

Understanding the Unthinkable

In the night of 14 April 1912, the unthinkable happened.
The mightiest ship afloat, the brand new White Star Line ship Titanic, was on its maiden voyage from Southampton, England, to New York.
The ship was advertised as unsinkable.
And, if unsinkable, why should there be adequate lifeboats for all of the passengers and crew? The ship departed from Southampton on 10 April.
Less than five days later, it was at the bottom of the Atlantic Ocean.
More than 1,500 people perished within three hours of striking an iceberg, which ripped the bottom out of the ship.

How this happened is a story told many times.
Human hubris, unswerving trust in the infallibility of technology, and the commercial impetus of fast Atlantic passages all contributed to the loss of the ship and the accompanying loss of life.
Even as the ship was settling in the waters of an icy North Atlantic, some survivors reported that there was a belief among many passengers that the ship was the safer place to be; accordingly, not all the lifeboats were filled to capacity.

This accident shocked the international community.
The British and American governments investigated the accident – the British determined: “That the loss of said ship was due to collision with an iceberg, brought about by the excessive speed at which the ship was being navigated.” Certainly, that was the major factor.
However, like many accidents, there were a number of contributing causes.
These included: watertight bulkheads that were improperly designed; an insufficient number of lifeboats and life rafts; apparent lack of concern by the captain concerning reports of ice prior to collision with the iceberg; little training of crew in emergency procedures including lowering of lifeboats; no radio watches on nearby ships which could have assisted in lifesaving efforts; and, remarkably, not even binoculars for the ship’s lookouts.

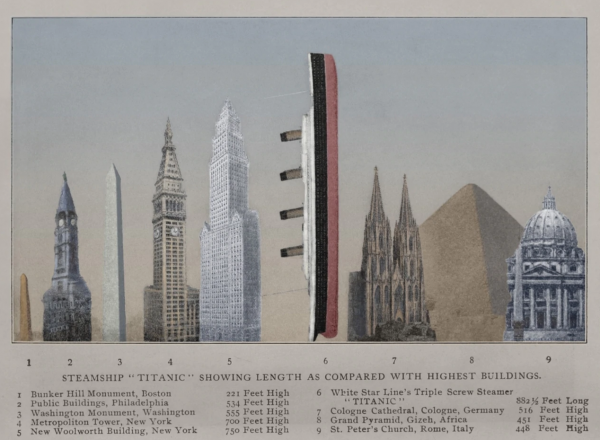
Steamship Titanic showing length as compared with highest buildings.

Both the British and American governments arrived at similar conclusions and recommendations following the loss of the Titanic.
The chief recommendation was that all ships be equipped with sufficient lifeboats for passengers and crew, that all ocean-going ships maintain 24-hour radio-telegraph watches, and that bulkheads be designed such that flooding of any two adjacent compartments would not result in sinking of a vessel.
These recommendations and others were adopted by the first International Convention for the Safety of Life at Sea (SOLAS) at a conference held in London in 1914.

Development of Seafloor Mapping Technologies


Commercial concerns saw an opportunity in the Titanic disaster and began searching for a means to determine the presence of icebergs and other unseen or submerged obstructions forward of moving vessels.
European and North American inventors joined the race.
In 1912, Reginald Fessenden, a Canadian inventor and radio pioneer, joined Submarine Signal Company, a forerunner of today’s Raytheon, and began work on an electro-acoustic oscillator similar to a modern transducer.
This oscillator was originally designed for both ship-to-ship communication and to receive reflected sound from an underwater object.
In late April 1914, Fessenden tested this device off the Grand Banks on the US Revenue Cutter Miami and succeeded in reflecting sound off an iceberg at a range of approximately two miles and hearing the return echo.
A second echo was heard that was determined to be from the bottom.

Submarine warfare during World War I accelerated research into the field of acoustics.
By the end of the war, the use of acoustics for both detection of objects in the water and measuring depth had been proven.
In 1922, the USS Stewart, equipped with a Hayes Sonic Depth Finder that utilized a Fessenden oscillator, ran a line of soundings across the Atlantic Ocean taking over 900 individual soundings.
The profile obtained from these soundings was published in the first issue of the International Hydrographic Review.
Piano-wire sounding systems became obsolete overnight.
Although leadline sounding continued for a number of years in shallow water, acoustic sounding systems replaced the leadline for most purposes within two decades.

World War II further accelerated the development of directional sonar systems (called Asdic in England).
Although meant originally for detection of submarines, these systems ultimately developed into modern side-scan sonar systems.
Underwater photography equipment and magnetic anomaly detection (MAD) instruments were in their infancy during this period.
MAD systems were proved effective in detecting submarines.
An early use by hydrographers of the complementary use of sonar, underwater photography and MAD gear was in the charting of ships torpedoed off the United States East Coast.
This was done by Coast and Geodetic Survey (C&GS) officers working off the Coast Guard buoy tender Gentian in 1944.

Following the war, there were further advances, including the development of an early side-scan sonar system called Shadowgraph in 1954 by German scientist Julius Hagemann, who was working at the United States Navy Mine Defense Laboratory.
This system remained classified for many years, but civil use of side-scan began developing shortly after this advance.
In the commercial sector, Harold Edgerton of the Massachusetts Institute of Technology (MIT) and Martin Klein, also of MIT, were early pioneers.
Edgerton turned a bottom-penetration sonar on its side in 1963 and imaged a sunken lightship from a C&GS vessel.
Edgerton was a founder of EG&G and discovered the Civil War era USS Monitor off Cape Hatteras with an EG&G commercial side-scan system.
Martin Klein began his career with EG&G but left to found Klein Associates, a name synonymous with side-scan technology.

Advances in depth measurement technology paralleled the development of side-scan technology.
In April 1961, engineers at General Instruments Corporation developed a proposal for BOMAS, Bottom Mapping Sonar.
Quoting from the proposal: “BOMAS derives bottom profile information from the intersection of the ocean bottom with a vertical plane perpendicular to the heading of a ship.
The sonar data is processed automatically and in real time to provide a depth contour strip map….
A sonar intensity map can be provided simultaneously….” 
Multi-beam sounding with its attendant bottom reflectivity mapping capability was born.
Two years later, the first prototype multi-beam system was installed on the USS Compass Island and subsequent units installed on Navy survey ships.
In the meantime, the acronym had changed to SASS (Sonar Array Sounding System).
By the late 1970s, the technology had migrated to the civil community and has since displaced single beam sounding systems as the standard seafloor mapping tool.

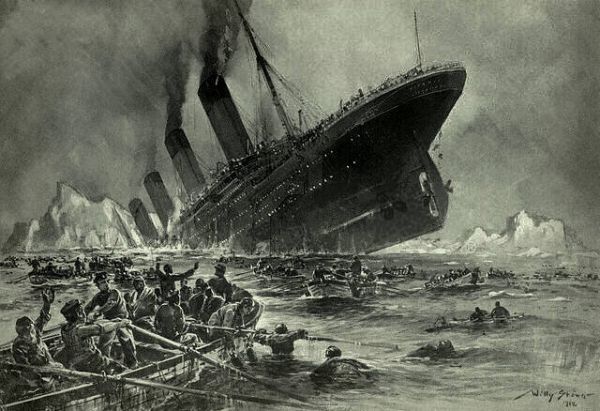
Painting of the Titanic sinking by the bow, with people rowing a lifeboat in the foreground and other people in the water.
Icebergs are visible in the background.
(Engraving by Willy Stöwer: Der Untergang der Titanic) 

Finding Titanic and the Aftermath of the Discovery


In the immediate aftermath of the sinking, proposals to locate the sunken Titanic were discussed and ultimately dismissed because the wreck lay well beyond the limits of technology at that time.
Through the decades, the development of subsea technology finally provided the means to locate the wreck and subsequently to not only investigate it using remote technology, but also to dive to the wreck and conduct a series of investigations that included surveys of the interior of the ship.

In July 1985, the final search began, with Ifremer deploying their newly developed side-scan sonar SAR vehicle on a mission led by Jean-Louis Michel on the research vessel Le Suroit.
That survey covered 70% of a 150 square nautical mile survey box without locating the Titanic.
Picking up the search in August, the WHOI team, led by Robert Ballard aboard the research vessel Knorr, utilized the towed vehicle Argo, with a 100kHz side-scan sonar, and three low-light black and white video cameras.
Ballard’s team relied on the optical system to locate the Titanic, and in the early morning hours of 1 September, the unmistakable form of a boiler made it clear that the search was over.
Titanic’s final resting place had been found.

Since the discovery in 1985, a series of expeditions have visited the Titanic with a variety of goals.
Ballard and Woods Hole returned to the wreck in July 1986 on the WHOI research vessel Atlantis II, with the submersible Alvin, and the ROV Jason Jr.
The 1986 expedition photographed and filmed the wreck, focusing on the largely intact bow section.
Working from the data collected from the 1985 Argo survey as well as 1986 data, WHOI’s William Lange and others assembled a preliminary site map of the Titanic wreck site that delineated the site from the bow to the stern section and plotted a wide range of features scattered on the seabed.
A private venture funded and led by RMS Titanic, Inc., the salvor-in-possession of the wreck (RMST), and technically supported by Ifremer, returned to the wreck in July 1987 and made 32 dives to recover some 1,800 artifacts from the seabed, the first of a series of recovery dives made by RMST until 2004, which ultimately salvaged nearly 5,000 artifacts.

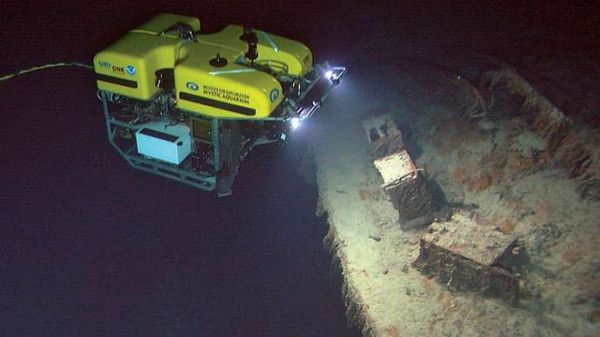
The remotely operated vehicle (ROV) Hercules exploring the bow of the Titanic, 2004.
(Courtesy: Institute for Exploration/University of Rhode Island/NOAA


Dives made by documentary film crews and James Cameron (whose first dives were in 1995) working with the P.P.
Shirsov Institute, captured dramatic images of the wreck as well as additional technical information and a more detailed view of aspects of the wreck site in the Mir submersibles.
In particular, Cameron’s extensive documentation and penetration of the interior of the bow with small ROVs known as ‘bots’ provided incredible insights into the ongoing processes of environmental change and preservation inside the ship, as well as evidence of what had occurred during the sinking of the Titanic.
Cameron’s work has arguably done more to share the Titanic as a wreck site with a greater audience than anyone else.

The scientific products of the various expeditions include a detailed analysis of the microbiological corrosion of the ship’s steel (led by Roy Cullimore), geological studies of the sediments and current studies (by the Shirsov Institute), a detailed sonar survey of the bow where the Titanic struck the iceberg, photo mosaics of the bow section, and forensic studies of the ship’s sinking sequence and break-up.
In addition, RMS Titanic, Inc. commissioned the creation of an ‘archaeological GIS’ map delineating where the 5,000 artifacts had been recovered from between 1987 and 2004.
That GIS, which is being completed by RMST under contract by the Center for Maritime & Underwater Resource Management of Michigan, a private non-profit, is reported to be nearly complete.

The National Oceanic & Atmospheric Administration’s Office of Ocean Exploration conducted two missions to the Titanic in 2003 and 2004.
As the nation’s ocean agency, NOAA has an interest in the scientific and cultural aspects of the Titanic.
NOAA’s focus is to build a baseline of scientific information from which we can measure the processes and deterioration of the Titanic, and apply that knowledge to many other deepwater shipwrecks and submerged cultural resources.
The 2003 mission, with the Shirsov Institute, had several key goals, the first being to catalogue any anthropogenic activities currently impacting the wreck site, or evidence of such activity since its discovery in 1985.
Digital imagery was obtained and a deck-view mosaic of the bow section was created.
Additionally, ongoing bacteriological analysis was conducted as well as basic oceanographic research.

The 2004 Mission, Conducted On Board the NOAA Research Vessel

Ronald H. Brown, working with Robert Ballard, then (and now) with the University of Rhode Island and the Institute of Archaeological Oceanography, utilized an ROV to continue the assessment of the wreck’s ongoing environmental changes and the bacteriological work of Roy Cullimore.
One other key achievement of the 2004 mission was the completion of a topographic map of Titanic Canyon and the surrounding area, including the wreck of the Titanic, with a Seabeam 2112 multi-beam sonar system.
The digital terrain model of this large area of seabed places the Titanic within a larger geological and geographical context.

NOAA also participated, as did Woods Hole, the National Park Service, the Institute of Nautical Archaeology, the Waitt Institute and contracted partners such as Phoenix International, Ltd., in RMS Titanic, Inc.’s last (to date) expedition to the wreck in August 2010.
This mission, with a non-recovery scientific focus, focused on William Lange’s and the WHOI Advanced Imaging and Visualization Laboratory’s work to create a detailed 2D and 3D visual mosaic of the site.
To do so, it made a detailed survey using the Waitt Institute’s REMUS 6000 autonomous underwater vehicles of an approximately ten square nautical mile survey zone around the wreck site, with a series of closer, higher resolution surveys of the area delineated in the 1986 WHOI map of the site and even closer surveys of key features and areas of the site.
That project was successful in generating the mapping data as well as comprehensive visual coverage of the wreck, including detailed photo mosaics of a number of features in the artifact scatter, which included sections of the ship’s hull, machinery and equipment and other artifacts.

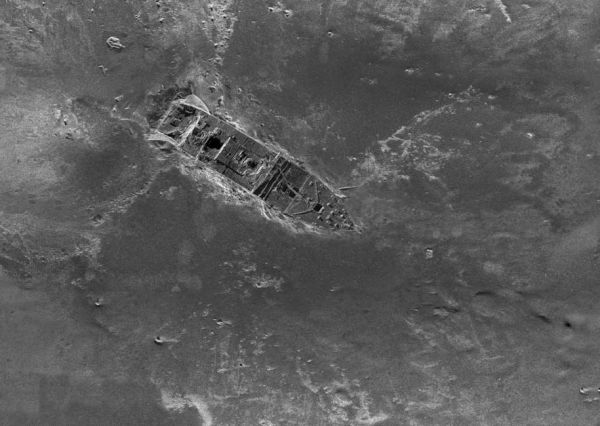
This composite image, released by RMS Titanic Inc., and made from sonar and more than 100,000 photos taken in 2010 by unmanned, underwater robots, shows a small portion of a comprehensive map of the 3-by-5-mile debris field surrounding the bow of the Titanic on the bottom of the North Atlantic Ocean (Courtesy: AP Photo/RMS Titanic Inc.)

What is clear in this brief overview is that the last few decades have witnessed a revolutionary expansion of humanity’s capacity to not only locate deep-sea shipwrecks, but increasingly to capture imagery and data that essentially ‘virtually raises’ these wrecks for ongoing research as well as public education.
In many ways, the Titanic and the surrounding area are likely to be the best-studied section of the deep ocean floor.
That status has come because of the iconic nature of the wreck and the potential for profit from the opportunity to connect to this ship and its tragic loss either through a tour of the recovered artifacts or a virtual tour on film or in a photograph.
At the same time, measurable and important science has been conducted, and in that, a way forward for not only this site but others has been demonstrated, especially in the adaptation and adoption of technology to access and learn from sites once thought unreachable.

Links :

Thursday, February 25, 2021

Scientists use nuclear reactor to investigate Amelia Earhart’s mysterious disappearance

Earhart beneath the nose of her Lockheed Model 10-E Electra, March 1937, Oakland, California, before departing on her final round-the-world attempt prior to her disappearance.
Credit: Wikimedia Commons.

From ZMEScience by Tibi Puiu

A metal plate thought to have once belonged to Earhart's plane was probed for hidden secrets using neutron beams.

One of the bravest women of the 20th century, Amelia Earhart, vanished unexpectedly during her attempt to fly around the world.
Now, scientists have turned to nuclear technology to analyze a piece of metal debris that some suspect was part of Earhart’s wrecked plane. In doing so, they hope to piece together the final moments of the pioneering aviator’s final living hours. 

A tragic end to a brave pioneer

Amelia Earhart was the first female pilot to fly across the Atlantic Ocean.
In 1937, Earhart and her navigator, Fred Noonan, were flying their Lockheed Model 10-E Electra on an even more ambitious quest: flying around the world.
On July 2, 1937, they were about six weeks and 20,000 miles into their journey when their plane suddenly crashed en route to Howland Island in the Pacific, which is halfway between Hawaii and Australia. 
 

Howland island with the GeoGraage platform (NGA/NOAA source)
 
The Howland Island is a flat sliver of land about 2,000 meters (6,500 feet) long and 460 meters (1600 feet wide), so it must have been very difficult to distinguish from similar-looking clouds’ shapes from Earhart’s altitude.
Of course, Earhart and Noonan were well aware of the challenges, which is why they had an elaborate plan that involved tracking their routes using celestial navigation and linking to a U.S. Coast Guard vessel stationed off Howland Island using radios.

But despite their well-thought-out contingency plans, the pair were simply flat out of luck.
When they took off, witnesses reported that a radio antenna may have been damaged by the maneuver. On that morning, there were also extensive overcast conditions.
Later investigations also showed that the fliers may have been using outdated, inaccurate maps.
 
 
On the morning of July 2, 1937, at 7:20 AM, Earhart reported her position to the crew at the Coast Guard vessel, placing her plane on a course at 32 kilometers (20 miles) southwest of the Nukumanu Islands.
“We must be on you, but we cannot see you. Fuel is running low. Been unable to reach you by radio. We are flying at 1,000 feet.”

The ship replied but there was no indication that the signal ever reached Earhart’s plane.
The Coast Guard ship released its oil burners in an attempt to signal the flyers, but they weren’t seen by all accounts.
Noonan’s chart of the island’s position was off by about five nautical miles, subsequent investigations showed, and it seems likely that the plane ran out of fuel.

Despite a huge search and rescue mission involving 66 aircraft and nine ships, the fate of the two flyers remains a mystery to this day.
With the years, the mystery only intensified, amplified by countless conspiracy theories surrounding Earhart’s last days.

Neutrons and dirty metal plates

While watching a National Geographic documentary on the disappearance of Earhart, Daniel Beck, a pilot who also manages the engineering program for the Penn State Radiation Science and Engineering Center (RSEC), home to the Breazeale Nuclear Reactor, was shocked by a particular scene discussing an aluminum panel believed to be part of the wrecked airplane.
The documentary ended with the idea that, perhaps, sometime in the future, technology will advance to the point where scientists can elucidate more information from the panel.
“I realized that technology exists. I work with it every day,” Beck said.

The scientist got ahold of Richard “Ric” Gillespie, who leads The International Group for Historic Aircraft Recovery (TIGHAR) and was featured in the documentary, and offered to analyze the metal part using neutron technology at his lab. 
 

Kenan Ünlü, director of the Penn State Radiation Science and Engineering Center, holds a metal patch that might be from Amelia Earhart’s airplane.
Credit: Kenan Ünlü/Penn State.

The metal panel had been recovered in storm debris on Nikumaroro, a Pacific island located about 480 kilometers (300 miles) away from Howland Island.
Some have suggested before that Earhart’s plane made an emergency landing on the reef surrounding the small, uninhabited island.
A human skeleton was even found in 1940, and although the bones were lost, a 2018 study found that the historical records of the bones’ measurements matched Earhart’s closer than 99% 0f the general population.

A skull fragment that may be from the original skeleton was found in a storage facility in a museum on a nearby island and is currently being tested to see if it is a genetic match for any of Earhart’s relatives. Beck’s goal was to perform a similar investigation, only instead of genetics, he wanted to use the reactor’s neutron beams to reveal the history of the metal patch.
Perhaps they could find a long-faded serial number or other marks that might link the debris to the Electra.

Beck and colleagues placed the sample in front of the neutron beam, while a digital imaging place was placed behind the sample.
As the neutron beam passed through the sample and then through the imaging plate, an image was recorded and digitally scanned.

“As the beam passes through, if it were uniform density, we wouldn’t see anything,” Beck said.
“If there’s paint or writing or a serial number, things that have been eroded so we can’t see with the naked eye, we can detect those.”

This investigation revealed that the metal plate had axe marks along the edges, except for one of the edges where the metal must have snapped from whatever it was attached to.
In other words, not much linking it back to Earhart.

“It doesn’t appear that this patch popped off on its own,” Beck said.
“If it was chopped with an axe, we should see peaks for iron or nickel left by the axe along that edge. Neutron activation analysis gives us that detail at a very fine resolution.”

For now, the researchers plan on performing more examinations using more comprehensive experiments, including adjusting the irradiation time and power level of the reactor.

Even if they eventually don’t find anything in connection to Earhart, this inquiry is still valuable.
For one, it disqualifies the object so other people don’t waste time in the future.
Secondly, it sets a precedent that may spur more research with neutron radiography.
“It’s possible we’ll learn something that actually disqualifies this artifact from being part of Earhart’s plane, but I prefer the knowing! It is so exciting to work with scientists who share our passion for getting to the truth, whatever it is,” Gillespie said in a statement.

Links :

Wednesday, February 24, 2021

Princeton astrophysicists re-imagine world map, designing a less distorted, ‘radically different’ way to see the world


From Princeton by Liz Fuller-Wright

How do you flatten a sphere?

For centuries, mapmakers have agonized over how to accurately display our round planet on anything other than a globe.

Now, a fundamental re-imagining of how maps can work has resulted in the most accurate flat map ever made, from a trio of map experts: J. Richard Gott, an emeritus professor of astrophysics at Princeton and creator of a logarithmic map of the universe once described as “arguably the most mind-bending map to date”; Robert Vanderbei, a professor of operations research and financial engineering who created the “Purple America” map of election results; and David Goldberg, a professor of physics at Drexel University.

Their new map is two-sided and round, like a phonograph record or vinyl LP.
Like many radical developments, it seems obvious in hindsight.
Why nothave a two-sided map that shows both sides of the globe? It breaks away from the limits of two dimensions without losing any of the logistical convenience — storage and manufacture — of a flat map.

“This is a map you can hold in your hand,” Gott said.

In 2007, Goldberg and Gott invented a system to score existing maps, quantifying the six types of distortions that flat maps can introduce: local shapes, areas, distances, flexion (bending), skewness (lopsidedness) and boundary cuts (continuity gaps).
The lower the score, the better: a globe would have a score of 0.0.

“One can’t make everything perfect,” said Gott, who is also a 1973 graduate alumnus of Princeton.
“A map that is good at one thing may not be good at depicting other things.”

The Mercator projection, popular on classroom walls and used as the basis for Google maps, is excellent at depicting local shapes, but it distorts surface areas so badly near the North and South Poles that polar regions are usually simply chopped off.


In the Mercator projection, the polar regions are completely distorted — Antarctica looks bigger than all other continents combined — and distances are misleading: Japan and Hawaii look very far apart.
Under the system designed by Goldberg and Gott to quantify map errors, where lower numbers represent less distortion, the Mercator projection receives a score of 8.296.
Map by Daniel R. Strebe via Wikimedia Commons


Using their metrics, the best previously known flat map projection was the Winkel Tripel, with a Goldberg-Gott score of 4.563.
But that still had the “boundary cut” problem of splitting the Pacific Ocean and creating the illusion of great distance between Asia and Hawaii.


The Winkel Tripel projection, chosen by the National Geographic for its world maps, represents the poles more accurately than the Mercator, but it still distorts Antarctica badly and creates the illusion that Japan is hugely to the east of California, instead of its nearest neighbor to the west.
Goldberg-Gott score: 4.563
Map by Daniel R. Strebe via Wikimedia Commons

Clearly, a completely new approach was needed.
Gott drew a comparison to Olympic high jumpers: In 1968, Dick Fosbury shocked sports fans by arching his back and jumping over the bar backwards.
He set a new record and won a gold medal, and high jumpers have jumped backwards ever since.

“We’re like Mr. Fosbury,” Gott said.
“We’re doing this to break a record, to make the flat map with the least error possible.
So, like him, we’re surprising folks.
We’re proposing a radically different kind of map, and we beat Winkel Tripel on each and every one of the six errors.”

The inspiration came from Gott’s work on polyhedra — solid figures with many faces.

Polyhedral maps are nothing new — in 1943, Buckminster Fuller broke the world into regular shapes, and provided instructions for how to fold it up and assemble it as a polyhedral globe — but while he could protect the shapes of continents, Fuller shredded the oceans and increased many distances, such as between Australia and Antarctica.


Buckminster Fuller popularized the “Dymaxion” polyhedral projection, based on an unfolded icosahedron.
Antarctica is “round, as it properly should be,” said Gott, but this projection “shatters” the oceans.
Goldberg-Gott score: greater than 15
Imagery courtesy NASA’s Earth Observatory, with modifications by Mapthematics LLC
 
A presentation copy of the rare reprint of R. Buckminster Fuller’s “Fluid Geography,” describing his marvelous Dymaxion Map and illustrated by a large folding example thereof.

In a recent paper, Gott began considering “envelope polyhedra,” with regular shapes glued together back-to-back, which led to the breakthrough idea for the double-sided map.

It can be displayed with the Eastern and Western Hemispheres on the two sides, or in Gott’s preferred orientation, the Northern and Southern Hemispheres, which conveniently allows the equator to run around the edge.
Either way, this is a map with no boundary cuts.
To measure distances from one side to the other, you can use string or measuring tape reaching from one side of the disk to the other, he suggested.

“If you’re an ant, you can crawl from one side of this ‘phonograph record’ to the other,” Gott said.
“We have continuity over the equator.
African and South America are draped over the edge, like a sheet over a clothesline, but they’re continuous.”

This double-sided map has smaller distance errors than any single-sided flat map — the previous record-holder being a 2007 map by Gott with Charles Mugnolo, a 2005 Princeton alumnus.
In fact, this map is remarkable in having an upper boundary on distance errors: It is impossible for distances to be off by more than ± 22.2%.
By comparison, in the Mercator and Winkel Tripel projections, as well as others, distance errors become enormous approaching the poles and essentially infinite from the left to the right margins (which are far apart on the map but directly adjacent on the globe).
In addition, areas at the edge are only 1.57 times larger than at the center.


Gott, Goldberg and Vanderbei’s revolutionary, double-sided disk map minimizes all six types of map distortions. 
They used an equidistant azimuthal projection: a compromise projection, like the Winkel Tripel, with small errors in both local shapes and areas, instead of optimizing one at the expense of the other. 
Antarctica and Australia are more accurately represented than in most other maps, and distances across oceans or across poles are both accurate and easy to measure, unlike one-sided flat maps. 
Goldberg-Gott error score: 0.881Map by J. Richard Gott, Robert Vanderbei and David Goldberg

The map can be printed front-and-back on a single magazine page, ready for the reader to cut out.
The three cartographers imagine printing their maps on cardboard or plastic and then stacking them like records, to be stored together in a box or slipped inside the covers of textbooks.

“A thin box could hold flat, double-sided maps of all the major planets and moons in the solar system,” Gott said, “or a stack of Earth maps giving physical data, political boundaries, population density, climate, languages, explorers’ voyages, empires at different historical periods or continents at different geological epochs.”

To the best of their knowledge, no one has ever made double-sided maps for accuracy like this before.
A 1993 compendium of nearly 200 map projections dating back 2,000 years did not include any, nor did they find any similar patents.

“Our map is actually more like the globe than other flat maps,” Gott said.
“To see all of the globe, you have to rotate it; to see all of our new map, you simply have to flip it over.”

Flat maps that improve on the Winkel Tripel,” by J. Richard Gott III, David M. Goldberg and Robert J.
Vanderbei, was published on Arxiv on Feb. 15.
You can see their double-disk maps of Earth, Mars, Jupiter, the sun, and other heavenly bodies here.

Links :

Tuesday, February 23, 2021

Arctic shipper shows off a historical icebreaking voyage

Watch two super-powerful vessels break their way through the Northern Sea Route in mid-winter.
 
From BarentsObserver by Atle Staalesen

It is the first time that a commercial vessel sails across the Northern Sea Route in February.
The voyage of the Christophe de Margerie from Jiangsu in China to the remote Arctic terminal of Sabetta was made in the Arctic winter dark and through thick sea-ice.

Glimpses of the voyage are now put on display by shipping company Sovcomflot and its partner Rosatom.

As previously reported by the Barents Observer, the 299 meter long LNG carrier operated by Sovcomflot on the 27th January set out from the Chinese port and few days later sailed through the Bering Strait were it soon team up with nuclear icebreaker 50 Let Pobedy.

The Christophe de Margerie sails into port of Sabetta on 19th February 2021.

The two ships subsequently sailed together across the vast Arctic route to the Yamal Peninsula.
On the 19th February, the powerful LNG carrier entered the port of Sabetta.
That is two days after the original schedule.

According to shipping company Sovcomflot, the voyage shows that navigation across the eastern sector of the Russian Arctic can be significantly extended.
“The current voyage of Christophe de Margerie significantly expands the navigation window in the in the eastern sector of the Russian Arctic, and confirms that year-round safe navigation is possible along the entire length of the Northern Sea Route,” says company President and CEO Igor Tonkovidov.

The voyage proceeded through thick ice.
The straits between the mainland and archipelagos Severnaya Zemlya and New Siberian Islands are covered by thick fast ice, while the remaining part of the area has one-year old sea-ice that is between 30-200 cm thick.

However, there is no multi-year old ice in the area.

According to Sergey Gen, the captain of the Christophe de Margerie, the ice conditions were the toughest in the Chukchi Sea and the East Siberian Sea, faced by the vessel were ice pressure and ice hummocks in the vessel faced severe ice pressure and ice hummocks.

Through this area, the carrier had to sail astern, Captain Gen said in a comment.
According to Sovcomflot the Christophe de Margerie has sailed astern for about 10 per cent of the time sailed on the Northern Sea Route so far.
 
Links :

Monday, February 22, 2021

Solid sail and mast to be installed for validation in France

Prototype Solid Sail / AeolDrive

From Maritime Executive

French shipyard Chantiers de l’Atlantique is continuing efforts to develop and commercialize its solid sail technology for large ships.

Solid Sail tested on Imoca 60 Yes We Cam with Jean Le Cam skipper / 
photo Bernard Biger, Chantiers de l'Atlantique
 
Developed from an R&D program begun in 2008, the sail is an innovative application of composite materials and a rigging system that has been tested on a smaller scale aboard Jean Le Cam’s sailboat as well in trials with Ponant.
The promising technology has also drawn interest from large ship operators including MSC.
 
As the next step in the technical validation necessary to commercialize the Solid Sail/AeolDrive solution for large ships, the shipyard will install prototypes of the system for testing at the shipyard.
In the fall of 2021, they will install a 125-foot-tall mast that deploys a 550 m² (657 yd²) sail and that will be followed by a full-scale model standing 311 feet in height in 2022 with a 1,200 m² (1,435 yd²) Solid Sail.
The centerpiece of the system, the rigging named AeolDrive – a mast tiltable through 70°, which is a balestron rigging able to rotate through 360° permitting the vessel to remain on course without the maneuvering traditionally required by a sailing ship. 
 
The new test masts will be extending the previous 1 to 5 scale prototype which was tested for two years on a pier in Pornichet harbor.
A system of force and position sensors will enable the aerodynamic and kinematic performances of the assembly to be evaluated while monitoring the stress levels in the mechanical elements.
 
Testing the prototype designs (Chantiers de l'Atlantique)
 
According to the shipyard, the mast will be one of the highest composite masts in the world made of unique carbon fibers. The sail membrane is made of fiberglass with the textile bonds between the panels made of Dyneema (a fiber 15 times as strong as steel).
The unique materials used for the solid sails permit them to be larger than anything possible for the historic fabric sails and the use of rectangular panels facilities the automatic lowering and raising of the sails.
The lifespan of the solid sail is projected to be five times that of conventional sails.
 
Chantiers de l’Atlantique says that the first commercial application for the Solid Sail/AeolDrive solution is destined to a 200 m (655 ft) long cruise ship.These ships will use both sails and an engine for propulsion, achieving a 50 percent reduction in greenhouse gas emissions.
Other applications that they are considering are cargo ships and large pleasure boats.
 
Concept design (Chantiers de l'Atlantique)

The Solid Sail/AeolDrive solution is the fulfillment of a cooperative work between Chantiers de l’Atlantique and its industrial partners.
They are from Brittany (Multiplast, AvelRobotics, SMM Technologies, CDK Technologies, Lorima, G SEA Design, Blew Stoub, Ocean Data System, Pixel Sur Mer and Awentech) for the mast and the sail, and Pays de la Loire (MECA, Wichard, Nov-BLM, Lancelin, Baudin Chateauneuf and PL Marine) for the fitting equipment.
With the support of the regions Brittany and Pays de la Loire and of the local authority of Lorient and Vannes, genuine technological and industrial sectors sprouted around this innovative concept.

Additionally, Solid Sail/AeolDrive received support from the ERDF (European Regional Development Fund), the Pôle Mer Bretagne Atlantique (Brittany Atlantic Sea Pole), and from the PIA (Programme d’Investissement d’Avenir – Investment Program for the Future) operated by ADEME, the French Energy Management Agency, as well as funds from the 2020 European Research and Innovation Program (LeanShips project).

From a scientific and academic point of view, the project was led in association with the TRI Jules Vernes, the ENSTA Bretagne (Grande École of engineering), and the Catholic Institute of Arts and Crafts of the West Coast.

Links :

Sunday, February 21, 2021

Northern islands

The best shots from my trip in the northern islands: Faroe Islands, Lofoten Islands & Senja (Norway). Enjoy aerial views of gorgeous locations:
Vagar, Tindholmur, Kalsoy, Tjornuvik, Henningsvaer, Nusfjord, Reine, Hamnoy, Sakrisoy, Segla…