Plastics and marine litter pollution in the #Oceans are a major and global issue.
The ideal actions to be pursuit should be avoiding single-use #Plastics and impeding waste in general from ending up in the ecosystems.
But what to do with the legacy plastics and marine litter already lying on the seabed, that fragments into microplastics and contaminates shells, fishes and humans?
Within the Maelstrom H2020 project (www.maelstrom-h2020.eu), TECNALIA (with the collaboration of CNRS-LIRMM, ST ServiziTecnici and CNR-ISMAR) envisioned a radically new solution by adapting the #CableRobotics technology to the marine and underwater environment.
We thus created the worldwide first Robotic Seabed Cleaning Platform based on cable robotics technology (patent pending).
And we are now very proud to unveil this video demonstrating the capabilities of the Robotic Seabed Cleaning Platform to remove marine litter in the Venice lagoon!
Geography
of Ancient World (Puranic Dwipas) as described in Puranas. Jambu Dwipa
is one of the seven Dwipa’s i.e. Jambu Dwipa, Kusa Dwipa, Plaksa Dwipa,
Puskara Dwipa, Salmali Dwipa, Kraunca Dwipa, Saka Dwipa as depicted in
the above map; Source: The Geography of Puran By: S.M. Ali, FNI
The study of trade winds, monsoons, and cyclones piqued the curiosity of many explorers in the eighteenth and nineteenth centuries. However, they were still apprehensive about the unexpected weather shift in the midst of the ocean.
The marine cartography and nautical charts have helped humans comprehend the oceans and weather in several ways. In the seventeenth century, ocean currents had a significant impact on South America’s colonisation. To sail to their colonies in South America, Spanish and Portuguese navigators kept meticulous charts and maps. The use of a compass and nautical charts transformed trips.
Some Spanish naval commanders learned how to use the wind’s force for marine navigation in the sixteenth century, even though they didn’t fully know how it worked.
These early Spanish and Portuguese expeditions immensely aided British navigators, who were very active in the Indian Ocean. They also began maintaining wind records on their expeditions from the early seventeenth century. The commanders of the ships started keeping a note of the trade wind direction, which was crucial for sailing, in the ship’s logbook. However, monsoon winds continued to be the least understood winds, and for a very long period, their origin and nature were unknown.
In the latter half of the seventeenth century, as maritime trade between Europe and the Indian Ocean increased, navigators began to develop a better understanding of the monsoon. Matthew Fontaine Maury, an American navigator, developed techniques to identify the prevalent wind patterns in 1855. Using observation charts from more than a hundred ships in the Indian Ocean, Maurey was eventually able to produce the monsoon and trade wind map of the Indian Ocean at the request of the East India Company. The Company believed that by developing wind and monsoon charts, the British fleet’s trip distance would be reduced, bringing down the cost of cargo shipping.
By the final decade of the eighteenth century, the British East India Company had already built observatories in the coastal regions of Madras, Bombay, and Calcutta. Realizing that India has a climate significantly different from their own, they started making and documenting amateur meteorological observations. A meteorological register that allowed for the daily recording of observations was created by Goldingham in 1793. At all of the major observatories, including Madras, Bombay, Calcutta, Shimla, and Trivandrum, hourly meteorological observation started in 1848.
Even if these observatories were designed to explain the weather patterns in India, the colonial authority may have been more interested in solving the enigma of storms in the Indian Ocean, where much of its commercial activity depended. The first ocean storms were noted by Henry Piddington in the Indian Ocean in 1839, and he was able to connect them to the name cyclone, which he invented after being inspired by a Greek word that meant snake coils. In response to his observations of the ocean storms between 1839 and 1851, he wrote Sailor’s Handbook of Storms. However, one of the difficulties during those years was finding skilled individuals to record the data.
The government didn’t start giving instructions to train two troops from each station until after 1856, but most of the time the work was handed to medical personnel who weren’t aware of the need for timeliness and accuracy of observations. As a result, up until the middle of the nineteenth century, no modelling or forecasting could be done using meteorological information.
Due to the numerous tropical cyclones, the Bengal coast has historically been the most susceptible area in the Indian Ocean. They often occur in October and November and bring extremely high winds, heavy rain, and storm surges that cause flooding and damage to standing crops in the eastern states of India.
Most often, they caused enormous harm to crop fields, moored ships, property, and the lives of people and animals. The years 1831-85 saw some of the most severe storms ever recorded in nineteenth-century British chronicles. Among these, the storm in 1864 wreaked immense destruction. Both those moored at the coastlines and those in motion suffered damage.
Therefore, the British colonial scientists in India were eager to provide seasonal weather forecasts that may assist in the justification and expansion of the British empire. In order to send out early warnings about impending storms, weather forecasting became crucial.
India provided a perfect natural laboratory for meteorology for meteorologists like Henry Blanford since it was more unpredictable than other places than the regularity of atmospheric and meteorological events.
Various navigators’ reports on the winds from throughout the world revealed that some regions of the oceans have consistent winds, named as trade winds. The navigators discovered that if they put their ships in the normal trade winds’ courses, they could easily travel.
William Ferrel, an American, developed a hypothesis of trade winds in 1859 after reading several observational data from various regions of the world. Ferrel’s hypothesis quickly spread around Europe, but it received little attention. Until his 1889 book A Popular Treatise on the Winds offered a fresh perspective on trade wind issues.
Ferrel also provided a thorough explanation of the factors that lead to tropical cyclones that form near the equator in the North Atlantic Ocean, the Arabian Sea, and the Bay of Bengal. Ferrel concluded that tropical cyclones that form over the Indian Ocean above the equator and migrate over to the coastal regions of Bengal are more likely to affect the Bay of Bengal.
Prior to Ferrel’s explanation, Henry F. Blanford had created a table of Bay of Bengal cyclones based on the records that were accessible up until 1876. He noticed that the trade winds from the northern and southern hemispheres congregate during October-November. Because the two trade winds had distinct moisture contents and air temperatures, a severe low-pressure system developed that quickly intensified into a cyclone.
The Bengal Hurkaru, which is an account of the Bengal Cyclone of 1864, stated that because telegraph line construction was still ongoing at the time, Calcutta was unable to get enough warning to make adequate preparations. Blanford came to the conclusion that the bulk of the cyclones formed in a line parallel to and immediately to the west of the Andaman and Nicobar Islands based on the data collected by the meteorological stations and observatories of Calcutta and Madras.
Prepared By: Col Rennell Map of Hindoostan, Map of India, 1788;
Source: Survey Of India
The ships’ logs of days before October 5, 1864, when the storm really slammed the Calcutta coast, provided him the information. Atmospheric pressure and wind speed were once monitored by seagoing ships. They saw that the southerly wind began blowing in the Bay of Bengal on October 1st, four days prior to the storm making landfall, and that it progressively shifted its path to the north.
Information on wind pressure and humidity was gathered from observatories at Kandy, Madras, Calcutta, and Agra. They also noted that a stormy current entered the Andamans from the southwest, expanded gradually, changed its path to the southeast, and then returned to its original course on October 1 with heavy rain. The rapid changes in air pressure and wind direction were also noted in the records of ships sailing in the Bay of Bengal.
It was also observed that the Bay of Bengal cyclone primarily happens when the monsoon is shifting. The majority of these take place near the end of the southwest monsoon in October and November rather than at its start. The storms that originate in the north of the Bay of Bengal often move toward the northwest, those that originate close to the Andaman islands typically go toward the northwest, and those that originate in the south of the Bay typically move toward the west.
However, this understanding of the cyclone courses would only have been helpful if it had been possible to warn India’s coastal communities. Blanford’s observation-based model proved to be very useful during those years. He had deduced that the barometer was lower than usual and that the cyclone was usually preceded by a strong, stormy, wet wind coming from the southwest of their site of origin.
Additionally, he advised that warnings should be sent to the interiors of Bengal if the wind was blowing from the southeast and moving to the northeast with a dropping barometer. He also requested the establishment of setting up meteorological telegraph stations in Ceylon and Port Blair, and their connection to stations in northeastern Bengal.
Despite having access to a tremendous amount of data and a big number of weather stations and sensors giving the inputs, meteorology is still by its very nature probabilistic. Due to data gaps, it is still not regarded as a precise science, particularly when it comes to gathering data from the huge seas, which make up 70% of the Earth. The ability to perform real-time forecasting has been made possible by meteorologists feeding computer data every minute.
They input these data into models to comprehend how nature behaves. However, due to the gaps, there is still some unpredictability and uncertainty, which is why meteorologists utilise probabilities when making forecasts.
Two centuries ago, the availability of data was not at this level due to technological and meteorological station restrictions. However, meteorologists could still create models based on observations in the nineteenth century by collecting statistical data using inexpensive instruments like thermometers, anemometers, and barometers.
In November, the Pentagon released its annual China Military Power Report, which included a number of maps to illustrate its updated assessments of the Chinese military's capabilities and reach.
China and several of its neighbors have claimed parts of the Spratly Islands in the South China Sea.
A map from a recent Pentagon report shows how those countries are building outposts in the Spratlys.
While China's claims have been widely rejected, it continues to press them, at times aggressively
One of those maps offered a detailed depiction of the Spratly Islands — one of the tensest areas of the South China Sea, broad swathes of which are disputed by China and its smaller neighbors.
Six different countries claim all or some of the islands and features in the Spratlys. Thanks to China's land-reclamation and fortification efforts over the past decade, the islands it controls there have become the best-armed and most imposing.
China shows no signs of reducing its buildup or shrinking its presence, adding even more complexity to one of the most dynamic regions in the world.
China's 'dangerous position'
Several countries claim parts of the Spratly Islands and have set up outposts there.US Defense Departments
The map, one of several in the report depicting Chinese forces, shows the current claims in the Spratly Islands as well as China's facilities there.
The territorial and continental shelf claims of China, Indonesia, Malaysia, the Philippines, and Vietnam are shown with several overlapping lines. The map also gives rough locations for seven Chinese outposts, including three airfields, and 63 other outposts in the Spratlys.
China's outposts "are capable of supporting military operations" and "have supported non-combat aircraft," the Pentagon report says. "However, no large-scale presence of combat aircraft has been yet observed there."
The report also says the missiles and other weapons systems at Chinese-controlled outposts are "the most capable land-based weapons systems deployed by any claimant in the disputed South China Sea to date."
Chinese military operations in the South China Sea are overseen by the Southern Theater Command, which is one of China's largest and most important theater commands.
Chinese military units assigned to the Southern Theater Command.US Defense Department
People's Liberation Army ground, naval, and air forces are based along China's southern coast, including on Hainan Island, which is home to major PLA bases and hosts a PLA Rocket Force missile brigade.
The Southern Theater Command and the adjacent Eastern Theater Command would be involved in any Chinese military operation against Taiwan. Recent action by those forces around Taiwan, as well as ongoing Chinese activity in the South China Sea, have worried US commanders.
"The PLA Army and the PLA Rocket Forces and the Strategic Support Forces are in dangerous position." US Army Gen. Charles Flynn, commander of US Army Pacific, said at a think-tank event in February.
"They're rehearsing, they're exercising, they're experimenting" in the region, Flynn said, citing the PLA's activity around Taiwan following a visit by then-Speaker of the House Rep. Nancy Pelosi in August and a high-altitude spy balloon that US officials say was launched from Hainan Island in late January and drifted over North America several days later.
Both were cases of "very irresponsible and aggressive behavior," Flynn said. "The region sees that and they don't like what they see." The Spratly Islands
Filipino fishermen sail by a Chinese coast guard ship near Scarborough Shoal on February 5.
STR/AFP via Getty Images
The Spratlys are made up of islands, islets, submerged reefs, and other maritime features across roughly 158,000 square miles in the South China Sea between southern Vietnam and the Philippines.
Brunei, China, Malaysia, the Philippines, Taiwan, and Vietnam have overlapping claims to some or all of the Spratlys. All but Brunei have deployed soldiers and fortifications to back up their claims. Those disputes have turned violent at times, including deadly skirmishes between China and Vietnam in 1974and in 1988.
In recent years, China has turned some features it controls into fully developed artificial islands, adding over 3,200 acres of land to them, constructing ports, airstrips, bunkers, radars, and jamming stations, and deploying advanced anti-ship and anti-aircraft missiles.
China's navy, coast guard, and maritime militia regularly patrol around the Spratlys and through the region, trying to back up its claims, often by harassing rivals.
Thitu Island on March 9.JAM STA ROSA/AFP via Getty Images
Chinese vessels have blocked oil exploration and prevented Philippine supply vessels from restocking their own outposts. Chinese ships also maintain an almost continuous presence in disputed areas, especially Scarborough Shoal and Thitu Island.
Scarborough and Thitu, also known as Pag-asa Island, are the sites of some of the most contentious encounters between China and the Philippines. Manila won a legal victory over China in 2016, when a tribunal at the Hague ruled against many of China's claims.
Among its holdings, the court said that the features in the Spratlys in question were not legally islands and thus did not grant China rights to territorial seas or exclusive economic zones. The court also held that China had violated the Philippines' rights, including by interfering with fishing activity around Scarborough Shoal.
China continues to ignore the ruling and to pressure rival claimants, especially the Philippines.
In February, a Chinese Coast Guard vessel directed a "military-grade laser" at a Philippine Coast Guard ship sailing to an outpost in the Spratlys, temporarily blinding its crew. Weeks later, Chinese Coast Guard vessels demanded Philippine aircraft flying over the Spratlys leave what they called "Chinese territory."
At a depth of more than eight kilometres underwater, a new record for the deepest fish ever filmed and the deepest fish ever caught has been set by scientists from The University of Western Australia and Japan.
Scientists have filmed a fish swimming at an extraordinary depth in the ocean, making it the deepest observation of this nature that has ever been made.
The species - a type of snailfish of the genus Pseudoliparis - was filmed swimming at 8,336m (27,349ft).
It was filmed by an autonomous "lander" dropped into the Izu-Ogasawara Trench, south of Japan.
Localization -Izu-Ogasawara Trench- with the GeoGarage platform (NGA nautical raster chart)
The lead scientist said the snailfish could be at, or very close to, the maximum depth any fish can survive.
The previous deepest fish observation was made at 8,178m, further south in the Pacific in the Mariana Trench.
This discovery therefore beats the depth record by 158m.
"If this record is broken, it would only be by minute increments, potentially by just a few metres," Prof Alan Jamieson told BBC News.
The University of Western Australia deep-sea scientist made a prediction 10 years ago that fish would likely be found as deep as 8,200m to 8,400m.
A decade of investigations around the globe has confirmed this.
Image Source, Fivedeeps.Com
Prof Jamieson has pioneered the use of instrumented deep-ocean landers
The juvenile Pseudoliparis was filmed by a camera system attached to a weighted frame released from over the side of a ship, the DSSV Pressure Drop.
Bait was added to the frame to attract sea life.
Although a specimen was not caught to fully identify its species type, several fish were trapped slightly higher up in the water column in the nearby Japan Trench at a depth of 8,022m.
These, again, were snailfish, Pseudoliparis belyaevi, and set a record for the deepest fish ever caught.
Image Source, Minderoo-Uwa Deep Sea Research Centre
Deepest ever catch: Some snailfish were pulled up from 8,022m
Snailfish are truly remarkable.
There are over 300 species, most of which are actually shallow-water creatures and can be found in river estuaries.
But the snailfish group have also adapted to life in the cold waters of the Arctic and Antarctic, and also under the extreme pressure conditions that exist in the world's deepest trenches.
At 8km down, they are experiencing more than 80 megapascals, or 800 times the pressure at the ocean surface.
Their gelatinous bodies help them survive.
Not having a swim bladder, the gas-filled organ to control buoyancy that is found in many other fish, is an additional advantage.
Likewise, their approach to food - they are suction feeders and consume tiny crustaceans, of which there are many in trenches.
Image Source, Fivedeeps.Com
The DSSV Pressure Drop is now owned by Inkfish and has been renamed Dagon
Prof Jamieson says the discovery of a fish deeper than those found in the Mariana Trench is probably due to the Izu-Ogasawara's slightly warmer waters.
"We predicted the deepest fish would be there and we predicted it would be a snailfish," he said.
"I get frustrated when people tell me we know nothing about the deep sea. We do. Things are changing really fast."
Prof Jamieson is the founder of the Minderoo-UWA Deep Sea Research Centre.
On this expedition, which also explored the Ryukyu Trenche, he worked with a team from the Tokyo University of Marine Science and Technology.
Image Source, Minderoo-Uwa Deep Sea Research Centre
Landers use bait to draw fish into the view of cameras
The DSSV Pressure Drop and its crew-capable submarine, Limiting Factor, were used by the American adventurer Victor Vescovo in 2018 and 2019 to visit the deepest parts of Earth's five major oceans.
The ship and the submarine were sold last year to the marine research organisation Inkfish and sent for a refit in San Diego.
They have also been renamed - the ship is now Dagon and the submarine is Bakunawa - and will head back out to sea again in June with Prof Jamieson again acting as the chief scientist.
Prof Jamieson, who was born in Scotland, is credited with discovering not just the deepest fish in our oceans but also the deepest octopus, jellyfish and squid.
The world’s largest oceanic core complex is named after the reptilian monster from Japanese science fiction. Parts of the seabed feature were recently christened with the beast’s anatomy.
If you dive deep enough in the western Pacific Ocean, you may just come across Godzilla. A group of ridges on the seabed resembling the king of monsters was named after the beast’s body parts and will be officially recognized as such in nautical charts, the Japan Coast Guard announced in February.
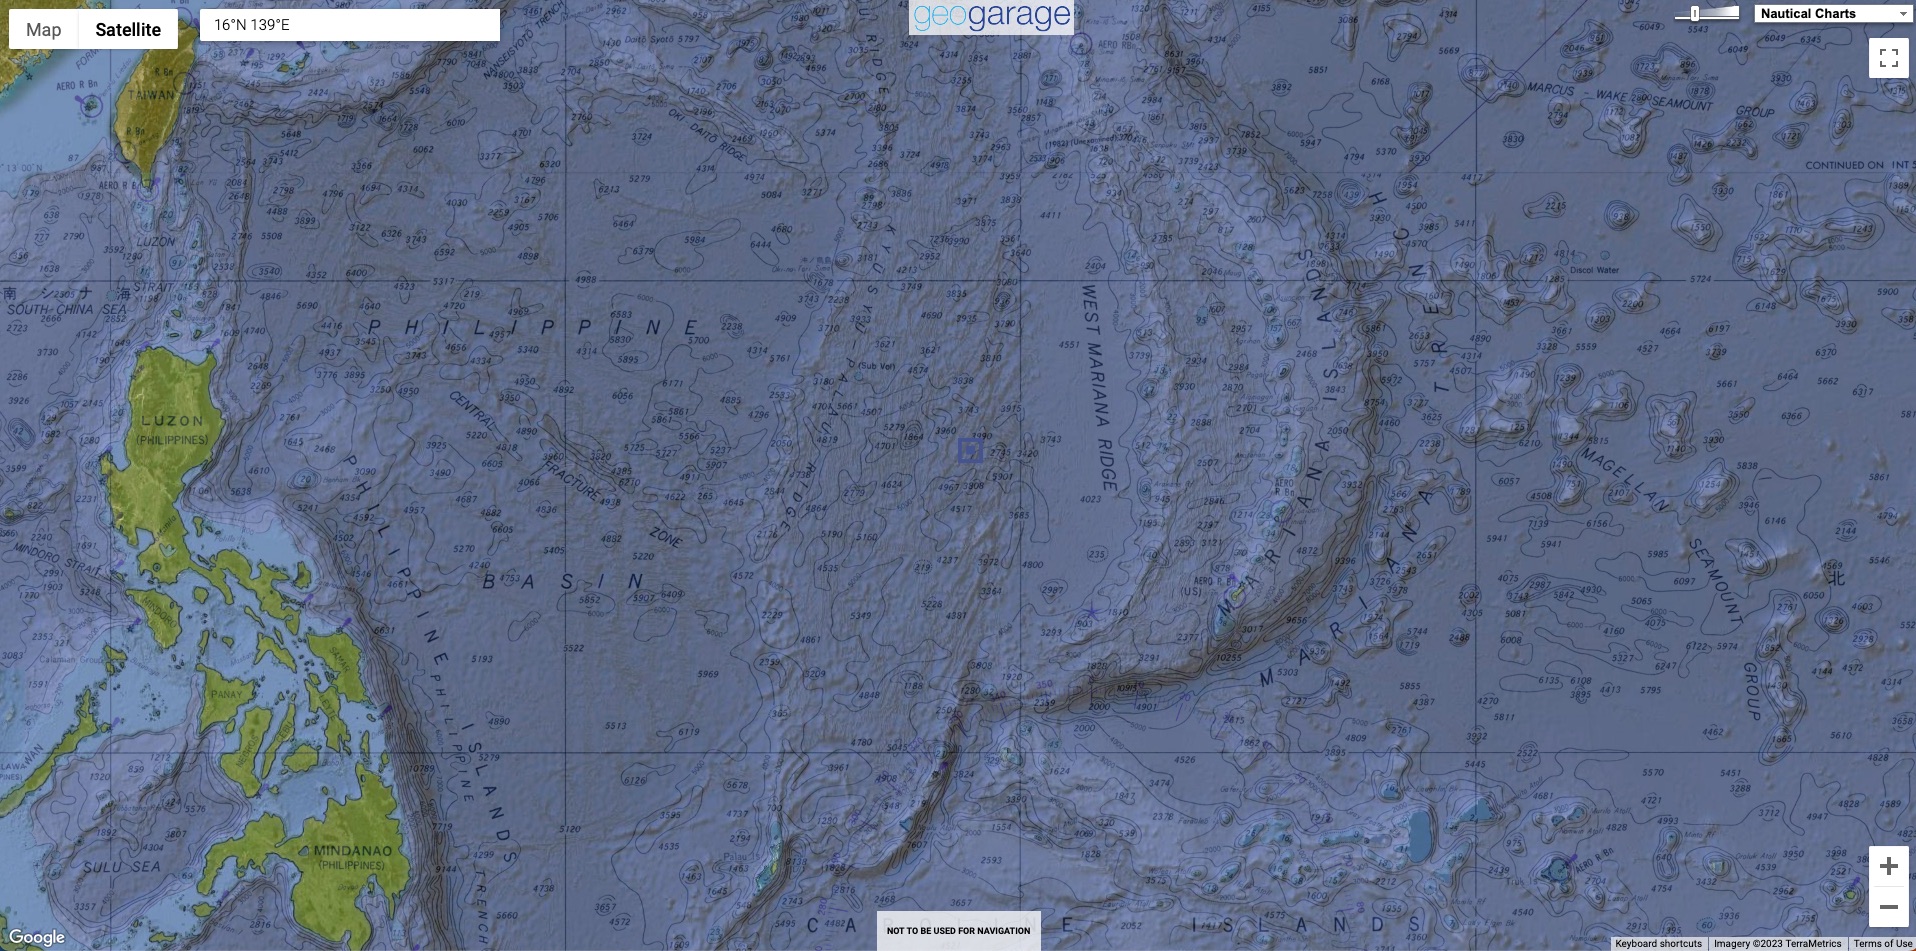
Localization with the GeoGarage platform (NGA nautical raster chart)
The feature known as the Godzilla Megamullion
Province is located in the Parece Vela Basin of the Philippine Sea,
around 600 kilometers (370 miles) southeast of Japan’s southernmost
coral reef, Okinotorishima. The ridges were firstreported after a 2001 survey of the area by marine geologist Yasuhiko Ohara and colleagues from the Japan Coast Guard’s Hydrographic and Oceanographic Department, who undertook several research cruises in the area.
“The Godzilla Megamullion is the largest known oceanic core complex on the Earth, and more than 10 times larger in area than those developed on the Mid-Atlantic Ridge.”
Also known as oceanic core complexes, megamullions are a relatively recent discovery, and scientists are still probing how they work. Megamullions are dome-shaped rises generally found along slowly spreading mid-ocean ridges. Characterized by ridgelike structures, megamullions are thought to form during spreading episodes when faults expose deep magmatic or mantle rocks on the seafloor.
Roughly 155 kilometers (100 miles) long by 55 kilometers (30 miles) wide, the Godzilla Megamullion has ridges reaching heights of 2,500 meters (8,200 feet). “The Godzilla Megamullion is the largest known oceanic core complex on the Earth, and more than 10 times larger in area than those developed on the Mid-Atlantic Ridge,” said Ohara, citing a 2014 study he coauthored that describes the feature’s characteristics.
It may take a bit of imagination, or creative squinting, but you might be able to make out the shape of Godzilla lying face down on the seafloor.
Hat Ridge and Head Peak are next to two deeper areas above the monster’s shoulders, which are situated near roughly parallel rises that form its arms, backbone, hipbones, legs, and tail. “The individual 14 names were the result of a beautiful coincidence,” said Ohara.
The ridges of the Godzilla Megamullion are named after the monster’s body parts: (1) Hat Ridge, (2) Head Peak, (3) West Shoulder Ridge, (4) Neck Peak, (5) East Shoulder Ridge, (6) West Arm Rise, (7) Backbone Rise, (8) East Arm Rise, (9) West Hipbone Rise, (10) North Tail Rise, (11) East Hipbone Rise, (12) West Leg Ridge, (13) South Tail Rise, and (14) East Leg Ridge.
Credit: Toho Co. Ltd./Japan Coast Guard
Shaded bathymetric map of the Godzilla Megamullion, showing the names of the prominent features (Ohara & Snow, 2009), and the locations of dredge sites and dives that recovered gabbroic rocks (Ohara et al., 2003; Harrigane et al., 2008, 2010, 2011).
The location of Dive 6K-1147 is shown by the white star.
The inactive spreading segments S1 and S2 (Ohara et al., 2001) are marked by red lines.
Map inset in upper left shows the major features of the western Pacific (after Ohara et al., 2001) with the location of Godzilla Megamullion marked by a red rectangle.
Localization with the GeoGarage platform (STRM bathymetry)
An Ocean of Monikers
Japanese researchers chose the Godzilla moniker for both the feature’s enormous size and its relatively close proximity to the monster’s island of origin. In the 1954 sci-fi classic produced by Toho Co., Godzilla emerged from the sea near the fictional Odo Island, which some fans situate in the region of Okinotorishima.
“As far as we know, it is the first time for such a feature [to be] named after a fictional monster.”
Toho’s “chief Godzilla officer,” Keiji Ota, said in a statement last year that it was an honor for the megamullion to be named after the monster, which has appeared in more than 30 films. “As far as we know, it is the first time for such a feature [to be] named after a fictional monster,” said Ohara.
The Pacific is riddled with interesting nomenclature. Japan has the Shichiyo Seamount Chain, named after the days of the week. Off Hawaii’s coast one can find the Musicians Seamounts, honoring composers such as Beethoven, Mendelssohn, Tchaikovsky, and Gershwin. Farther south, a collection of vents west of Easter Island has been given the names of cartoon characters such as Homer Simpson, Scooby, Tweety, and Road Runner.
Standardizing Names
With a 2022 approval by the Sub-Committee on Undersea Features Names (SCUFN), part of the General Bathymetric Chart of the Oceans (GEBCO) Gazetteer, the 20-year wait for the Godzilla Megamullion to get an official name ended; the recent decision was related to the giant reptile’s individual body parts.
“One can find names from mythology, flowers, painters, marine scientists, and famous historic people. It’s not easy sometimes to avoid sensitive issues,” said the International Hydrographic Organization’s Yves Guillam, who serves as SCUFN secretary. Despite Godzilla and Homer Simpson, he said, “in general, the SCUFN favors famous worldwide recognized high-level marine scientists, oceanographers, and hydrographers.…
SCUFN efforts are driven to remain realistic, pragmatic, efficient, based on the available short resources allocated to the international recognition of undersea feature names.”
Scientists hope the Godzilla Megamullion will yield insights into the dynamics of back-arc basins.
Dead fish in Florida. Beached whales in New Jersey. Sea urchins, starfish and crayfish washing ashore in New Zealand. Millions of rottingfish clogging up a river in the Australian outback. A mass fish die-off in Poland. Around the world, freshwater and marine creatures are dying in large numbers, leaving experts to puzzle over the cause.
In some cases, scientists say climate change may be leading to morealgal blooms and other events that starve fish of oxygen. Warming oceans and marine heat waves are driving sea creatures from their normal habitats. Human activities including coastal shipping are suspected in a spate of recent marine mammal deaths in the United States.
Here’s a look at some of the events that led to the deaths of swaths of aquatic creatures around the globe in the past year.
A killer red tide in Florida
Dead fish on a red tide near Fort Myers Beach, Fla., in 2019. The harmful algal blooms, which were present again this month, produce toxins that stain the water red and can kill fish and the seabirds that eat them, as well as sicken humans. (Andrew West/The News-Press/AP)
Harmful algal blooms, called red tides, have sent scores of dead fish ashore in southeastern Florida in recent weeks. A similar red-tide event killed off thousands of fish in the San Francisco Bay Area last summer.
So-named because in large numbers the algae stain the water red, these toxic blooms occur when winds blowing across the ocean surface push that water away and bring deeper, nutrient-rich waters to the surface. This process, known as “upwelling,” creates the ideal conditions for algae to bloom.
The algae produce toxins that can kill fish and the seabirds that eat them, and sicken humans. They also block sunlight from reaching underwater plants, depriving the fish of oxygen.
The Environmental Protection Agency predicts that climate change will alter the “timing and intensity” of coastal upwelling, potentially leading to more algal blooms along the West Coast. Warmer waters caused by climate change could also spur other types of harmful algae, the EPA says. Toxic blue-green algae prefer warmer temperatures.
Storms and extreme weather events, which global scientists predict will worsen in the future, can also lead to algal blooms by causing nutrients to run off from the land into the water. Authorities suspect an algal bloom was responsible for dead sea animals, including sea urchins, starfish and crayfish, washing up on New Zealand’s east coast in February during a particularly stormy Southern Hemisphere summer.
It’s not just coastal environments that are at risk of harmful algal blooms, according to scientists. Droughts, which may become more frequent because of climate change, can cause marine algae to invade freshwater systems, which has happened a number of times in freshwater lakes in the United States over the past couple of decades.
Algal blooms can be caused by humans, too. A rare golden algae thought to have led to a mass fish die-off in the Oder River that runs along the border between Germany and Poland last summer may have been caused by industrial discharges into the river, according to German researchers. Hundreds of little penguins wash up dead
A little blue penguin arrives at its nest in Caroline Bay in Timaru, New Zealand.
(Sanka Vidanagama/NurPhoto/AP)
When hundreds of little penguins washed up dead on New Zealand’s shores in June, local conservation officials said climate change was probably forcing the penguins to venture into deeper and colder waters to forage, making it harder for them to nest, breed and find food — and exposing them to deep-ocean predators.
On Australia’s southern island state of Tasmania, some sea creatures have nowhere to go to escape the rising heat because they can’t migrate farther south into the icy waters of the Southern Ocean, according to scientists.
Researchers found the population of common sea dragons (Phyllopteryx taeniolatus) had fallen by 57 percent over the past decade across the sites they were monitoring, Graham Edgar, a marine ecologist at the University of Tasmania, wrote in a recent article in the Conversation. Sea stars and sea urchins have also experienced “precipitous population declines” over the same period, he said.
According to a study last year, about a third of all marine animals could vanish within 300 years — as oceans absorb the excess heat created by humans, cooking them alive in their own habitats. Already by 2021, oceans contained more heat energy than at any point since record-keeping began six decades ago. Whales and dolphins die after washing ashore
A woman photographs a dead humpback whale that washed ashore in January in Lido Beach, N.Y. (Seth Wenig/AP)
There has been a spate of whale and dolphin deaths in the Northeast this winter. More than a dozen humpback whales and several critically endangered North Atlantic right whales were stranded on or near beaches from North Carolina to New York between December and early March, according to the National Oceanic and Atmospheric Administration. Eight dolphins also washed ashore in New Jersey recently.
Officials in New Jersey said changes in ocean temperature and water chemistry — which they attribute to climate change — could be drawing the fish that whales feed upon closer to land, putting the whales at greater risk of colliding with shipping vessels. Post-mortem examinations have indicated that ship strikes are the probable cause of many of the whale deaths.
Conservation activists are questioning whether preconstruction activity on a slew of offshore wind turbines could be to blame, although government scientists say there is no evidence linking offshore wind activities to the whale deaths. The turbines are slated for construction inan area where an unusual number of humpback whales have died since 2016, and where scientists and federal officials are working to prevent the North Atlantic right whale, one of the world’s most endangered marine mammals, from going extinct.
Thousands of fish killed by floods and hot weather blanket the Darling-Baaka River in Australia this month.
(Samara Anderson/EPA-EFE/Shutterstock)
Officials said a lack of oxygen sparked by rising temperatures and recent floods caused millions of fish to die in a river in southeastern Australia this month, although some locals blamed the government for water mismanagement.
Videos from the scene showed a thick carpet of silver fish carcasses on top of the water, and residents complained of the stench of rotting fish carcasses.
Joy Becker, an aquatic animal health expert at the University of Sydney, described it as a “blackwater event” where flooding caused a lot of organic material to enter the river system. That was followed by a period of “intense warm air temperatures” that led to a “very low oxygen event” in the river, she said. Fish need more oxygen to survive warmer temperatures, according to officials.
“Why do we have so much flooding and why do we have such extreme air temperatures?” Becker said. “What we’re seeing is a result of climate change.”
The Gulf of Gabès is an area of exceptional ecological, cultural and socio-economic importance. However, kiss trawling - a form of illegal bottom trawling - is devastating the marine ecosystems in the Gulf of Gabès and the livelihoods of local fishers who depend on them.
This film explains why it must be ended, swiftly and fairly.
 Geography
of Ancient World (Puranic Dwipas) as described in Puranas.
Geography
of Ancient World (Puranic Dwipas) as described in Puranas.

/2023/04/03/image/jpeg/sxtRyYwI1gW7SNTGB1t6TV1mfpoFPDCC9BcdpJTN.jpg)

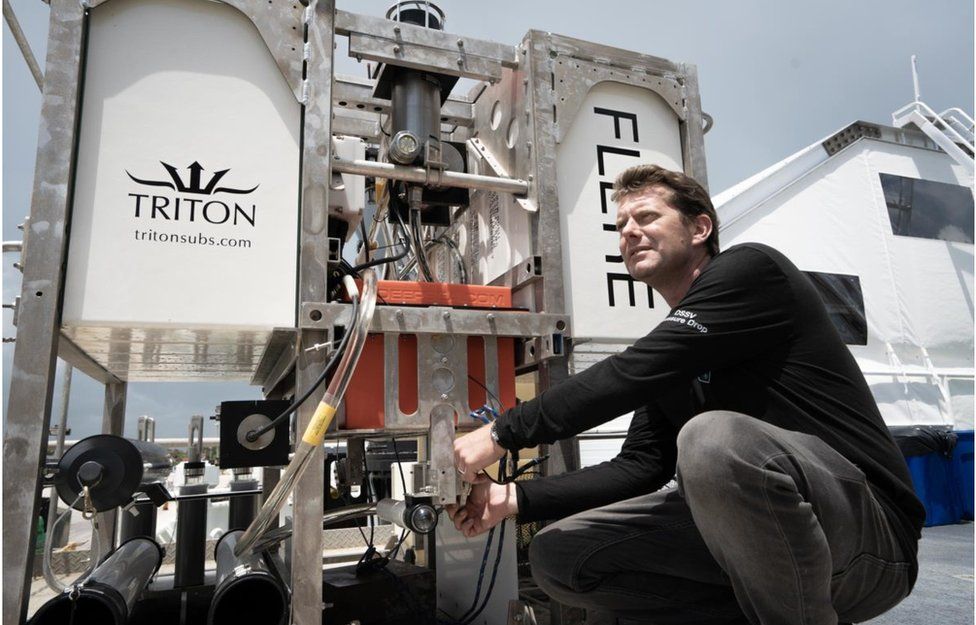 Image Source, Fivedeeps.Com
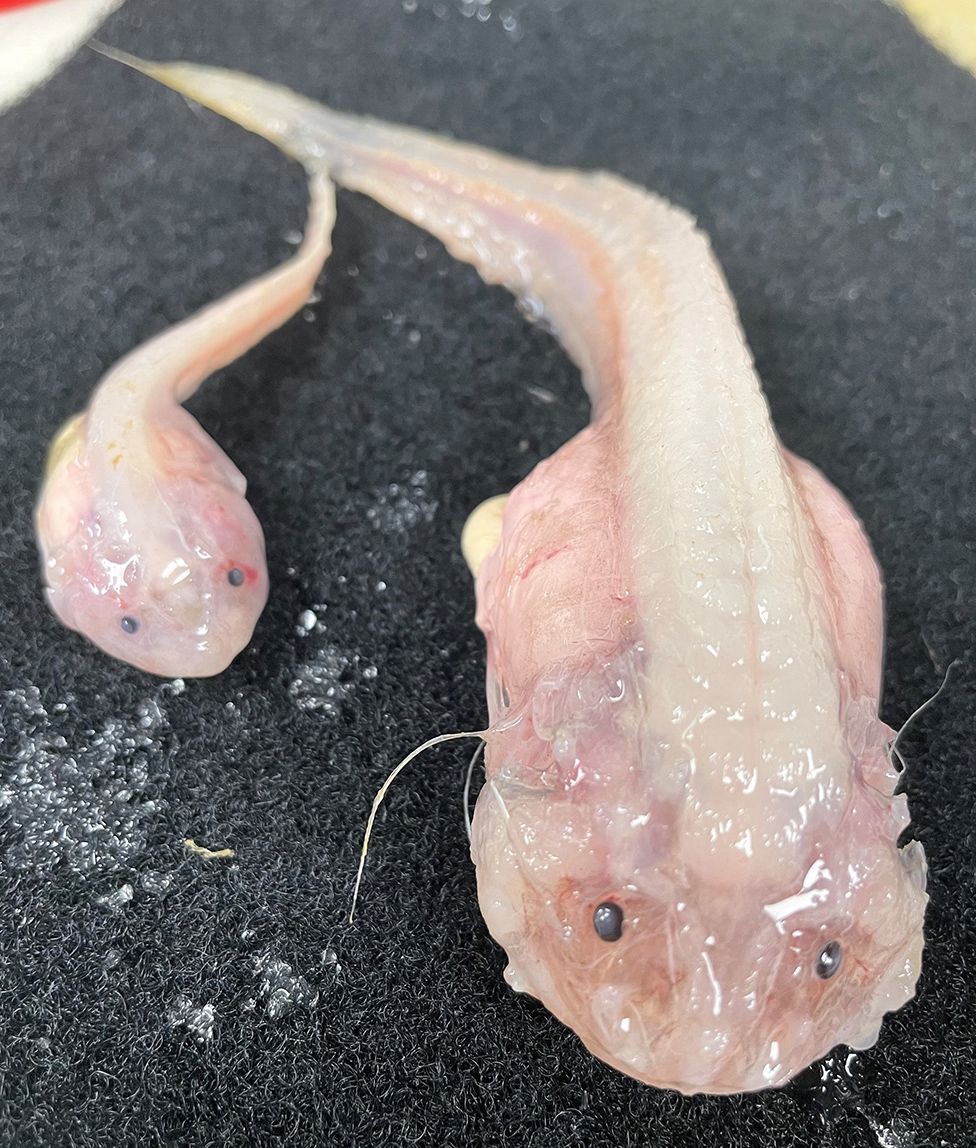
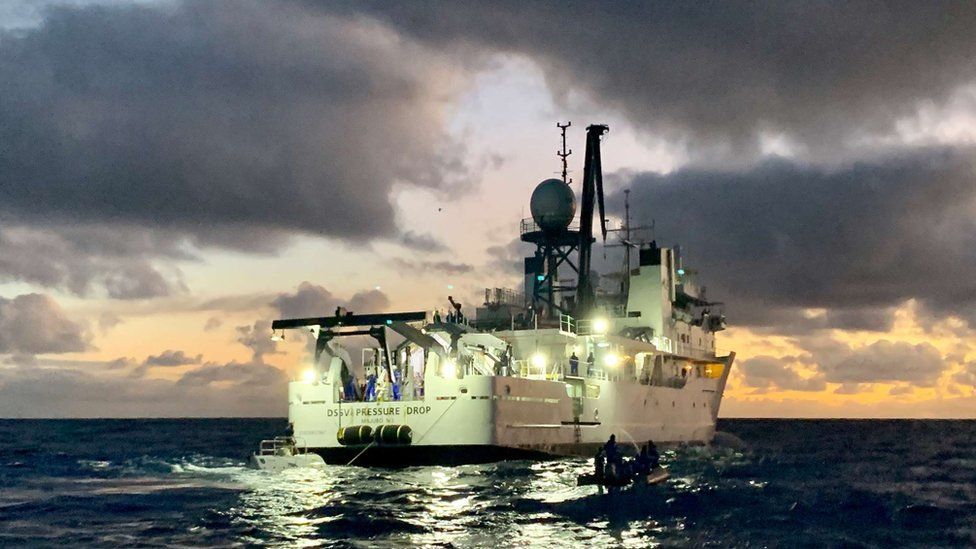 Image Source, Fivedeeps.Com
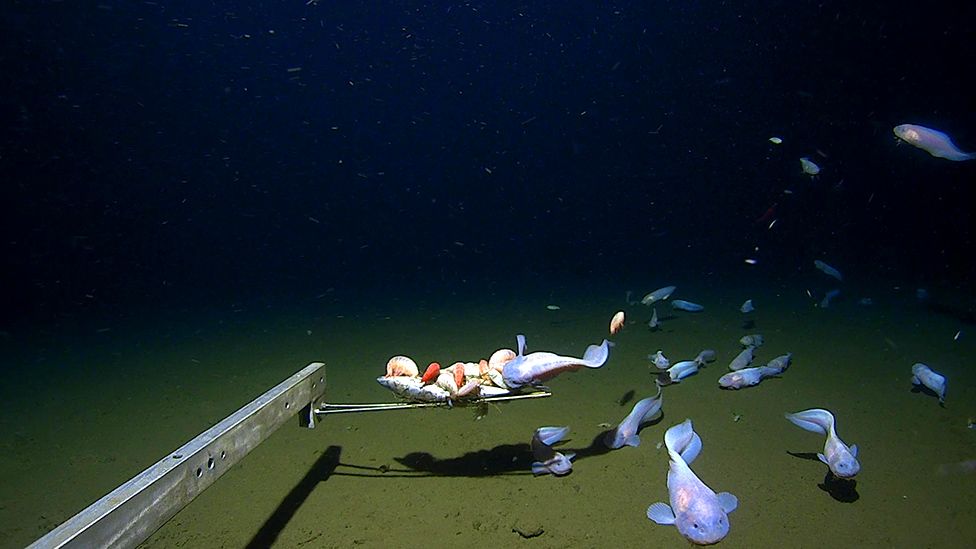 Image Source, Minderoo-Uwa Deep Sea Research Centre
 Credit: Tokyo Cheapo