Saturday, March 18, 2017

Book : Sea Charts of the British Isles

  Sea Charts of the British Isles, a 2005 book that is getting a paperback edition in next April.

Traveling along the British coastline, Sea Charts of the British Isles showcases a beautiful collection of charts containing a wealth of information about Britain's maritime history and the story of charting and surveying itself.

A 1482 recreation of a map from Ptolemy's Geography (2nd century)
showing the "Oceanus Germanicus", Great Britain & Ireland

The great names in British chart-making are all included, such as Captain Greenvile Collins, Professor Murdoch Mackenzie and his nephew of the same name, Graeme Spence, and William Bligh, who between them created the first structured attempts to survey and chart particular areas of the coast of mainland Britain as well as the more remote islands.

River Thames by Captn Collins

 Pland of the bay and harbour of Conway by Lewis Morris, 1748

Examples include several from Collins' “Great Britain's Coastal Pilot,” such as charts of Edinburgh and the Forth, the Orkney Islands, the coast of Ireland and the River Thames; the Chart of the Coast of Wales in St George's Channel and that of Milford Haven by Lewis Morris; The River Clyde and Glasgow by John Watt; and the Observation by Trinity House Pilots and Surveyors of the Downs covering the coast of Kent and the Goodwin Sands, as well as charts by other well-known European chart-makers, such as the magnificent example of the Coast of England from Dover to the Isle of Wight showing the Cinque Ports by Lucas Janszoon Wagenaer that dates from 1583.

 Lewis Morris' coastal charts of Wales.
In 1748 Admiralty encouraged the publication of Morris private survey of the Welsh coast and individual harbour plans.

John Blake, the author has researched maritime archives including the Admiralty Library, the National Maritime Museum, the Pepys Library, the UK Hydrographic Office, and the National Archives to reveal their unseen nautical records and portray the development of the sea chart.

Links :

Friday, March 17, 2017

UK at risk from ships covertly sailing into Europe after 'suspicious stops' near terror strongholds, say security analysts

Security analysts find vessels could be turning off tracking systems to evade authorities

From The Independant by Lizzie Dearden

Ships from conflict zones and terrorist strongholds are covertly sailing into European waters on suspected smuggling missions while attempting to evade detection, security analysts have warned.
Research by the Windward maritime data company found that in the first two months of 2017, 50 vessels with invalid registration numbers entered the UK, and 245 more with “suspicious” gaps in tracking data.


Another 40 ships sailed into Europe from near Isis-controlled territory in Libya after unexplained black-outs on their automatic identification systems (AIS) during January and February.
Ami Daniel, the firm’s CEO and cofounder, warned that the cases found so far are just a small fraction of covert voyages in Europe.

A Cyprus-flagged cargo ship made several 'suspicious stops' while tracking data disappeared off the coast of Algeria before journeying to the Scottish island of Islay
(image : Windward)

“There is a void,” he told The Independent. “No one is looking at what’s coming at sea – everyone is looking at planes, everyone is looking at land borders but no one is looking at shipping.
“It’s frightening but it’s the reality.”
The International Maritime Organization (IMO) requires all ships to be assigned a unique reference number that can be combined with AIS data to avoid collisions and monitor movements, course and speed.
But Windward found numerous cases where fake IMO numbers were being assigned to large cargo vessels, as well as blips in tracking that appeared to lengthy to be accidental.
Mr Daniel said AIS equipment, which communicates with satellites, is mandatory for all large international ships and passenger vessels.
“These are safety transmissions so definition you would not turn that off,” he added.
“People who turn off transitions are doing a trade-off in their minds.”
Analysts believe such a trade would most likely be made for illicit reasons to evade authorities, possibly while carrying illegal cargo such as weapons, drugs or people.

A Tel Aviv startup company is distinguishing itself in Israel and with clients on four continents by its ability to clear away the clutter on loosely regulated, often fraudulent high seas.
Using what it calls activity-based intelligence, Windward, a five-year-old maritime data and analytics firm here, probes beyond the ship-tracking services available on today’s market to validate identities of ocean-going vessels.
It compares their patterns of behavior and past associations with other ships — even where they loaded or didn’t load in specific ports of call. 

(image : Windward)

One of the vessels tracked was a Cyprus-flagged cargo ship owned by a Russian company, which broke from its normal pattern of voyages between Northern Europe and West Africa last month.
It diverted via the Mediterranean Sea to make its first port visit in Ukraine in December, before sailing back towards Gibraltar and engaging in “12 days of suspicious drifting” where the AIS repeatedly stopped transmitting.

 Cyprus-flagged cargo reefer visited Ukraine before entering the Mediterranean.
As it sailed towards Gibraltar it drifted for 12 days off the Algerian and Moroccan coasts, shutting down its AIS multiple times, on one occasion for 28 hours
(image : Windward)

The ship went dark near the port of Oran in Algeria, where gangs are active trafficking migrants, narcotics and illegal arms, and al-Qaeda is waging an Islamist insurgency.
On 9 January, it set sail for the UK and arrived in Scotland five days later, performing a “suspicious stop” off the coast of Islay for 11 hours, when analysts said illicit cargo may have been loaded on to smaller boats.

Ship Detection and Tracking
Localisation of vessels and small-sized boats with Pleiades satellite.

“The UK’s coastline is vulnerable,” a report by Windward found.
“The maritime domain is vast and laws are difficult to enforce.
“Ships with criminal or terror-related intentions can easily conceal their cargo – arms, drugs or people.
 Although ships arriving in EU ports have to declare their last calling point, researchers say the measure does not take account of behaviour at sea including diversions and offshore transfers.
As well as fake registration numbers and disappearing location transmissions, more than half of all vessels entering the UK were using “flags of convenience” – linked to tax avoidance, regulation dodging and crime – as well as hundreds had ship-to-ship meetings just outside territorial waters.

Libya to Greece: A large bulk carrier travelled from Libya to southern Crete — a deviation of its normal route.
It stopped off at the tiny resort of Kokkinos, raising fears of a people smuggling operation
(image : Windward)
There is particular concern over ships leaving conflict zones including Libya, Syria, Yemen and Somalia, which have been tracked carrying out “suspicious movements” off the coast of Greece and other European nations.

Identification of the hijacked MV Sirius Star anchored at the Somali port of Harardhere
(image : TerraSAR X)
Many lose transmission while anchoring around a mile offshore – far from port but close enough to land for smaller vessels to transfer goods.
“You might have ship come out of Libya, conduct a ship-to-ship transfer near Malta, change registration numbers and someone has done business with Isis,” Mr Daniel said.
Smuggling gangs based in the war-torn country packed disused cargo ships and fishing vessels with hundreds of refugees at the start of the Mediterranean crisis, sailing them into open water before calling for aid and abandoning what became known as “ghost ships”.

 By mid-January the reefer was off the coast of Islay,
spending 11 hours at a spot where there are no ports
(image : Windward)

Unseaworthy dinghies are now dominantly used but there have been reports of groups using commercial vessels to transport migrants from port to port before launching them towards Europe.
Mr Daniel, a former officer in the Israeli navy, said the world of shipping presented an easier method of expansion for terrorist groups and criminal organizations than more tightly regulated airports and land borders.

 Libya to Greece.
An Italian-flagged oil tanker sailed north fromLibya towards Greece.
En route it made two unusual stops — one for seven hours near Crete, and the second for 15 hours close to the mainland
(image : Windward)

“They can transport people, weapons, drugs, they can finance wars,” he added.
“It’s still the Wild West in these seas.”
European crime agency Europol said it was monitoring people smuggling as part of the refugee crisis but that the primary responsibility for maritime security lay with member states.

 Example of vessels detected with RADARSAT-2 outside the coast of Somalia and correlated with AIS data.
Green circles indicate positions of vessel reported with Satellite AIS.
Red circles indicate positions of non-reporting vessel, only detected in the satellite image (RADARSAT-2 SCANSAR Narrow Mode © MacDonald, Dettwiler & Associates Ltd., 2009)
(image : Kongsberg)

A Home Office spokesperson said: “Border Force monitors vessels sailing off our coastline for suspicious behaviour, including the disruption of AIS.
“The National Maritime Information Centre brings together officers from Border Force, the National Crime Agency, police, Royal Navy, coastguard and others to share intelligence, detect and respond to a range of threats.
“This approach is working. In 2015, a vessel carrying more than three tonnes of cocaine was detected despite turning off its AIS system.”

Links :

Thursday, March 16, 2017

Boaty McBoatface submarine set for first voyage

'Boaty McBoatface' to leave port.
The yellow submarine dubbed "Boaty McBoatface" is set to leave for Antarctica this week on its first science expedition.
Prof Russell Wynn explains the workings of Boaty McBoatface

 From BBC by Jonathan Amos

The yellow submarine named Boaty McBoatface is set to leave for Antarctica this week on its first science expedition.
The robot is going to map the movement of deep waters that play a critical role in regulating Earth's climate.
Boaty carries the name that a public poll had suggested be given to the UK's future £200m polar research vessel.
The government felt this would be inappropriate and directed the humorous moniker go on a submersible instead.
But what many people may not realise is that there is actually more than one Boaty.
The name covers a trio of vehicles in the new Autosub Long Range class of underwater robots developed at Southampton's National Oceanography Centre (NOC).
These machines can all be configured slightly differently depending on the science tasks they are given.


The one that will initiate the "adventures of Boaty" will head out of Punta Arenas, Chile, on Friday aboard Britain's current polar ship, the RRS James Clark Ross.
The JCR will drop the sub into a narrow, jagged, 3,500m-deep gap in an underwater ridge that extends northeast of the Antarctic Peninsula.
Referred to as the Orkney Passage, this is the gateway into the Atlantic for much of the "bottom-water" that is created as sea-ice grows on the margins of the White Continent.
Frozen floes will cool and densify the water immediately below them, and this then generates a current that slides into the abyss to eventually move northwards.
And in traversing the Orkney Passage, the bottom-water can feed the "great ocean conveyor" - the relentless system of deep circulation that helps redistribute all the heat energy that has built up in the climate system.
Boaty's mission will be to survey conditions in the passage.
Scientific moorings anchored in the area already gather some data, but the robot's mobility and autonomy means it can now build a full, three-dimensional picture of what's happening many hundred of metres below the surface.

 The JCR will eventually be replaced by the RRS Sir David Attenborough 

Scientists have good evidence that the bottom-water is warming.
Quite why is not clear but it could have major implications, says Prof Mike Meredith from the British Antarctic Survey (BAS).
"One of these is sea-level rise because if you make water warmer obviously it expands and that pushes the sea level up," he told BBC News.
"But it also has relevance for benthic ecosystems. So, the animals that live on the seabed can typically cope well with low temperatures but not all of them can cope with changes in temperatures. The fact that this water has been getting warmer may have significant consequences for these animals."

Bottom-water is generated at the margin of the continent and then spills north into the Atlantic

The recorded warming could be the result of a change in the way the deep current is moving through the passage.
If there is greater turbulence as the bottom-water flows over the jagged terrain, it might be mixing more warm water downwards.
Boaty will have a probe on its nose to assess this.
"There are 'rapids' and 'waterfalls' that are occurring within the channels and valleys that surround underwater mountains in the passage," explained Dr Eleanor Frajka-Williams from Southampton University.
"Boaty is going to make measurements within these 'streams' and 'rivers' of the smallest-scale motions to try to understand how that water is being changed as it leaves the formation regions around Antarctica and then spreads out over the world's oceans."

 The Autosub LR class of vehicles is beginning full science operations after successful sea trials

And while this particular robot is hard at work in the Southern Ocean, its two siblings back in Southampton are being prepared for their own expeditions.
Scientists are queuing up to use them, and to exploit their ability to autonomously patrol the oceans for weeks, even months, on end.
"Having three Boaty vehicles in the fleet means we can cover a much wider range of environments and geographic locations than we could with just one," said NOC's Prof Russell Wynn.
"So, one vehicle might be going out to Antarctica and surveying around and under the ice; another might be going to the deepest parts of the ocean, down to 6km; and another might be doing something more applied in, for example, the North Sea.
"We're getting lots of proposals and it's great that we can meet that demand," he told BBC News.
The Dynamics of the Orkney Passage Outflow (DynOPO) expedition is a collaboration between BAS, the University of Southampton and NOC.

Links :

Wednesday, March 15, 2017

Wind power takes to the seas

courtesy of Nicolas Rapp

From Fortune by Brian Dumaine

The first U.S. offshore wind project is up and running.
Is it a sign of things to come?
It was a brisk Sunday morning in October 2015, and Deepwater Wind CEO Jeffrey Grybowski’s cell phone buzzed.
His construction manager, who was driving piles 200 feet beneath the floor of the Atlantic Ocean, three miles from Block Island, R.I., said he had to halt work on the company’s wind farm because a humpback whale had meandered near the site.
Under the Endangered Species Act, it’s illegal for humans to “harass” certain marine mammals, and loudly pounding steel into the ocean floor would certainly qualify.
Worse, from Grybowski’s perspective, the law permits driving in piles only during certain months, when the whales aren’t migrating to the area.
Bad weather was moving in, and if his team didn’t finish the project that day, Grybowski would have to wait another six months before the feds would allow him to sink in the final post for the five giant wind turbines that would provide the island’s power.
That meant millions in losses and a disaster for his small company.
Recalls Grybowski: “It was a nail-biting moment.
We had no way of knowing when the whale would stop hanging out.”
Over the next few hours Grybowski hounded his foreman for information.
How far away was the whale? Was it moving at all? Was it drifting closer to the construction site?
By midafternoon, he had only a few hours left to finish before time ran out.
Grybowski’s cell rang again, and he learned that with a magnificent flip of its flukes the humpback had swum away.
The crew then sank the last piling, just making the deadline.

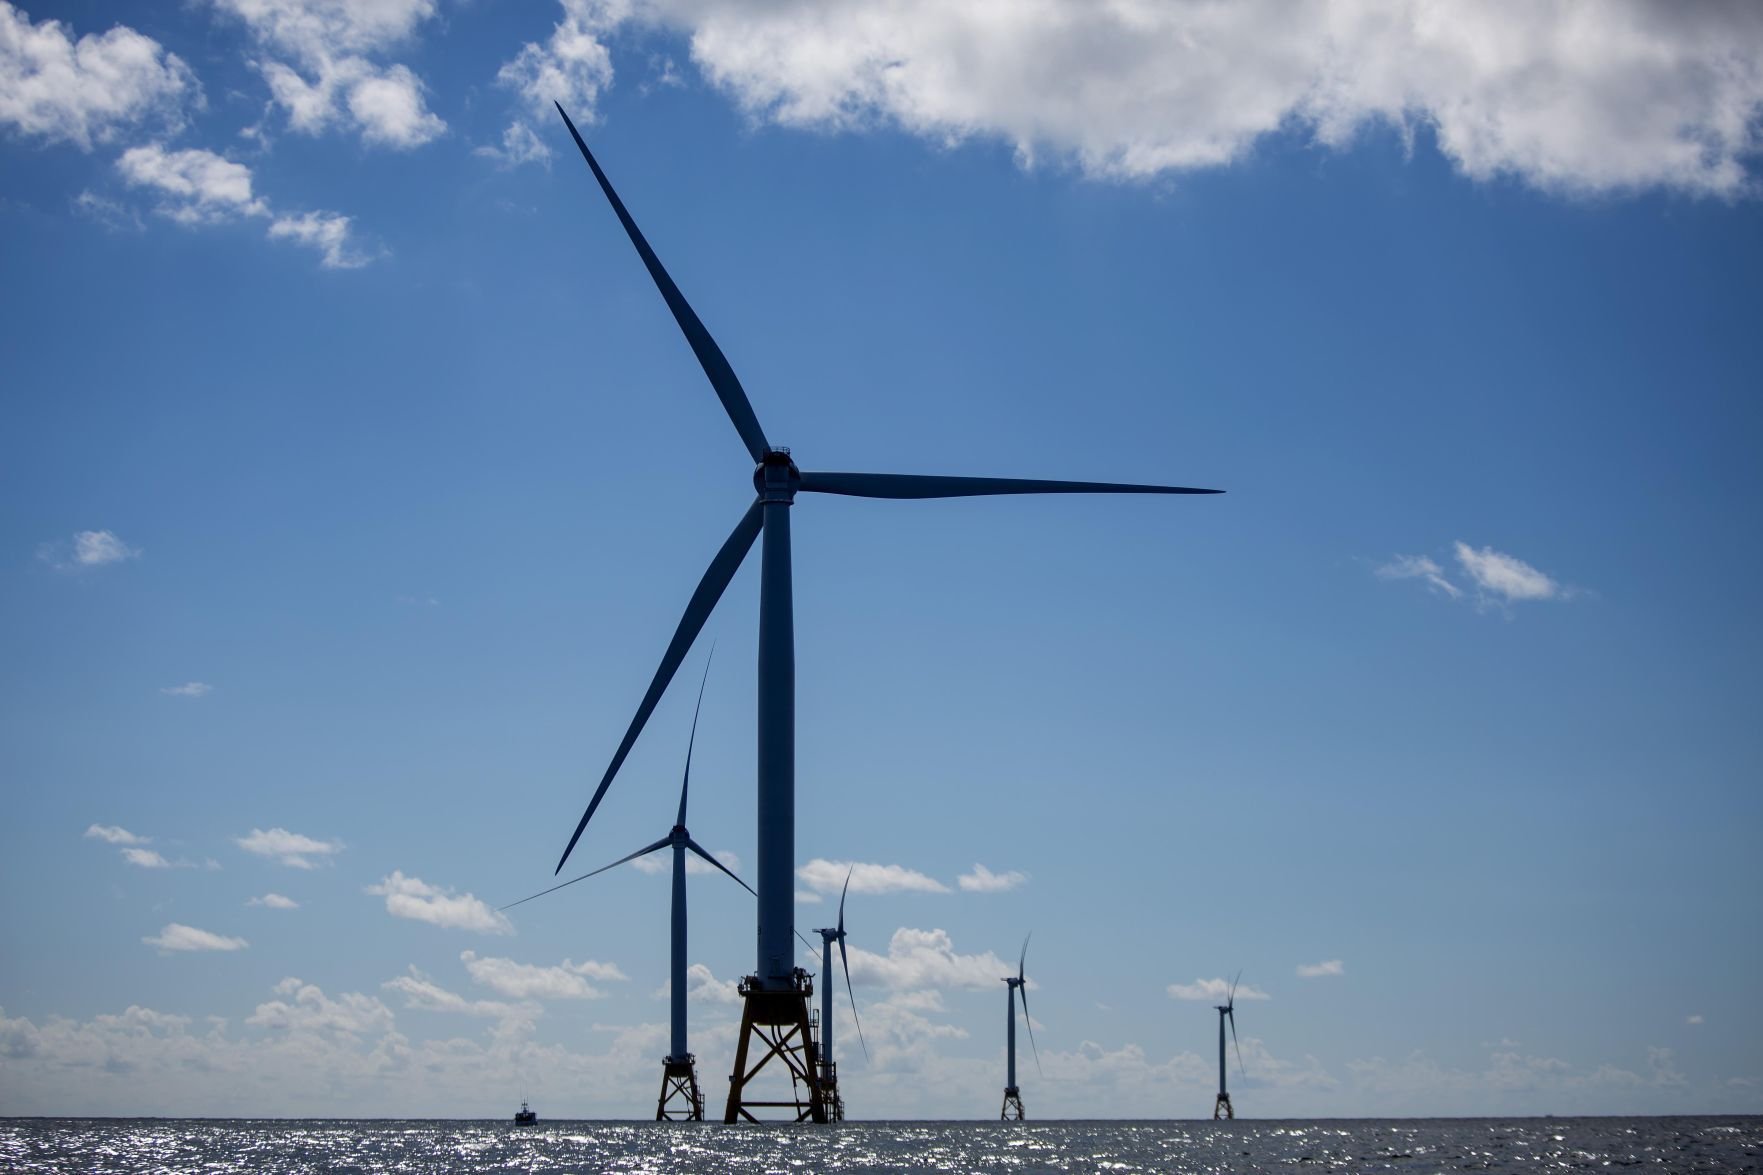
 Deepwater Wind's project near Block Island, R.I.
Courtesy of Deepwater Wind

No one ever said it would be easy to build the first offshore wind farm in America.
But in December, Deepwater Wind’s Block Island turbines started spinning out electricity.
What the company accomplished is much more than replacing the island’s dirty, diesel-power plant with clean wind.
The project marked the beginning of what many experts and investors are betting is a boom in offshore wind along the northeast coast of the U.S.
After decades of false starts, bankrupt projects, and protests—Ted Kennedy once complained that a proposed wind farm would ruin the view from his Hyannis Port compound—offshore wind is looking practical.
Europe has been building offshore wind since the early 1990s, but American developers couldn’t figure out how to make those farms compete with cheap coal and natural gas.
In the past few years, however, the turbines have gotten larger and more efficient, and the installation costs have dropped.
As a result, the wholesale cost of European offshore wind power has fallen from an average of 20¢ a kilowatt-hour (kwh) to less than 10¢.
And the cost curve keeps sloping downward.
For the first time, U.S. investors see a path to profitability.
The gold rush has begun.
In the U.S., 23 offshore wind projects totaling 16 gigawatts (GW), the equivalent of about 16 nuclear power plants, are on the drawing board.
Almost all are located along the northeast coast.
Over the past year, Denmark’s oil and gas giant Dong Energy bought federal leases off the coasts of Massachusetts and New Jersey.
Norway’s Statoil won a 33-round auction to secure a 79,000-acre site south of Jones Beach on Long Island for $42.5 million, far more than the $16 million generated by all earlier offshore wind auctions combined.
Shell has been sniffing around.
Wall Street players such as Citigroup (C, -0.15%), HSBC (HSBC, -1.00%), and, as we’ll see, D.E.
Shaw are lining up to finance the most promising projects.

 Deepwater Wind is proud to be America’s leading offshore wind developer

t the same time, state governments are generating favorable winds.
Last summer, Massachusetts Gov. Charlie Baker, a Republican, signed a law that requires that state to procure 1.6 GW of offshore wind by 2027.
Not to be outdone, New York’s Democratic governor, Andrew Cuomo, committed to develop 2.4 GW of offshore wind as part of his pledge to get 50% of the state’s power from renewables by 2030 (roughly twice the current percentage).
As Cuomo tells Fortune: “New York will continue to advance the largest offshore wind development in the nation that will bring resilient and reliable power, create jobs, and combat climate change.”
All told, the U.S.
Department of Energy projects that offshore wind will produce 86 GW of power by 2050—about 7% of America’s current electricity demand.
That’s up from virtually zero today.
(Land-based wind now delivers 82 GW in the U.S., vs. just 4 GW 15 years ago.)


If offshore wind can follow such a trajectory, that would make it a multibillion-dollar industry and create as many as 600,000 jobs during the next few decades.
Offshore wind has the long-term potential to produce twice as much electricity as America currently consumes, according to the National Renewable Labs, part of the DOE.
It conservatively estimated offshore wind capacity in the U.S.
by taking into account only areas likely to be developed because of water depth, distance from shipping lanes, and nearness to shore.


But making offshore wind viable in the U.S. won’t be easy.
New projects in the U.S. cost roughly twice the national average of 7.5¢ for all sources of electricity.
One reason is that America doesn’t have the infrastructure and supply chains in place to build offshore wind farms affordably.
In addition, the permitting process is complicated and time consuming, and a new administration in Washington has made it clear that coal—and not renewable energy—will be its priority.
Industry backers argue that offshore wind will follow the same steep cost decline of other technologies.
The price of land-based wind (without any subsidies) plummeted from 14¢ to 4.7¢ a kilowatt-hour from 2009 to 2016, according to financial advisory and asset management firm Lazard.
That’s cheaper than the energy from a new natural-gas or coal plant.
Now we’re seeing the start of a similar downward trajectory for offshore wind.
The DOE estimates that the price of offshore wind will drop by 43% by 2030, which would make it nearly competitive with other new sources of electricity.
Irene Rummelhoff, who runs Statoil’s offshore wind and other “new energy” businesses, is more optimistic: “Two years ago they said European wind wouldn’t be competitive until 2030.
We became competitive last November. In the U.S. it can happen extremely quickly too.”


Deepwater’s small operation off Block Island doesn’t prove that wind power is competitive.
The island had a small diesel plant that was expensive to run.
The wind power replacing it is cheaper than diesel fuel but still more than double the national electricity rate.
But wind power can be competitive in select markets—heavily populated parts of the country where building a new fossil-fuel plant is expensive, if even possible.
In other words, along the Northeast Corridor.
That’s what Grybowski hopes to prove with his next project: building and operating the South Fork Farm, a 90-megawatt (MW) plant—enough to power 50,000 homes—30 miles off the coast of Montauk, and serving the eastern tip of Long Island.
The project, which is slated to come on line as early as 2022, will provide much-needed power when the hedge fund kings and celebrities descend on the Hamptons each summer and thousands of megamansions start drawing outsize loads of power.
Grybowski thinks that if he can get it up and running, it might just provide the gust of momentum the industry needs to take off.


By the look of its bright but cramped office suite in downtown Providence, Deepwater Wind might seem like a shoestring operation run by a band of Birkenstock-wearing environmentalists.
It’s anything but.
The company is principally owned by D.E.
Shaw, a New York hedge fund and private equity firm, which manages $40 billion in assets.
And Deepwater’s chairman, Bryan Martin, is no tree-hugging idealist.
A former partner at J.P. Morgan’s private equity unit, he has decades of experience building huge oil and gas projects and, later, solar and onshore wind farms as CEO of D.E. Shaw Renewable Investments, his current position.
Believing that offshore wind could be the next big economic win, Martin first invested in then-fledgling Deepwater in 2007 and hired Grybowski, a lawyer and a former chief of staff to a Rhode Island governor; Grybowski moved up to CEO in 2012.
Martin saw that Grybowski, an animated, quick-talking executive with an infectious laugh, had the drive to run projects like the Block Island farm, plus the political experience to navigate the complexities of federal and state policies.
(The company is private and will not release financial data.)
Martin and Grybowski saw a huge opportunity to replace aging fossil-fuel plants in New York and New England.
Some of the coal, oil, and nuclear facilities, at 50 to 60 years old, have exceeded their expected lives.
New York State is closing the Indian Point nuclear operation, which supplies the equivalent of 25% of New York City’s power.
Long Island is scheduled to shut three or four of its fossil-fuel plants over the next few years.

But replacing them with new fossil-fuel or nuclear plants, in blue states populated with citizens concerned about clean air and climate change, would be costly and controversial.
When the local utility simply tried to install larger power poles on the leafy streets of East Hampton a few years ago, the public outcry was so great that the power company had to back off.
Says Martin: “We have limited cost-effective options to replace aging power plants in New York and New England.
Offshore wind will be one of the lowest-cost sources of new power.”
Geography is also working in the favor of offshore power.
Finding enough land to build giant solar and wind farms in the heavily populated east, where land values are high, poses a problem.
(The town of East Hampton spent $7 million just to buy the rights to prevent 20 acres from being developed.)
Why not build wind farms in upstate New York, where land is cheap and plentiful?
As it turns out, the state doesn’t have the grid capacity to move the power from upstate to the population centers in the south, and building miles of new high-voltage power lines would face serious local resistance.
The technology enjoys another advantage in the region: The Atlantic is very shallow—typically 90 feet or less—near the East Coast, making it cost-effective to drive in the pylons that support the turbines.
Plus, the wind blows harder and more steadily there than in many other places.
Offshore wind tends to peak in the afternoon and early evening; onshore wind blows stronger at night.
The biggest demand in summer comes in the afternoon and evening, when the sun is hottest and people return home from work (and the beach) and turn up their air-conditioning.
It’s a perfect match.
The result: a surge in interest from developers.
When the Long Island Power Authority (LIPA), the agency responsible for supplying power to Long Island, asked for bids for the South Fork Wind Farm, some 20 companies, including ones that wanted to build natural-gas and biofuel plants, vied for the project.
Deepwater Wind won the bidding.
Under the 20-year contract, Deepwater will provide LIPA with electricity that will likely cost in the vicinity of 17¢ a kilowatt-hour.
In addition, the project will help LIPA fulfill its pledge to add more renewable energy to the grid.
Says Tom Falcone, the CEO of LIPA: “We hope the South Fork Farm will serve as a gateway project for us.
By starting to develop that resource, the next wind farms will cost a lot less.”

To deliver electricity at that price, Grybowski will have to do some scrambling.
For one thing, building an offshore wind farm requires special ships and equipment.
No such fleet exists in the U.S., and federal law (meant to protect American shipping) prohibits hiring European operations, which have been doing this type of work for years.
Grybowski turned to the fossil-fuel industry.
Because of the slump in oil and gas drilling, many service vessels in the Gulf of Mexico are sitting idle.
For the Block Island project, Grybowski hired Gulf Island Fabrication of Louisiana to build the foundation and another Louisiana company to help install the turbines.
“The Gulf ship owners see offshore wind as a big opportunity,” says Grybowski.
For the South Fork project, the CEO anticipates, he’ll be working out of multiple ports, creating hundreds of jobs.
Little by little he hopes to achieve the scale of the operations in Europe.
Deepwater is already making progress in its quest to cut costs.
The company says the $740 million South Fork farm will be 30% less expensive per unit of energy than the Block Island project.
Prices of turbines are falling, and Deepwater thinks it can obtain permits more quickly this time.

 GE-Alstom Block Island wind farm off Block Island, Rhode Island

Offshore turbines boast advantages compared with their land-based brethren.
They are much larger because there is simply more wind to harness over the ocean.
Typically, a landlocked turbine generates 2 to 3 MWs.
The ones Deepwater Wind uses for the Block Island wind farm were made by GE (GE, -1.07%) and crank out 6 MWs.
One project in Europe has deployed 8 MW turbines, the largest in the world, made by Vestas.
Each of the three blades is 265 feet long—bigger than the wingspan of a 787 Dreamliner.
From waterline to the tip of the blade, the turbines stretch 722 feet, more than twice as high as the Statue of Liberty and its base combined.
These behemoths are getting smarter and more efficient.
Because offshore wind turbines are bigger, taller, and in windier areas, they are 50% efficient, meaning that over time they convert half the theoretical wind power into electricity.
That efficiency level is significantly higher than land-based ones.
The giant turbines can rotate 360 degrees, and the blades can tilt to capture the best angle of the wind.
Some experts think that efficiency number could reach 55%, and manufacturers like GE are applying advanced software to do the job.
Says Markus Rieck, managing director of commercial operation, sales, and marketing for GE’s offshore wind business: “Every 1% improvement in efficiency generates a lot of cash for our customers.” In one example, turbines could be designed to communicate with one another.
Those nearest the wind might be blocking the airstream for those in the rear.
GE’s system, still in development, could use algorithms to adjust the angle of the turbines so that the maximum amount of power is produced.
The software can also be used to predict when the turbines are likely to break or need maintenance to avoid sending a worker up—sometimes in horrendous weather—to check what’s wrong.
GE currently uses similar software for its jet engines.
Next up: drones with cameras that could fly up to the turbines to detect material failure, rust, or a missing bolt.

Such technological progress will need to overcome the changed political climate in Washington.
The new administration is unabashedly hostile to renewable energy, and soon after Trump’s Inauguration the White House took down all mention of climate change on its website.
Still, there are good political and economic reasons to support offshore wind.
This fledgling industry is just the kind of heavy steel and construction project that the new President envisions for his infrastructure program.
And offshore could bring a dollop of sorely needed revenue to the Treasury.
The DOE estimates that annual lease payments for offshore wind projects could total $440 million annually through 2050.
Certainly, the Republican-controlled Congress could decline to renew the subsidies that wind power now enjoys.
The production tax credit, which is slated to phase out by 2020, helped the onshore wind industry become competitive and create 100,000 jobs, most of them in red states.
Onshore wind doesn’t need the tax credit any longer, but why not extend it for offshore wind to help create more high-paying jobs more quickly?
Even if Congress doesn’t come through, New York State is looking to provide some financial incentives for offshore wind.
Says John Rhodes, president of Nyserda, the agency that oversees the state’s energy policy: “We want developers to come here with the certainty that they can build the wind farms and sell the power.”
Some help from Washington would be nice, but Grybowski and his investors aren’t counting on it.
They believe they can build out this industry, if they have to, without much in the way of government subsidies.
If they can deal with the endless technical challenges, and even the occasional pesky humpback whale, they just may have the gumption to go it on their own.

Links :

Tuesday, March 14, 2017

The world’s oceans are storing up staggering amounts of heat — and it’s even more than we thought

 Eighty to 90 percent of the heat from global warming is going into Earth's oceans.

From Washington Post by Chelsea Harvey

The world is getting warmer every year, thanks to climate change — but where exactly most of that heat is going may be a surprise.

As a stunning early spring blooms across the United States, just weeks after scientists declared 2016 the hottest year on record, it’s easy to forget that all the extra warmth in the air accounts for only a fraction of the heat produced by greenhouse gas emissions.
In fact, more than 90 percent of it gets stored in the ocean.
And now, scientists think they’ve calculated just how much the ocean has warmed in the past few decades.


A new study, out Friday in the journal Science Advances, suggests that since 1960, a staggering 337 zetajoules of energy — that’s 337 followed by 21 zeros — has been added to the ocean in the form of heat.
And most of it has occurred since 1980.
“The ocean is the memory of all of the past climate change,” said study co-author Kevin Trenberth, a senior scientist at the National Center for Atmospheric Research.
The new value is a number that significantly exceeds previous estimates, Trenberth noted.
Compared with ocean warming estimates produced by the Intergovernmental Panel on Climate Change, the new values are about 13 percent greater.
This is the result of a new methodology for estimating ocean warming, involving a series of steps “that really make this paper different than previous ones,” Trenberth told The Washington Post.

This visualization shows the locations of the ARGO buoy array over time.
When the buoys are above water, the lines are brighter; when the buoys are under water, the lines are fainter.
The ARGO buoys measure ocean salinity, column temperature, and current velocities.
This version of the visualization uses a slow camera move.
Credit: NASA/Goddard Space Flight Center Scientific Visualization Studio

In previous decades, there have been a lot of challenges associated with monitoring temperature changes in the ocean.
Before the year 2000 or so, most monitoring instruments had to be deployed from ships.
This mean that scientists only had the most reliable data for parts of the world that lie along major shipping routes.
In the past 15 years, though, scientists have developed the “Argo” network, a system of free-drifting devices that are designed to periodically adjust their buoyancy, so they can sink several thousand meters into the sea, collect measurements, and then rise back up to the surface.
There are now about 3,500 of these devices deployed throughout the world’s oceans, leading to a much better dispersal of observations.


Argo is the largest ocean research project in the world and aims to report the climatic status of the world oceans in real-time every 10 days and report the data for use by anyone, anywhere on the planet.
The global array is now in place and is reporting as planned.
Accomplishing this required the cooperation of 24 nations deploying ocean-going robots in support of the global array.
Today the Argo array is gathering more data each year from the Southern Ocean than has been acquired by the sum of all previous research in that ocean.
The data are being used for seasonal climate forecasting, ocean exploration, fisheries management and innumerable other purposes.
It can be accessed in real time by anyone who has a connection to the internet.

The new study, which was led by Lijing Cheng of the Chinese Academy of Sciences and included other scientists from that institution, from the National Center for Atmospheric Research, and from the National Oceanic and Atmospheric Administration, employs a new methodology for using both the recent Argo measurements and past observations from ships to produce a continuous series of estimates from 1960 to 2015.
The scientists incorporated an updated database of pre-Argo measurements that have been corrected for certain biases, as well as information from climate models, and extended existing observations of ocean conditions taken at specific locations to larger areas of the sea.
They then conducted a comparison of recent Argo data with measurements created using their new methodology and found that the method produces true-to-life results.

 Earth scientist Alex Gardner reveals a world of rapid change as seen through the eyes of a NASA glaciologist.
Glaciers and ice sheets hold massive amounts of freshwater locked up as ice.
These stores of freshwater feed water supplies that support millions of people around the world, raise global sea levels, and can even change the rate of Earth’s rotation.
It is now nearly certain that as Earth’s atmosphere and oceans warm over the coming centuries, glaciers and ice sheets will continue to retreat and sea levels will continue to rise.
The big question now is at what rate and by how much?

The results suggest that the ocean has been sucking up more heat than previous research has indicated.
In fact, according to Trenberth, the new estimates help explain observations of global sea-level rise that scientists have had difficulty accounting for until now.
A certain percentage of sea-level rise can be attributed to the expansion of ocean water, caused by rising water temperatures, while the rest comes from melting glaciers.
Scientists have good estimates of how much melting ice is going into the ocean, but they’ve come up a bit short in the past in trying to reconcile the rest of the planet’s observed sea-level rise with their estimates of how much the ocean has warmed in recent decades.
“This actually fills in the gap,” Trenberth said.
The study also suggests that the extra heat is not being stored evenly throughout the oceans.
The Atlantic and Southern oceans, in particular, are the biggest new heat reservoirs, the results indicate, storing about 59 percent of the heat despite accounting for less than half of all the ocean area in the world.

How can we better prepare for tropic storms or drought?
Jochem Marotzke investigates the oscillations of the atlantic currents, responsible for these extreme climatic conditions.
He can precisely predict them within a few years.

The researchers think the reason has to do with a major ocean current system known as “overturning circulation.”
This system is kind of like a giant ocean conveyor belt that runs warm water from the equator toward the poles, where it cools, sinks to the bottom of the oceans and flows back in the other direction.
The system helps transport both heat around the world, and the overturning process is pronounced in both the Atlantic and Southern ocean waters.
While the paper’s staggering new results reaffirm the importance of the ocean as a climate change buffer — without it, much of that heat would remain in the atmosphere or the earth’s land masses — it’s certainly not without consequences.
Rising ocean temperatures are believed to be a major cause of the mass coral bleaching that’s occurred all over the world over the past several years, in conjunction with an unusually strong El Niño beginning in 2015.

It’s still unclear how other organisms might be affected, but many marine animals thrive best within specific temperature ranges.
Many marine biologists believe that continued warming, along with other climate-related changes such as ocean acidification, may force certain species to migrate to cooler or deeper areas in the future.
Trenberth added that increasing heat moving into the surface of the ocean could also lead to “dead spots” in the ocean — places where layers of warm water get stuck on top of layers of cooler water.
When this stratification happens, it can become more difficult for the waters to mix and churn as they normally would, a process that helps stir up nutrients and oxygen that are vital to marine organisms.

All this is to say that climate change affects far more than just our air temperature — and the new study documents its clear progression in places thousands of meters below the surface of the sea.
The results also come at a sensitive point for ocean and climate research, just a week after The Washington Post revealed a proposal from the Trump administration that calls for significant budget cuts for the National Oceanic and Atmospheric Administration, including a 26 percent cut for its Office of Oceanic and Atmospheric Research.
It’s the primary research arm of NOAA, Trenberth pointed out, and such drastic cuts to the program could mean even basic observations programs like Argo may no longer continue.
“As a result, the information will not even be there,” Trenberth said “That would be tragic.”

Links :

Monday, March 13, 2017

From flight 370 hunt, new insight into Indian Ocean’s unknown depths

A 3-D image of the Diamantina Escarpment on the seafloor of the Indian Ocean.The search for Malaysia Airlines Flight 370 has helped create maps revealing the ocean floor’s topological complexity. 
Credit Kim Picard and Jonah Sullivan

From NYTimes by Nicholas St Fleur

On March 8, 2014, Malaysia Airlines Flight 370 vanished with 239 passengers and crew aboard as it crossed the Indian Ocean, triggering a large-scale search for its remains that lasted nearly three years.

 South West of Australia with the GeoGarage (AHS chart)

 As a byproduct of the tragedy, scientists have gained access to more than 100,000 square miles of seafloor mapped at a level of detail that provides a rare look at the ocean’s geological processes.
“It’s an incredible trove of data,” said Millard F. Coffin, a marine geophysicist from the Institute for Marine and Antarctic Studies at the University of Tasmania in Australia. 
“I’ve been working in this part of the Indian Ocean for 30-plus years and over many voyages in the eastern Indian Ocean I’ve never seen this level of resolution.”
Dr. Coffin worked with a group of about 10 scientists from Geoscience Australia, the national geosciences agency in Australia, to analyze data from the search. 
They were given access to high-resolution sonar information collected on ships, and data obtained by remotely operated vehicles and autonomous underwater drones. 
The information was provided by the Australian Transport Safety Bureau, which led the search.
“When we look at these data, we’re constantly keeping in mind that we wouldn’t have this data if it weren’t for a terrible tragedy,” Dr. Coffin said.
 He and his colleagues published a summary of their findings on Wednesday in the journal EOS.

 A 3-D model of the Broken Ridge along the Diamantina Escarpment. 
Credit Geoscience Australia 

Previous satellite data provided scientists with information about the Indian Ocean at a resolution of about five square kilometers, or about two square miles. 
With the instruments from the search ships, they have collected information at a resolution of meters, and in some locations they have used remote operating vehicles and underwater autonomous vehicles to gain detail on the scale of centimeters.
The search has helped create three-dimensional maps of the ocean floor that reveal its topological complexity and will allow researchers to further investigate unique features like the oceanic plateau called Broken Ridge, and its southern-flank Diamantina Escarpment
The Flight 370 search also provided information about tectonic and volcanic activity, Dr. Coffin said.
The team plans to release more detailed looks into its findings later in the year, and the full data set from the search will be made available in the middle of the year.
Walter H.F. Smith, a geophysicist with the National Oceanic and Atmospheric Administration, said the hunt for the lost jetliner highlighted how little we know about the oceans. 
In a paper that was also published Wednesday in the journal EOS, he and his colleagues explained how common unmapped areas of ocean are.

 Satellite-derived gravity field (gray) [Sandwell et al., 2014] and multibeam echo sounder (color) data were used to produce these maps of the MH370 search area in the southeast Indian Ocean.
The relief models are shown in Sun-illuminated (shaded relief) mode.
The inset map shows the MH370 search area that was mapped with multibeam echo sounding (shown in red).
This map highlights the Southeast Indian Ridge (SEIR) and the Kerguelen Plateau, and it includes estimated spreading rates of the SEIR [Argus et al., 2011], lines delineating regions of approximately equal age (isochrons [Muller et al., 2008]), and interpretations of SEIR segments (I–VII [Small et al., 1999]).
Other abbreviations are AAD, Australian-Antarctic Discordance; CIR, Central Indian Ridge; RTJ, Rodriguez Triple Junction; SWIR, Southwest Indian Ridge; WA, Western Australia.
The larger map shows details of the ocean depth mapping effort using multibeam echo sounder bathymetry data. Locations of Deep Sea Drilling Project (Leg 26) and Ocean Drilling Program (Legs 121 and 183) Sites 255, 752 to 755, 1141, and 1142 are also indicated, as are the locations of Figures 2, 3, and 4.
 Multibeam echo sounder bathymetry map of two regions of the ocean floor around the Geelvinck Fracture Zone in the Australian-Antarctic Basin south of Broken Ridge (see above for locations).
The fracture zone offsets the SEIR by about 310 kilometers. 
The right-lateral transform fault motion (a person standing on one side of the fault would see the opposite side displaced to the right) that created this fracture zone was mostly horizontal.
Note the fracture zone fault valleys, mid-ocean ridge spreading fabric, and isolated volcanoes.

“There are all kinds of things you can’t do if you don’t know the shape of the ocean bottom, or don’t know it properly,” Dr. Smith said. 
The consequences of not knowing, he said, can hinder how experts predict tsunamis, understand ocean currents, make climate forecasts, study marine life and search for missing planes.
Previous studies have suggested that only 8 percent of the world’s oceans have been mapped, meaning that a ship measured an area’s depth and recorded it in a scientific database. 
Before Flight 370’s disappearance, only 5 percent of the southeast Indian Ocean had been mapped, Dr. Smith said.
The differences in resolution between multibeam and satellite-derived bathymetry data for the northern flank of Broken Ridge are apparent here.
Numerous mass wasting features are evident, including slides and debris flows (delineated by their head scarps) that crosscut and run out as debris fans into the large semicircular depression

To figure out how often people fly over unmapped parts of the world’s oceans, 
Dr. Smith and his colleagues compared data on mapped and unmapped segments of the world’s ocean segments with a database of commercial airline routes
They found that about 60 percent of all commercial flights that cross over the ocean travel over waters with unmeasured depths.
The longest contiguous route over unmapped ocean was from Kennedy International Airport in New York to Chongqing Jiangbei International Airport in China, a journey over more than 1,200 nautical miles of unmapped ocean.
“I wanted people to realize that it’s not just Malaysia Airlines straying into the southeast Indian Ocean where it shouldn’t have been,” he said. 
“Even when your aircraft is exactly where it’s supposed to be, it might be over unknown ocean.”

Links :

New Zealand Linz layer update in the GeoGarage platform

5 nautical raster charts updated