Saturday, May 18, 2013

Timelapse of large calving event at Helheim Glacier, Greenland

In July 2010, researchers Timothy James and Nick Selmes were installing instruments
on the south shore of Helheim Fjord in Greenland when they heard the most unbelievable sound.
This is what unfolded before their eyes.
>>> geolocalization with the Marine GeoGarage <<<

From LiveSciences

A deafening rumble alerted two scientists to an amazing sight: the collapse of one of Greenland's biggest and fastest-moving glaciers.

And because the scientists were already in place with a time-lapse camera, they were able to capture the calving event — one of the biggest of these glacier collapses ever recorded on film.

Before the collapse, Timothy James, a researcher at Swansea University in the United Kingdom, was in southeastern Greenland in July 2010 to set up a remote camera to spy on Helheim Glacier where it meets the sea.
This meeting of glacier and ocean is called the calving front, and marks the zone where icebergs break off (or calve).

"This is an area that is very difficult to measure because [it is] so dynamic and unstable," James said in an email interview.
By using time-lapse photography, James and his colleagues hope to better understand changes at the calving front, and the factors that control how glaciers and ice sheets change over time, especially in response to climate.

"While providing important information about these events to scientists, we are hoping that our video will help people understand the scale of these calving events," James told OurAmazingPlanet.

Since 2001, Helheim Glacier has thinned by more than 130 feet (40 meters) and beat a hasty retreat, shrinking landward by more than 5 miles (8 kilometers).

Right place, right time

During the July 2010 calving event, about 0.4 cubic miles (1.5 cubic km) of ice — which would fill Central Park to a height of almost 1,000 feet (300 m), James calculated — crumbled off the glacier in 15 minutes.

"Even this, in the context of the ocean, isn't very much water, but there are thousands of glaciers like this around the world," James noted.
"This is how glaciers influence sea level.[However], it is important for people to understand that an individual calving event is not evidence of climate change. Large glaciers produce icebergs of this magnitude all the time. What's important is how the size and frequency of these events change over time and what causes them to occur," James said.

In summer 2010, James and Swansea colleague Nick Selmes had been dropped off by helicopter in Helheim Fjord to install cameras that would take digital photographs of the calving front every hour until the researchers picked up the cameras in autumn.

"After six days, we had installed two cameras that were running nicely, and we were installing the third camera when, out of nowhere, we heard this really deep rumble that was shooting down the fjord," James told OurAmazingPlanet.

Boom, then bleep

"The first thing we saw was the ice breaking off cross the fjord — we were quite excited about that," James said. "
As this progressed, my colleague, Nick Selmes, thought he could see a crack forming along the whole width of the glacier. Indeed, there was!
So I turned the camera, and we watched in awe.
It was absolutely amazing and something I will never forget.
There was so much noise we could hardly hear each other.

“This calving event was absolutely huge, and we were so excited,” he added.
“In retrospect, I'm glad we didn't have audio because there was a lot of shouting and quite a lot of swearing, if memory serves," James said.

The massive crack across Helheim Glacier was approximately 13,000 feet (4,000 m) long. And much of the giant glacier's height is hidden underwater, so about 2,600 vertical feet (800 m) of ice crashed into the water — much more than the 325 feet (100 m) visible in the film.
The falling ice created a giant wave.

"There is a huge face of ice that has to push through a lot of water," James said.
"The time-lapse gives the impression that the calving event happened quite quickly, but it was really surprising how slow it was."

Friday, May 17, 2013

U.S. Coast Guard releases 2012 Recreational Boating Statistics report

Basic Navigation & Charts - Boat Safety in NZ - Maritime New Zealand

From BoatingIndustry

Report shows lowest number of fatalities on record, overall drop in accidents and injuries

The U.S. Coast Guard released its 2012 Recreational Boating Statistics Monday, revealing that boating fatalities that year totaled 651, the lowest number of boating fatalities on record.
From 2011 to 2012, deaths in boating-related accidents decreased from 758 to 651, a 14.1 percent decrease; injuries decreased from 3,081 to 3,000, a 2.6 percent reduction; and the total reported recreational boating accidents decreased from 4,588 to 4,515, a 1.6 percent decrease.

The fatality rate for 2012 of 5.4 deaths per 100,000 registered recreational vessels reflected a 12.9 percent decrease from the previous year’s rate of 6.2 deaths per 100,000 registered recreational vessels.
Property damage totaled approximately $38 million.
“We’re very pleased that casualties are lower, and thank our partners for their hard work over the past year,” said Capt. Paul Thomas, director of Inspections and Compliance at U.S. Coast Guard Headquarters.
“We will continue to stress the importance of life jacket wear, boating education courses and sober boating.”

The report states alcohol use was the leading contributing factor in fatal boating accidents; it was listed as the leading factor in 1;7 percent of the deaths.
Operator inattention, operator inexperience, improper lookout, machinery failure and excessive speed ranked as the top five primary contributing factors in accidents.

Almost 71 percent of all fatal boating accident victims drowned, with 84 percent of those victims not reported as wearing a life jacket.
Approximately 14 percent of deaths occurred on vessels where the operator had received boating safety instruction.
The most common types of vessels involved in reported accidents were open motorboats, personal watercraft and cabin motorboats.

The Coast Guard reminds all boaters to boat responsibly while on the water: wear a life jacket, take a boating safety course, get a free vessel safety check and avoid alcohol consumption.

To view the 2012 Recreational Boating Statistics, go to :

Links :
  • NTnews : Maybe the sea life ain't for you, mate
The skipper has been summonsed for putting an unsafe vessel to sea following a search and rescue operation in Darwin Harbour yesterday.
"On Tuesday the 11m vessel was towed by the harbour Pilot boat to Fannie Bay after reporting rudder problems. During the night the catamaran has slipped anchor and again drifted into the harbour," said Senior Sergeant Paul Faustmann from the Water Police Section.
Snr Sgt Faustmann said the 60-year-old skipper contacted authorities for assistance but was unable to give Water Police any indication of his current position.
"Police were able to talk the man through steps to obtain a GPS reading from his mobile phone which indicated his approximate position as 5 nautical miles off Charles Point.
"The PV Darwin River located the catamaran but due to unfavourable conditions and the fact they would have become a hazard to shipping, it was safer to tow the vessel to sheltered waters off Mandorah where a full safety check was carried out.

"Officers found the skipper to be without a set of marine nautical charts, navigational aids and very little local knowledge of Darwin Harbour.
"The 60-year-old man and a 58-year-old female have suffered no injuries and are now safe - but the fact they set sail without charts, in an unseaworthy boat and without any real understanding of conditions certainly hampered the rescue efforts.
"This incident would not have occurred had the vessel been in a seaworthy condition and the skipper possessed the necessary equipment and knowledge.
"It is an offence to take an unseaworthy vessel to sea and an investigation into the incident is continuing."

Thursday, May 16, 2013

NZ Linz update in the Marine GeoGarage


12 charts have been updated in the Marine GeoGarage
(Linz April update published 2 May 2013 updates) 

  • NZ24 Western Approaches to South Island
  • NZ25 New Zealand, South Island
  • NZ56 Table Cape to Blackhead Point
  • NZ73 Abut Head to Milford Sound: Jackson Bay
  • NZ561 Approaches to Napier
  • NZ5214 Marsden Point
  • NZ5215 Whangarei Harbour
  • NZ5314 Mercury Islands
  • NZ5612 Napier Roads: Napier Harbour
  • NZ6153 Queen Charlotte Sound
  • NZ6154 Tory Channel Entrance and Picton Harbour
  • NZ7622 Milford Sound to Sutherland Sound
Today NZ Linz charts (178 charts / 340 including sub-charts) are displayed in the Marine GeoGarage.

Note :  LINZ produces official nautical charts to aid safe navigation in New Zealand waters and certain areas of Antarctica and the South-West Pacific.


Using charts safely involves keeping them up-to-date using Notices to Mariners

Open Data policy : the best thing Obama’s done this month

Alpha.data.gov, an experimental data portal
created under the White House's Open Data Initiative.

From Slate

His executive order to open government data is a really big deal.

Long before steam engines and turbines carried us swiftly over the oceans, a disabled sailor who could no longer serve on a ship found something to do ashore: aggregate the data from shipping logs.

When Matthew Fontaine Maury (see GeoGarage blog) started analyzing those logs and mapping them onto charts, he found previously invisible patterns in the data that showed patterns in weather, winds, and currents.

In 1855, Maury published this knowledge in a book,
The Physical Geography of the Sea.
(see NOAA)

He also made a crucial decision for navigators around the world:
After he collected the data, Maury then shipped them to anyone who wanted them, and he asked for contributions in return.
Over time, it became a worldwide project.
Maury saw great value in publishing the data “in such a manner that each may have before him, at a glance, the experience of all.”
Notably, President John Quincy Adams agreed.
Not long afterward, the United States created standards for reporting meteorological data and endowed the U.S. Naval Observatory.

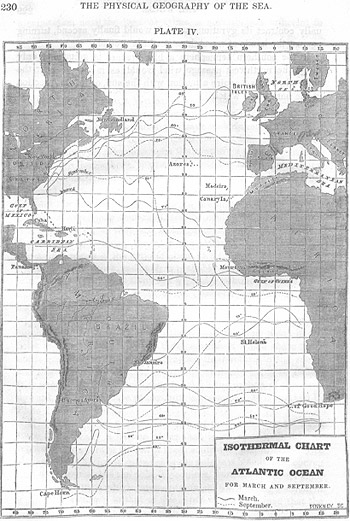
The equal lines of ocean temperature on this chart (sinuous east-west lines) in Physical Geography of the Sea were generated "by actual observations made indiscriminately all over it" (p. 231).
Maury asserted that such information helped to "increase our knowledge concerning the Gulf Stream, for it enables us to mark out,…the 'Milky Way' in the ocean, the waters of which teem, and sparkle, and glow with life and incipient organisms as they run across the Atlantic." (p. 231)

In many ways, Maury's work and the government's codification and release of these data set the stage for the historic moment we find ourselves in.
Around the world, people are still using government weather data when they travel, though few consult nautical charts.
Instead, they tap into the growing number of devices and services that make open data more actionable.

For instance, think about how you use the mapping apps on an iPhone or Android device.
That glowing blue dot places you in time and space, enabling you to know not only where you are but how to get somewhere else.
In more than 450 cities around the world, when you look for mass transit options, the routes and even departure times for the next train or bus show up on that interactive map as well.

GPS constellation :
The first true “Open Data Directive” was a mandate for “Free and Open GPS Signals”.
This was created and championed by President Ronald Reagan in 1983.
The directive from President Reagan was a response to the terrible tragedy of a Korean Airlines flight that sadly strayed into Russian airspace and was shot down.
President Reagan’s altruistic directive, which opened the military’s GPS to the world, provided an amazing opportunity to the private sector that is experiencing its second act 30 years later in the Government 2.0 ecosystem of open data.
The decision to open up GPS provided the ability to create sophisticated navigation systems to prevent future disasters.
The unforeseen consequence of President Reagan’s move was the creation a $250 billion a year navigation industry (including GPS enabled smartphones), millions of jobs, and inspiration to spur the next generation of innovation and economic prosperity in the US.
- source : Techwire -

That glowing blue dot exists because of a series of executive decisions made by Presidents Ronald Reagan and Bill Clinton, who decided to progressively open up the data created by the satellites in the Global Positioning System to civilian use, enabling a huge number of location-based technologies to make their way into the palms of citizens around the world.

Now, we may see even more life-changing technologies as a result of open government data.
Last week, the White House released an executive order that makes “open and machine readable” the new default for the release of government information.
Although people who care about open data were generally quite excited, the news barely made an impression on the general public.
But it should: This is perhaps the biggest step forward to date in making government data—that information your tax dollars pay for—accessible for citizens, entrepreneurs, politicians, and others.

Online free NOAA nautical charts and publications open data/open access.
(since November 15th, 2005)
Before the Obama executive order, the openness of this kind of data has been threatened
by the U.S. House of Representatives, 
as they explore privatization of NOAA services.

President Barack Obama announced the order on a trip to Austin, Texas, where he met the founder of StormPulse, a startup that uses weather data for risk analysis.
The White House also published a memorandum that established a framework to institutionalize the treatment of government information as an asset.
"This kind of innovation and ingenuity has the potential to transform the way we do almost everything," said Obama.

 MATCH incorporates metadata from six federal agencies’ datasets.

This isn't the first time the nation has heard this kind of rhetoric or initiative, although it was by far the most prominent mention by the president to date.
In 2009, the federal government launched Data.gov as a platform for open data for civic services and economic reuse.
In the years since, dozens of other national and state governments have launched their own open data platforms.
From health information to consumer finance, government data are slowly making their way out of file cabinets and mainframes into forms through which they can be put to good use.
Many of these data are of fundamental interest to citizens, from the quality of the food we eat to the efficiency of our appliances to the safety of the cars we drive.
During Hurricane Sandy, open government data feeds became critical infrastructure, feeding into crisis centers and media maps that amplify them to millions of citizens searching for accurate, actionable information.

While all those efforts laid a foundation, the new executive order is at once more legally binding and specific.
It sends a clear statement from the top that open and machine-readable should be the default for government information.

The White House has also, critically, taken steps to operationalize these open data principles by:
  • Mandating that when an agency procures a new computer or system that collects data, those data must be exportable. That won't address digitizing existing government documents and data but will create a default setting going forward.
  • Planning to relaunch data.gov in a format compatible with dozens of other open-data platforms around the world.
  • Requiring agencies to catalog what data they have. Understanding what you have is fundamental to managing information as an asset, although an open data policy that requires creating and maintaining an enterprise data inventory won't be without cost. Creating a public list of agency data assets based upon audits is one of the most important aspects of the new open data policy.
With this executive order, the president and his advisers have focused on using open data for entrepreneurship, innovation, and scientific discovery.
This executive order, associated tools, and policy won't in and of themselves be enough to achieve the administration's goals, at least with respect to jobs: They'll need entrepreneurs, developers, and venture capitalists to put the open data to use.
Governments looking for economic return on investment must focus on open data with business value, according to research from Deloitte U.K.

Government release of health, energy, education, transit, and safety data all hold significant economic potential.
As is the case with GPS and weather data, however, government will have to ensure that data remains available to businesses founded upon it.

But advocates of open data also point to another area with great potential: transparency.
With Data.gov, the Obama administration had promised to make information available so citizens could keep an eye on things.
But some experts in this space are worried that with the emphasis on innovation and economic growth, the transparency element will be forgotten.
The nation's media relies upon Freedom of Information requests and confidential sources, not Data.gov.
Jim Harper, director of information studies at the Cato Institute, praised President Obama’s new open data policy but questioned its relationship to government transparency.
He writes:
“Government transparency is not produced by making interesting data sets available. It’s produced by publishing data about the government’s deliberations, management, and results. Today’s releases make few, if any, nods to that priority. They don’t go to the heart of transparency, but threaten to draw attention away from the fact that basic data about our government, including things as fundamental as the organization of the executive branch of government, are not available as open data.”

These are important questions that the Obama administration must address in the months ahead, although it is, admittedly, a little busy this week.
Still, the order has the potential to revolutionize industries, giving people better tools to navigate the world.
While the impact of open government data on democracy depends on functional institutions, the rule of law, political agency, and press freedom, its impact on the economy could measure in the hundreds of billions over time.

"This memorandum is the most significant advance in information policies by the federal government since the passage of the Freedom of Information Act,” said open government advocate Carl Malamud, president of PublicResource.Org.
Government data is a new kind of natural resource that can now be tapped and applied to the public good.

Links :
  • NOAA NCDC open access to physical Climate Data policy (2009)
  • NOAA : Technology & Data : NOAA and Partners Deliver New Climate and Health Data Tool to Public
  • NOAA : Assessing the economic & social benefits of NOAA data
  • Slashdot : President Obama: U.S. Government will make data more open
  • Climate Central : NOAA Head: Weather forecasts at risk over budget cuts
  • NOAA : Statement from Dr. Kathryn Sullivan on NOAA’s FY 2014 Budget Request


Wednesday, May 15, 2013

Was Darwin wrong about coral atolls?

A satellite image of Maupiti, one of the Society Islands, which is on its way to becoming an atoll. Submerged reef appears in pale blue.
>>> geolocalization with the Marine GeoGarage <<<
CREDIT: NASA Earth Observatory


From LiveScience

Charles Darwin sparked more than one controversy over the natural progression of life.
One such case involved the evolution of coral atolls, the ring-shaped coral reefs that surround submerged tropical islands.

Coral reefs are actually huge colonies of tiny animals that need sunlight to grow.
After seeing a reef encircling Moorea, near Tahiti, Darwin came up with his theory that coral atolls grow as reefs stretch toward sunlight while ocean islands slowly sink beneath the sea surface. (Cooling ocean crust, combined with the weight of massive islands, causes the islands to sink.)

A century-long controversy ensued after Darwin published his theory in 1842, because some scientists thought the atolls were simply a thin veneer of coral, not many thousands of feet thick as Darwin proposed.
Deep drilling on reefs finally confirmed Darwin's model in 1953.

But reef-building is more complex than Darwin thought, according to a new study published May 9 in the journal Geology.
Although subsidence does play a role, a computer model found seesawing sea levels, which rise and fall with glacial cycles, are the primary driving force behind the striking patterns seen at islands today.
"Darwin actually got it mostly right, which is pretty amazing," said Taylor Perron, the study’s co-author and a geologist at MIT. However, there’s one part Darwin missed. "He didn't know about these glacially induced sea-level cycles," Perron told OurAmazingPlanet.

What happens when sea-level shifts get thrown into the mix?
Consider Hawaii as an example.
Coral grows slowly there, because the ocean is colder than in the tropics.
When sea level is at its lowest, the Big Island builds up a nice little reef terrace, like a fringe of hair on a balding pate.
But the volcano — one of the tallest mountains in the world, if measured from the seafloor — is also quickly sinking.
Add the speedy sea-level rise when glaciers melt, and Hawaii's corals just can't keep up.
The reefs drown each time sea level rises.

The computer model accounts for the wide array of coral reefs seen at islands around the world — a variety Darwin's model can't explain, the researchers said.
"You can explain a lot of the variety you see just by combining these various processes — the sinking of islands, the growth of reefs, and the last few million years of sea level going up and down rather dramatically," Perron told OurAmazingPlanet.
For nearly 4 million years, Earth has cycled through global chills, when big glaciers suck up water from the oceans, and swings to sweltering temperatures that melt the ice, quickly raising sea level.
This cyclic growth of ice sheets takes about 100,000 years.
The researchers also found that one of the few places in the world where sinking islands and sea-level rise create perfect atolls is the Society Islands, where Darwin made his historic observations.

Tuesday, May 14, 2013

Wake island : an isolated NOAA chart

81664 Wake Island, NOAA chart lost in the Pacific

Quite strange to find some isolated NOAA chart showing uninhabited Wake island (possession of the USA, claimed by Marshall Islands), a coral atoll in the north Pacific Ocean.

Located approximately 2,138 nautical miles west of Honolulu, Hawaii, Wake Atoll is the northernmost atoll in the Marshall Islands geological ridge and perhaps the oldest and northernmost living atoll in the world. 
The refuge includes 495,515 acres of submerged lands and waters surrounding Wake Atoll out to 12 nautical miles from the mean low water line of the islands.
- picture from CIA -

The US annexed Wake Island in 1899 for a cable station.
An important air and naval base was constructed in 1940-41.
In December 1941, the island was captured by the Japanese and held until the end of World War II.
In subsequent years, Wake was developed as a stopover and refueling site for military and commercial aircraft transiting the Pacific.

>>> geolocalization with the Marine GeoGarage <<<

Since 1974, the island's airstrip has been used by the US military, as well as for emergency landings. Operations on the island were suspended and all personnel evacuated in 2006 with the approach of super typhoon IOKE (category 5), but resultant damage was comparatively minor.

The atoll and surrounding waters out to 50 nautical miles from shore are part of the Pacific Remote Islands Marine National Monument, established by Presidential Proclamation 8336 on January 6, 2009.
photo : US Air Force

A US Air Force repair team restored full capability to the airfield and facilities, and the island remains a vital strategic link in the Pacific region.
Despite its small land and reef areas, the atoll provides important seabird and migratory shorebird habitat, as well as vibrant coral reefs that support large populations of fishes.
The atoll was designated a National Historic Landmark in 1985 in recognition of its role in World War II.

Links :


New U.S. yachting industry economic impact report

 Image from NMMA’s U.S. yachting economic impact report
The full report is available to be downloaded as a pdf online.

 From BoatInternational

The National Marine Manufacturers Association (NMMA) has released an updated U.S. recreational boating industry economic impact report.
Notably :
  • the recreational boating industry has an impact of $121.5 billion in the U.S. annually;
  • there are nearly 35,000 recreational boating-related businesses across the U.S. employing more than 338,000;
  • and Americans spend $51 billion annually related to the 12 million registered recreational boats.
The NMMA contracted with the Recreational Marine Research Center at Michigan State University to update the 2008 Economic Value of Recreational Boating at the State and Congressional Level. The new report has been reformatted and is presented in user-friendly infographics, detailing the overall U.S. economy and then broken down by state.
The data was presented during the American Boating Congress taking place May 8-9 in Washington, D.C.

Monday, May 13, 2013

A silver (actually Cesium) lining: traces of Fukushima disaster fallout help scientists track tuna


From Scientific American

Radioactive cesium from Japan's Fukushima nuclear disaster shows up in bluefin tuna off the California coast, offering researchers a way to follow the fish's migratory history

Bluefin tuna were struggling before Japan’s Fukushima Daiichi nuclear power plant flooded their spawning grounds with radiation.
The fish’s popularity on the sushi platter has plunged population numbers.
Now traces of radiation from the nuclear disaster are showing up in the muscles of bluefins off the California coast.


Across the vast Pacific, the mighty bluefin tuna carried radioactive contamination that leaked from Japan's crippled nuclear plant to the shores of the United States 6,000 miles away.

This radiation, however, might be a good thing.
The levels are low enough that they won’t harm fish or restaurant-goers.
In fact, the traces of radioactive isotopes are helping scientists track the torpedo-shaped fish, and could aid conservation efforts.

Bluefin tuna are not classified as endangered but their numbers have been hard to measure.
The Pacific bluefin tuna's population may be down by 96.4 percent from preindustrial fishing levels, according to the most recent stock assessment, reported in December 2012 (pdf).
Researchers know the tuna are in trouble, but they still need to figure out where the tuna spend most of their time and what triggers their transoceanic migrations.

Stanford University graduate student Dan Madigan is one of the scientists trying to track bluefin.
Researchers do not know exactly what proportion of the bluefin population is cruising either side of the Pacific at any given time.

 Bluefin Tuna Migration Route between Japan and California, March and August 2011

Pacific bluefin tuna spawn in waters surrounding Japan.
Scientists think that the tuna spend the first year of their lives foraging there before either staying in the western Pacific or migrating to California's coast.
Once they migrate to California, they may stay for several years to fatten up, he says.
The western shores of several continents often have strong prevailing westerly winds that push surface waters away, allowing cold, nutrient-rich waters to flow up from the deep canyons that snake close to shore.
This coastal upwelling system makes the California coast an ideal feeding ground for many marine species, including bluefin.

Understanding why the tuna choose to migrate, at what size, and whether they return to the western Pacific could help researchers model the population and inform fishing strategies.
"It's all about figuring out how each side contributes to the other side and hopefully implementing that into a management model," Madigan says.


Fukushima two years later

As the Fukushima disaster unfolded, Madigan wondered if radiation would show up in the tuna he studied in California.
Sure enough, he and his colleagues found radioactive isotopes from the disaster in 15 bluefins caught by fisherman five months after the tsunami.
Radioactive materials from the damaged reactors bled into groundwater and the ocean.
Young tuna absorbed cesium 134 and cesium 137 isotopes while swimming in the accident-afflicted area and likely by eating contaminated plankton and small fish.

Madigan and his colleagues found the cesium, but they next needed to see if the levels could tell them anything about the fish’s movements.
To test the radioactive tracer idea, Madigan took samples of tissue from 50 fish caught in the waters near San Diego during the summer of last year.
He shipped the samples to Stony Brook University, S.U.N.Y., where a colleague analyzed them for cesium levels.

The two cesium isotopes decay at different rates.
Cesium 137 has a half-life of 30.1 years, cesium 134, 2.1 years.
The entire Pacific Ocean basin still holds slightly elevated levels of cesium 137 from the nuclear weapons testing that peaked in the 1960s, but the Fukushima power plant is the only source of cesium 134.
Elevated levels of cesium 134 therefore would indicate if the California-caught tuna are recent migrants from Japan.
By comparing the ratio of the two isotopes, Madigan and his colleagues were able tell approximately how recently the migrants had arrived.
With its shorter half-life, cesium 134 levels fall faster than those of cesium 137.
A higher ratio of 134 to 137 therefore indicates a more recent immigrant.

The work Madigan and his colleagues did prove that the cesium isotopes work as a tracer.
So far the technique confirms what scientists know about bluefin tuna: They found that all fish younger than 1.6 years old were migrants.
Only five of the 22 fish older than 1.7 years were migrants.
The larger fish had left Japan earlier in the year, but the smaller fish hung around their birthplace until early- or mid-June.

The transpacific journey took an average of approximately two months for the fish Madigan sampled. One bluefin may have managed to make the trip in just 30 days—a figure that jibes with the known daily swimming speed of approximately 172.3 kilometers per day.
The team reported their results in the March issue of Environmental Science & Technology.

Using Fukushima-derived radiocesium is a novel way of tracking the movements of oceangoing animals, wrote Texas A&M University at Galveston marine biologist Jay Rooker in an e-mail.
The approach "shows promise for tracking the movement of other highly migratory species in the Pacific Ocean—whales, turtles and sharks," he added.
Because the mixing of populations and transoceanic migrations can affect scientists' ability to estimate population size and fishing mortality, these kinds of studies are vital to informing management strategies Rooker wrote.

The short half-life of the cesium 134 means that soon the levels will be too low to be useful, but Madigan explains that there are other chemical techniques that researchers use to track migrating marine animals.
The cesium isotopes provide unequivocal evidence that the tuna came from the waters near Japan.
By matching the isotope signature with other methods—such as stable isotopes of carbon and nitrogen, which vary from region to region—researchers can use the longer-lasting isotopes as a proxy for the same information.
"One method is finite and one is infinite," Madigan says. "Once you've hammered down the relationship you can just use the infinite one in the future."

The next steps for Madigan and the team are to look at other species.
Those ocean-dwelling animals include albacore tuna, blue sharks, Pacific loggerhead sea turtles, salmon sharks, common minke whales and even birds such as sooty shearwaters.
If any of those animals carry cesium isotopes from Fukushima, they can be classified as Japanese migrants.
The fallout from the disaster could unlock secrets of ocean life.

Links :
  • WHOI : Communication in the Fukushima Crisis, How did officials, scientists, and the media perform? 

Sunday, May 12, 2013

Google visualizes massive changes to the face of the Earth with new timelapse project


http://world.time.com/timelapse/
Google has released some stunning time-lapse images of our changing planet,
highlighting some of the most startling impacts made by humans.

From Techcruch

A lot can change in 28 years, and Google has put together a very graphic demonstration of just how much can happen geographically with a new effort that combines global, annual Landsat satellite image composites with its Google Earth Engine software.

The result is a series of interactive time lapse images that progress year-by-year, showing exactly how things have changed in key areas like the Brazilian Amazon Rain Forest, booming metropolitan areas like Las Vegas and Dubai, and the progress of large bodies of water like the Aral Sea.

The story behind the Google and NASA partnership
that reveals How Earth is radically changing over the decades.

It’s stunning to watch the Amazon rainforest virtually disappear, or see the building creep across the desert in Vegas, or watch the Columbia Glacier vanish entirely. Google worked with the U.S. Geological Survey, NASA and TIME magazine to build the Timelapse project, and went to Carnegie Mello University’s CREATE Lab to build the final HTML5 site that makes the animations interactive and browsable.


Google has also rendered the transformations as animated GIF files, which I feel might inspire a Tumblr somewhere.
“This dramatic geographical change is similar to how I feel when my boss yells at me,” etc.
For example, my blogger brain before and after massive amounts of caffeine: