François Gabart embarks James Spithill on board the MACIF trimaran for a 48-hour high intensity navigation Ready to take off? Exceptional immersion for a trip with two great champions. Sensations guaranteed.
Theater of the World offers a fascinating history of mapmaking, using the visual representation of the world through time to tell a new story about world history and the men who made it. Thomas Reinertsen Berg takes us all the way from the mysterious symbols of the Stone Age to Google Earth, exploring how the ability to envision what the world looked like developed hand in hand with worldwide exploration. Along the way, we meet visionary geographers and heroic explorers along with other unknown heroes of the map-making world, both ancient and modern.
And the stunning visual material allows us to witness the extraordinary breadth of this history with our own eye
A globe placing Japan in the area of Mexico prompted Columbus to cross the Atlantic, according to Thomas Reinertsen Berg’s fascinating Theatre of the World
Reflecting on the genesis of Treasure Island, the adventure yarn that grew from a map of an exotic isle he had drawn to amuse a bored schoolboy on a rainy day, Robert Louis Stevenson observed: ‘I am told there are people who do not care for maps, and I find that hard to believe.’ It’s fair to say that Thomas Reinertsen Berg cares very deeply about them, and his book, sumptuously produced with lots of full-colour images, is a kind of potted treasury of cartographical history that gleams with pieces-of-eight-like snippets of information.
Ortelius World Map ("Typvs Orbis Terrarvm"), 1570. Source: Library of Congress.
With a title that tips its hat to Theatrum Orbis Terrarum, the first modern atlas produced by the Flemish cartographer Abraham Ortelius in 1570, Thomas Reinertsen Berg’s approach is both impressively global and touchingly parochial, as his native Norway and Scandinavia in general often and unashamedly take centre stage in the narrative.
(A note in the foreword explains that the book has to a certain extent been de-Norwegianised for the English edition.)
But it is, in a sense, a work of thoughtfulness that could only really come from someone who hails from a part of the world that was either off the global map entirely or the victim of some decidedly wayward speculations by cartographers.
He notes, for instance, that if the Hereford Mappa Mundi, created in about 1300, contains possibly the first convincing representation of a ski trail, certain areas at the northern extremities are still shown to be inhabited by ‘people with dog heads’.
Norway, you come to appreciate, has in any case been a tricky country to map.
For a start, there’s its basic geography, the coastline and all those mountains, rivers and fjords.
And then it was a Danish colony for more than 400 years and after that spent close to a century shackled to Sweden.
In more recent times, the discovery in the 1960s of (potentially) oil- and gas-rich deposits of sedimentary rock off its coast caused its government to extend the country’s sovereign boundaries out into the ocean, claiming precious seabed and subsoil in the process.
It perhaps says as much about the particular importance accorded maps by Norway that the first survey in a scheme to chart the nation’s economic activity geographically, initiated in 1964, was only completed in 2002.
Maps, though, as the author illustrates, are always as much about the people and the societies that produce them as the terrains they depict.
This also makes determining whether or not some of the earliest examples we have are actually maps such a thorny issue.
He cites the ongoing disputes over the 9,500-year-old cave painting excavated at Çatalhöyük in Turkey in 1967 and described in some quarters as ‘the oldest town plan in existence’.
Too little is known about the prehistoric culture that produced it to definitely say if it’s a map or merely a nice painting of the local scenery to brighten up a dull cave wall.
Like language in Wittgenstein’s view, use is largely the determining factor with maps; and necessity, inevitably, the mother of their invention.
Whether to help assign property rights in Ancient Sumeria and Babylon, or to work out compensation payments for flood damage by the Nile in Egypt, or looking to invade Persia if you are the Spartans, or running much of the world if you are the Roman Empire, or hoping to maintain Christ’s rule on earth as the established church in the Middle Ages, some sort of map is necessary, as Reinertsen Berg diligently outlines.
He also proffers some choice examples of how those with better maps triumphed over those with poorer ones.
In the 15th century, secretive Spanish and Portuguese imperial navigators, hoarding information about their maritime routes like Incan gold, clung on to their hand-drawn nautical charts.
They were duly to be out manoeuvred by the free-booting Dutch, who sailed with the latest and most up-to-date maps, usually internationally crowd-sourced, and expertly printed in Antwerp.
Still, cartographical mistakes have also helped expand our horizons; it’s likely that Columbus may never have set off to the New World if he had not plotted his voyage using a globe by the German mariner Martin Behaim.
Cartographer in Nuremberg, Martin Behaim shares with Christopher Columbus the same conviction that there is an ocean route to Asia.
Between 1484 and 1490, he stayed in Lisbon and sailed for the King of Portugal.
The same year that Columbus set out towards the New World, Behaim composed this globe, which is the oldest surviving western sphere.
All the nomenclature comes from Marco Polo, to whom Columbus will also place exaggerated trust.
With its inaccuracies, this globe reflects the certainties and hopes of Portuguese maritime circles.
Created in 1492 on principles derived from Ptolemy’s only recently rediscovered Geography, Behaim’s globe is the oldest surviving example in Europe; it is also flawed, as he underestimated the size of the earth and ‘placed Japan around where Mexico is located’.
Globus Martini Behaim Narinbergensis 1492. (Globe of Martin Behaim)
Text Appearing Before Image: er of the Admiral to the (quondam) nurse of the Prince John, in the Select Lettersof Christopher Columbus, translated by R. H. Major, for the Hakluyt Society, p. 148. ^ Letter of Columbus to Ferdinand and Isabella, in the Profecias. See HumboldtsExamen Critique, Tome I., p. 15. THEORIES OF OTHER GEOGRAPHERS. 103 the logic of the sphere. It was because the world was round, becauseone third of it yet remained to sail across, and because it was possibleto sail across it, that God had given him that mission. On the ever-lasting truths of science must rest the possibility of human achieve-ment. God would not appoint to him the task of bringing the ends ofthe earth together if it could not be done. The theory of the sphericalform of the earth was not new, for that was taught five hundred yearsbefore the Christian era. But the ancient geographers supposed thatthe ocean of the western hemisphere was of such expanse as to bepractically if not absolutely impassable. It was on this all-important Text Appearing After Image: Globus Martini Behaim Narinbergensis 1492. Globe of Martin Behaim. point, the size of the globe, that the learned men of modern timesassumed that they had received new light. The globe was muchsmaller than the ancients supposed ; the ocean west of Europe coveredonly one third of it, and then came Asia. Columbus was not a manof wide learning, but he had diligently informed himself of all thathad been advanced on these points by both ancient and modernwriters, and he knew that the geographers of the highest reputation ofhis own time maintained the theory, on which he relied, not only ofthe shape but of the size of the earth. From these he sought argument and encouragement. He can hardly 104 INDIA—THE EL DORADO OF COLUMBUS. (Chap. Y. have failed to know Martin B eh aim, in the service of the King ofiPortugal while Columbus was in vain attendance upon that court,B h -m nd ^^^^ ^^^ showed upou his famous globe, completed in 1492,Toscaneiii. n^^^ \^q ii^d no doubt of the proximity of Asia
But this error encouraged Columbus to believe that Asia could ‘easily be reached by ship from Europe’.
Facsimile of Behaim Globe (1492–1493) author : Ravenstein
Equally, innovations in mapping were frequently resisted; Mercator’s famous projections and his Atlas, we learn, were, if more accurate, initially flops as they were too austerely drawn for their times.
An earlier series he published on the Balkans, Greece and Italy featured just ‘one monster and two ships across a total of 21 maps.’
It was only posthumously that sales rose, after Hondius the Elder larded Mercutor’s Atlas with ‘extravagant, baroque illustrations of people in national costume’ and ‘more ships’.
The earliest surviving marine chart of the New World: the La Cosa chart (circa 1500)
Inevitably in a book that moves briskly from prehistoric stone carvings to Google Earth, there are omissions.
Curiously there is nothing here on transport maps or the humble A-Z, but then that might say more about my own geographical biases.
The theatricality in the title also extends to rendering scenes from the map-makers’ lives quasi-novelistically in the present tense (‘With her brush, Anne Ortel carefully applies light-green paint to an area of woodland’).
But, all in all, this is an enthralling book, and joins the likes of Simon Garfield’s On the Map and Jerry Brotton’s A History of the World in Twelve Maps in the field of popular reaffirmations of the ingenuity of geography.
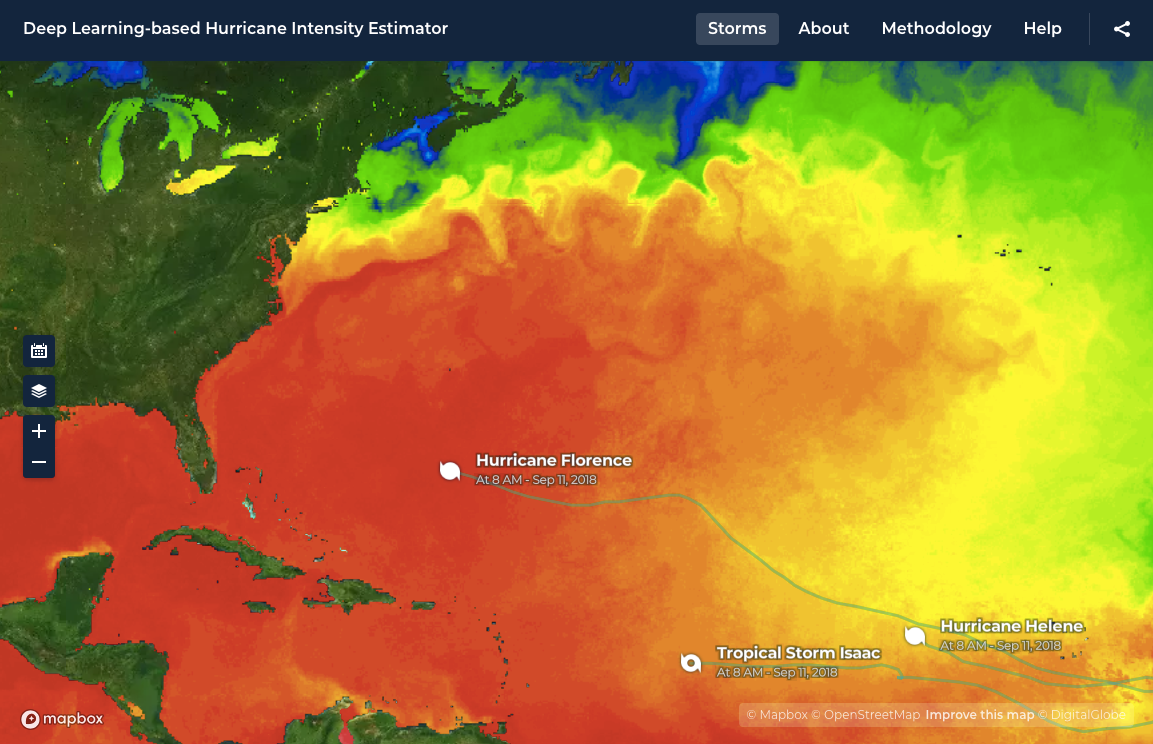
NASA and Development Seed are tracking Hurricane Florence using machine learning techniques, producing results six times faster than current capabilities.
Their neural network-based approach calculates hurricane strength and wind speed by monitoring live imagery as it’s delivered from weather satellites.
This allows NASA to create estimates hourly, a significant speedup from the usual six-hour cycle.
The primary factor for estimating a hurricane’s destructive potential is wind speed.
By creating faster, more reliable estimates of storm wind speeds, authorities may be able to make better decisions about moving people out of harm’s way and moving resources where they’re needed.
These decisions can help save both life and property.
The issue is growing in urgency: the 2017 hurricane season was the most destructive on record, claiming thousands of lives and causing an estimated $280 billion in damage.
Estimates of cyclone intensity rely upon the Dvorak technique, which matches satellite imagery of a storm to known patterns.
Once matched, it’s possible to estimate wind speed.
AI experts at NASA’s Marshall Spaceflight Center and Development Seed trained neural networks using historical hurricane imagery and classifications, allowing this workflow to be fully automated.
The view of the Atlantic on Sept. 12. Florence on the right, bearing close to the US coast, Tropical Storm Isaac near the Lesser Antilles, and Hurricane Helene off the coast of Africa. image : NOAA
This allows data to flow directly from the GOES-16 weather satellite, to the NASA Cumulus framework running on AWS, to seamlessly generated predictions.
Although it’s currently running at six times the frequency of traditional prediction mechanisms, the system is theoretically constrained only by the bandwidth of its satellite source.
Available now : The Hurricane Intensity Estimator,
built with Mapbox, is running alongside data collected from human
estimation and aerial flights.
NASA plans to continue to improve the
prediction models.
Hurricane Florence’s location via the Google Crisis Map hurricane tracker
1960 U.S. Weather Bureau Hurricane Tracking Chart courtsey of Geographicus
An estimated three million shipwrecks lie in seabed graveyards around the world – with as many as 1000 of them around Svalbard.
Each of them has their own unique story — one that’s made much more accessible with new technology.
Throughout the centuries ships have weathered wars, storms, icebergs, and pirates, to name a few.
Many ships have been lost in the face of these forces and gone down with all hands.
They lie on the bottom of the ocean with their stories and secrets.
Many of them have been there for a long time, inaccessible in the depths to anyone but fish and other creatures.
“The world’s oceans are like a big museum,” says Øyvind Ødegård, a marine archaeologist at NTNU who recently defended his dissertation entitled “Towards Autonomous Operations and Systems in Marine Archaeology.”
“The technological advances that have taken place over the last few years are fantastic.
A human diver can only work down to about 30 metres, and the vast majority of shipwrecks are much deeper than that.
Underwater robotics, sensors, robots and control systems are now making it possible to obtain completely new insights into what’s on the seabed,” he says.
Smeerenburg fjord with the GeoGarage platform (NHS nautical chart)
On the hunt for the Holy Grail
A particularly enticing ship graveyard lies between Svalbard and Greenland, where there are about 1000 wrecks.
Seventeen of them are located in the Smeerenburg fjord.
Ødeård is particularly interested in these ships.
“Somewhere down there on the bottom of the ocean are seventeen shipwrecks, all in about the same area.
That’s the grail I’m hunting for,” he says.
How they all ended up there is a story unto itself.
Long before people relied on fossil fuels for heat and light, whales were a highly sought-after commodity because of their fat.
The northern waters of the Arctic were rich with whales, particularly in the seas around Svalbard, Jan Mayen, Iceland and Greenland.
This drew ships and people from many nations, in spite of the sometimes harsh conditions in these faraway waters.
Early in the 1600s, shipping nations like the Netherlands, France, Spain and England began whaling along the coast and in the fjords of Svalbard.
The Netherlands led the charge and established the first whaling station north of Svalbard, called Smeerenburg.
It was nicknamed “Fettbyen” or “Spekkbyen” – Fat town – as whale oil production took off.
Painting by Abraham Storck – Stichting Rijksmuseum het Zuiderzeemuseum.
The Sun King sank ships
These whaling ships plied the oceans for decades, supplying Europe with lamp oil, raw materials for soap, and boning for corsets and umbrellas, for which the baleen from the bowhead whales that were found in these waters was well suited.
But the intensive hunt managed to almost exterminate whales in the fjords and along the coast in just a few decades.
And so the ships had to venture farther north, towards the ice’s edge and into more inhospitable waters, which inevitably led to shipwrecks.
During one winter, thirteen Dutch ships became stuck in drift ice in Sorgfjorden.
The crew had to abandon their ships and leave the full load on board.
The crew survived by travelling to Smeerenburg on foot and in small vessels, but their ships disappeared into the frigid depths.
It wasn’t only difficult waters that caused shipwrecks, however.
The highly prized whale oil and the opportunity to conquer new lands created major conflicts, not least between the Netherlands and France.
Sorgfjorden with the GeoGarage platform (NHS nautical chart)
Louis XIV, the Sun King, was eager to damage the Netherlands’ economy and the country’s ability to wage war, and so sent his own warships north to Svalbard.
Two French frigates and 40 Dutch whaling ships battled in 1693 in Sorgfjorden, which led to two ships sinking on the spot.
Another seventeen Dutch ships were taken back to the Smeerenburg fjord and sunk there.
These are the ships that Ødegård would love to learn more about.
World’s northernmost shipwreck
“We have reason to believe that there are many wrecks in the Arctic that are especially well preserved because of the cold water,” says Ødegård.
The autonomous underwater vehicle Hugin on its way to the deep. Photo: Geir Johnsen, NTNU
Two years ago, he was on an expedition in the region with biologists, technologists and polar scientists.
The goal was to study life in the sea during the polar night – and they investigated a shipwreck in Isfjorden that is the world’s northernmost mapped shipwreck to date.
Much to their surprise, the researchers also found a clam that usually does not live that far north and in such cold water.
This discovery doesn’t bode well for shipwrecks and adds urgency to the need to locate and map them.
Ultimately, the goal is to organize a more extensive research expedition to the area of the seventeen ships.
Enormous underwater technology advances
Accomplishing this will require the technological innovations that Ødegård and his colleagues have been testing.
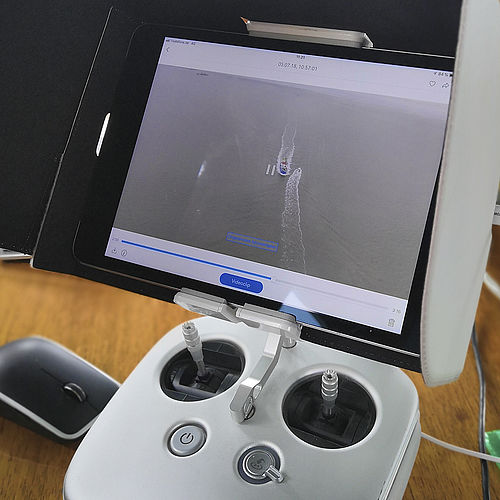
Researchers can now use underwater robotics and joysticks to control underwater operations with great precision.
The control systems are advanced and smart, and artificial intelligence (AI) and powerful computers enable robots to evaluate many situations independent of human help.
“We’ve seen huge developments in underwater robotics and relevant sensor technology over the last few years.
In my PhD thesis, I looked at how selected platforms and sensors can be used to develop new methods for marine archaeology research with a high degree of autonomy, and I suggest a model for how such decisions can be made without needing a human being in the loop,” Ødegård said.
3D model of a wreck at Munkholmen in Trondheim harbour based on
photogrammetry.
Draped with photo mosaic (top) and colour-coded point
cloud (bottom).
Smart sensor technology
Three sensor technologies are essential for mapping shipwrecks at great depths and with great precision.
“Synthetic aperture sonar (SAS) technology, which is a high-resolution acoustic sensordeveloped by the Norwegian Defence Research Establishment and Kongsberg Maritime, has collected data that represents a quantum leap in quality and accuracy, compared to traditional methods,” says Ødegård.
This acoustic sensor produces high-resolution images.
Detailed bottom maps can thus provide important information without the need for inspection dives with a video camera to confirm or eliminate possible wreck finds.
Another tool that the researchers have used is an underwater hyperspectral imager (UHI).
This is an optical sensor that takes photographs using the entire visible light spectrum.
Common cameras use only three wavelengths (RGB), whereas an UHI can use up to 800.
Finally, a stereo camera on a ROV (remote controlled underwater robot) is used to create high-resolution 3D models of selected wrecks using photogrammetry.
The camera provides resolutions down to the millimetre level.
The stereo camera is “excellent for documenting and monitoring wrecks, where even small details can be very important,” Ødegård says.
These three sensors, plus others, should be able to be housed on a single underwater vessel, which collects and analyses data on its own.
Based on the analyses, the ROV determines whether it will take the time to investigate and possibly document what is most likely a wreck, or whether it will go on to map new areas.
Pictures 1 and 2 show wrecks depicted with standard side-searching sonar.
Picture 3 shows the same wreck depicted with Synthetic Aperture Sonar (SAS).
Picture: Norwegian Defence Research Establishment
Archaeologists, engineers and biologists in the same boat
Øyvind Ødegård has 20 years of experience as a marine archaeologist and works at the NTNU University Museum.
While he worked on his doctorate, he maintained a 75 per cent affiliation with AMOS, NTNU’s Centre for Autonomous Marine Operations and Systems.
“In order to build more depth into the research I was doing at the museum, Asgeir Sørensen suggested that I take a doctorate to build up a student group in the field of marine archaeology and technology,” says Ødegård.
He worked in interdisciplinary teams with biologists and engineers, in addition to archaeologists.
“This research has opened the eyes of biologists and engineers to the world of underwater archaeology.
We can see that we share a lot of common interests, and it’s fun and useful to work in an interdisciplinary way – even though it gets a bit crazy occasionally,” he says.
Ødegård will continue to split his time between AMOS and the NTNU University Museum in the future and will continue to study technology can help us collect new information from the ocean depths.
A variety of items typical found at wreck sites.
Measurements taken in the lab formed the basis for a spectral library that can be used to classify measurements on the seafloor.
Self-propelled vessels are the goal
Ødegård notes that AMOS and the AUR lab have developed a lot of the equipment that the researchers use.
“We test new equipment in the field, so it’s a win-win situation for the people who are developing the technology as well as for those of us who use the technology for research.
We’ll also keep working with the Defence Research Establishment, which is at the forefront of research on extensive and powerful AUVs,” he says.
“The long-term goal is to have extended and completely autonomous expeditions with unmanned AUVs, where wrecks can be detected, mapped and inspected with a variety of sensors and then return to the surface with high quality datasets.
We aren’t quite there yet, but we’ve been surprised by how close and how far we’ve come,” Ødegård says.
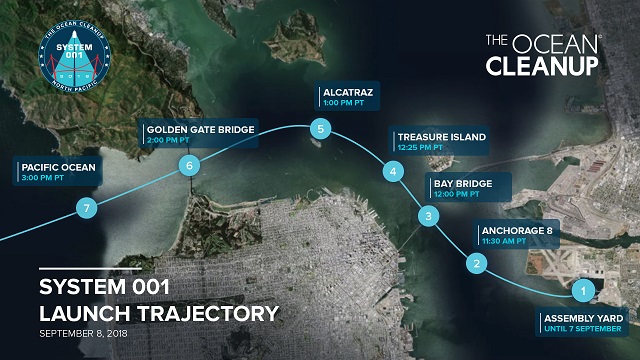
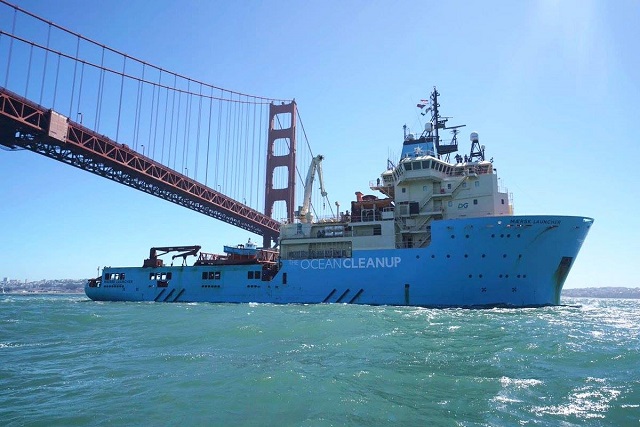
On September 8, the world’s first ocean cleanup system was launched from an assembly yard in Alameda, through the San Francisco Bay, toward the infamous Great Pacific Garbage Patch.
A project of staggering ambition will sail past San Francisco and out to sea through the Golden Gate.
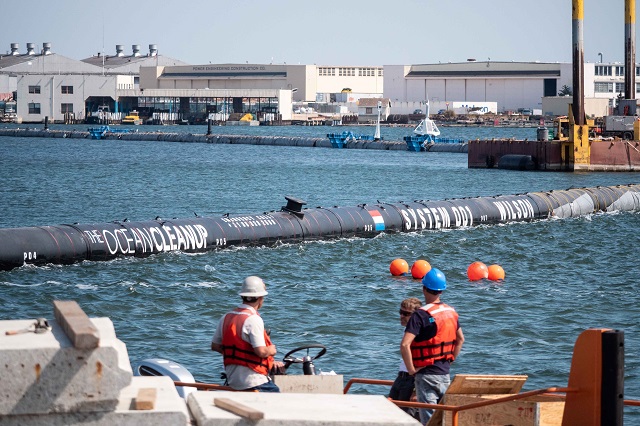
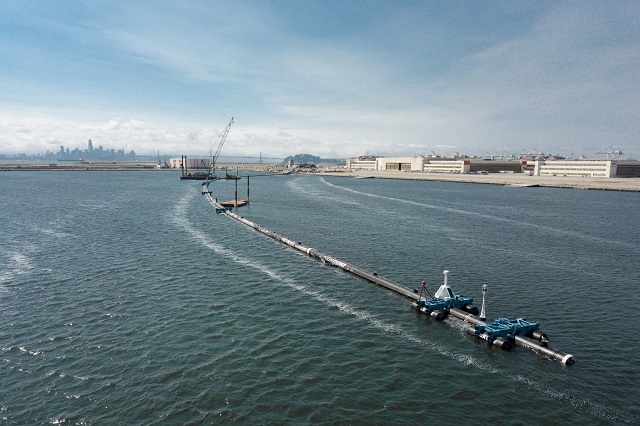
The invention of an organization called the Ocean Cleanup, it consists of a 600-meter-long plastic tube with a dangling screen that a ship will tow 240 nautical miles out to sea for testing.
If that pans out, it’ll head another 1,000 miles out to the Great Pacific Garbage Patch, where the U-shaped system will autonomously gather floating plastic for a vessel to come along and scoop up every six weeks or so, like a garbage truck.
The Ocean Cleanup says it aims to cut the amount of plastic in the patch in half in five years.
The oceans have a major plastic problem—over 5 trillion pieces of plastic taint the seas, and the Garbage Patch is only growing.
Accordingly, Ocean Cleanup has raised $40 million from donors and companies.
But many scientists don’t think Ocean Cleanup’s plan holds water.
In June, Southern Fried Science, a marine science website, did a survey of 15 ocean-plastic pollution experts.
More than half had serious concerns about the project, and a quarter thought it was just a bad idea.
“It's certainly ambitious,” oceanographer Kim Martini, who has studied the Ocean Cleanup campaign, tells WIRED.
“It oversimplifies a very complicated problem that people have thought a lot about.”
Credit: Benjamin Von Wong/The Ocean Cleanup
One issue is that we don’t yet know how ocean plastic is distributed in the water column.
“The fact is, a lot of plastic isn't at the surface,” Martini s ays.
“There's a lot of research showing that it's sinking.” A plastic bottle, for instance, will fill with water and sink to the seafloor.
And tiny bits of degraded plastic can swirl up and down the water column.
The free-floating Ocean Cleanup system may well snag the bits at the surface, but with a screen made of woven polyurethane that hangs down 3 meters at its lengthiest, it’s limited in what it can reach.
“There's also the fact that you're collecting and aggregating plastics, and so that's actually going to attract more animals to it,” says Martini.
“All this marine debris, things rest on it, things like to grow on it—it's kind of a marine desert out there.
It's amazing what a fish will do for a little bit of shade.”
The 'Wilson' project aims to collect plastic debris from the Great pacific garbage Patch
courtesy of Guardian graphic (source : the Ocean Cleanup)
Another concern is that organisms such as bacteria and algae will start to grow on the device itself, which could increase drag and the weight of the structure and potentially change how the dangling screens behave.
Ocean Cleanup, though, says it designed the system to be as smooth as possible, to discourage such growth.
And while the organization admits the device might attract curious sea life, it insists the system poses no threat.
“We designed the system such that there is basically no risk of entanglement,” says Arjen Tjallema, technology manager at Ocean Cleanup.
“So if a fish or a whale or another animal would come close to the system, then it’s relatively harmless.” Yet rogue fishing nets—which Ocean Cleanup’s research says make up perhaps half of the trash mass in the Great Pacific Garbage Patch—could float into the piping, get stuck, and ensnare turtles and other ocean life.
Still, doing nothing about the plastic problem isn’t helping marine life either.
The Great Pacific Garbage Patch (GPGP) contains at least 80,000 tonnes of plastic floating inside an area of 1.6m square kilometres
image : Scientific Reports, Lebreton et al
Then there’s the issue of the open ocean beating the hell out of the system and turning it into part of the problem it’s trying to solve.
Because the tube, after all, is made of 600 meters of plastic.
Even UV light may be a problem, as it can bombard plastic and cause it to shed tiny bits.
Ocean Cleanup, though, says its high-density polyethylene plastic can reflect UV radiation.
“I sort of wonder what kinds of microplastics this thing is going to be generating on its own, assuming that it's even functioning exactly as designed,” says oceanographer Kara Lavender Law of the Sea Education Association.
Worse yet, the thing could snap in a storm.
“If it's shedding nano-size particles and then gets smashed into 200-meter-long pieces, you're really covering the whole size range there.”
Ocean Cleanup says it has done hundreds of scale model tests of the system and tested prototypes in the North Sea.
It adds that the system is designed to weather the waves of a once-in-a-century storm.
If the device happens to wander out of the Great Pacific Garbage Patch gyre, Ocean Cleanup says it will dispatch a boat to tow it back into place.
Given the concerns about Ocean Cleanup’s plan, Law wonders whether it might not be better for (lowercase) ocean cleanups to tackle other, safer targets.
“Why not focus your efforts much closer to rivers or places we suspect most of this debris is originating?” she suggests.
This is the approach taken by the Waterfront Partnership of Baltimore.
It has deployed giant trash wheels complete with googly eyes known as … Mr. Trash Wheel and Professor Trash Wheel, which use the river’s own current to power a wheel that lifts trash out of the water and into a dumpster barge.
(If the river is running too slowly, solar power kicks in to get the wheel going.) Together, the devices have pulled 900 tons of trash from the waters around Baltimore.
The ocean is big. Cleaning up the Great Pacific Garbage Patch using conventional methods - vessels and nets - would take thousands of years and tens of billions of dollars to complete.
Our passive systems are estimated to remove half the Great Pacific Garbage patch in just five years, and at a fraction of the cost.
Our first cleanup system will be deployed in the summer of 2018.
Ocean Cleanup’s plan is more ambitious.
If the first system checks out over the next few weeks, it’ll head farther out to sea to get to work.
The end goal? Sixty giant pipes floating out there.
“It's a grand experiment that they're conducting,” Law says.
“It would not be my first choice for an intervention, especially out in the middle of the ocean, but we'll see what happens.”
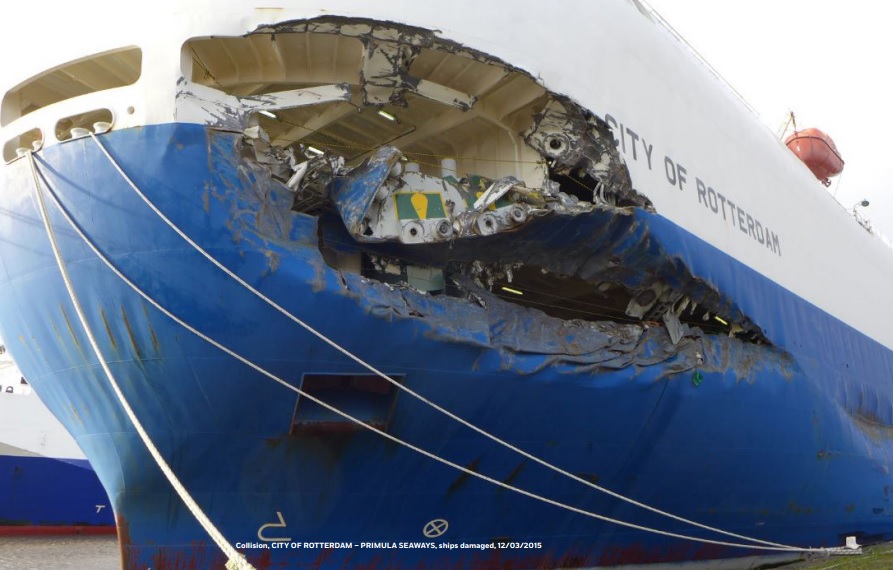
As maritime commercial and recreational traffic increase, accidents become more likely to happen.
To prevent collisions at sea, researchers of the MTCAS project are now making use of a technology originally used in aviation.
MTCAS stands for Maritime Traffic Alert and Collision Avoidance System.
While standard systems only depend on currently observable ship data such as location, direction and speed, the MTCAS algorithm also integrates historical tracking data, planned routes, knowledge bases, external information, an environmental database and navigators in the decision making.
This allows for a dependent, precise warning and clear, misunderstanding free manoeuvres.
The history has shown a continuous increase in year to year accidents at sea.
In the near future, higher traffic density is estimated, which contributes to this increase.
Within the 3-year Project MTCAS, 5 German partners from industry and academia contribute to accident reduction by developing an e-Navigation Assistance System for pro-active, predictive and cooperative collision avoidance.
MTCAS is the abbreviation for Maritime Traffic Alert and Collision Avoidance System, which implies the basic idea of adopting the Airborne Collision Avoidance System (ACAS) implementation TCAS.
However, MTCAS broadens its bounds by assisting the ships’ crew in conflict detection and conflict resolution under consideration of a ships holistic environment.
Concrete examples include regularities, bathometry, non-equipped vessels and VTS, which are elaborated in this paper.
Dissident from TCAS, MTCAS does not automatically intervene in terms of issuing steering commands, but supports seafarers in cooperatively finding safe and efficient trajectories, whose onboard implementation avoids collisions.
This paper informs about the activities in the MTCAS project.
We welcome constructive thought and feedback to foster synergies amongst our domain.
Introduction
Continuous increasing accident risk drives the need for a Maritime Traffic Alert and Collision Avoidance System (MTCAS).
As broadly known, “around 90% of world trading is carried out by the shipping industry” (Chauvin, Lardjane, Morel, Clostermann, & Langard, 2013) the shipping industry has implemented a number of measures aimed at improving its safety level (such as new regulations or new forms of team training and thus shipping can tip the scales of our world’s economy.
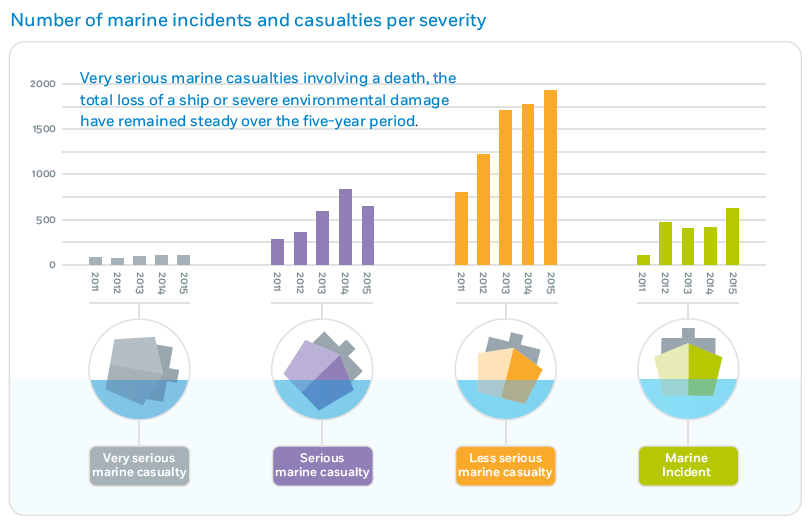
The ongoing trend towards an increasing size of new builds, in terms of capacities for cargo and passengers seems to contribute to the magnitude of accident risk: A correlation to an increase in maritime accidents can be perceived from current accident statistics.
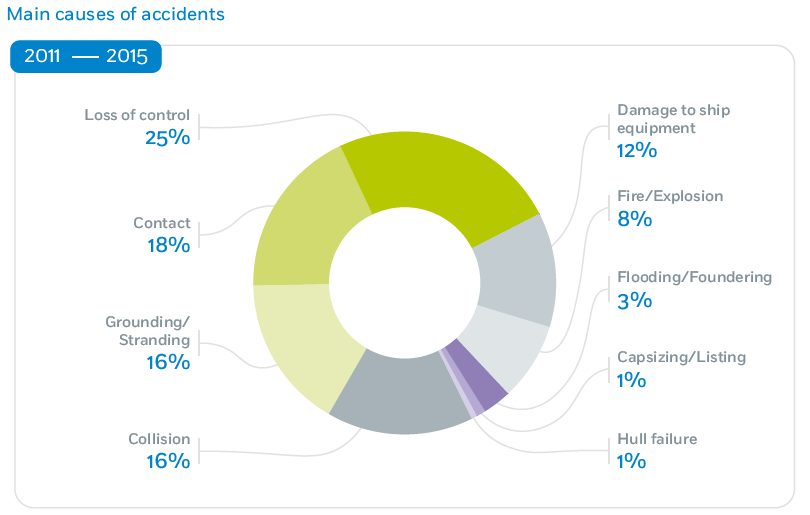
Whereas collisions is solely one of six categories in the EMSA accident statistic, at least samples from the categories contacts and groundings, such as beaching, can be accounted to accident preventive actions.
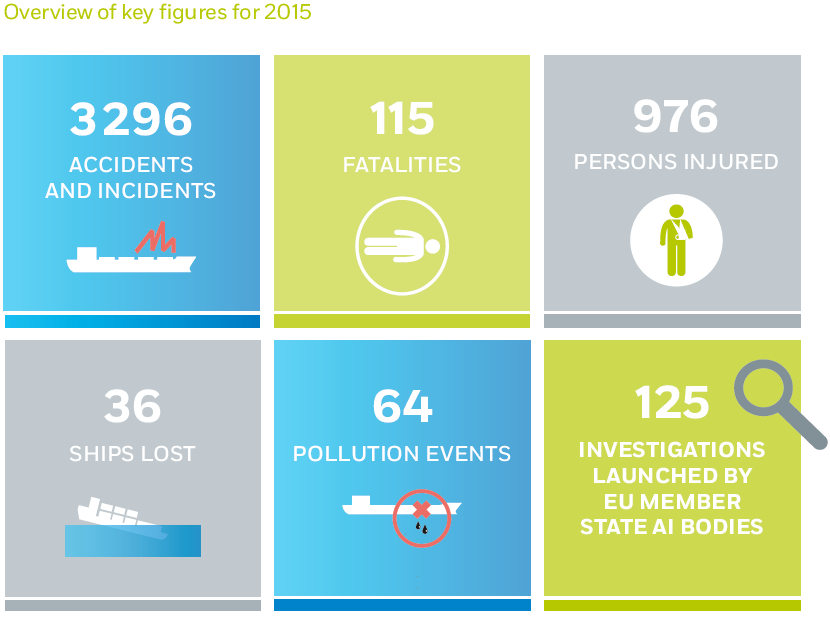
EMSA overview of maritime casualties between 2011 and 2015.
Nowadays Collision Avoidance Means
Collision avoidance is a major process on a ship bridge and in Vessel Traffic Services (VTS), where officers, pilots and operators strive towards efficiency and safety of maritime transport.
Therefore classical navigational means are used, which are briefly introduced in this section.
Automatic Radar Plotting Aid (ARPA)
ARPA is a plotting aid, whose functionality includes detection and tracking of foreign vessels.
On modern INS bridges it may be integrated into ECDIS.
For collision avoidance it provides restricted movement predictions, which are based solely on CPA/TCPA, which imply a constant velocity approach.
Automatic Identification System (AIS)
AIS is a radio system for exchanging navigational and ship data in-between ships and as a means for shore-side surveillance via a VTS-System.
Since enactment of SOLAS continuously commercial fleets have been equipped with this technology, to continuously interchange static and dynamic passage data.
Non-obtrusive shortcomings of AIS are potential misuse through users’ key errors and lag of security, such that the integrity, confidentiality and availability of data is not given.
Maritime Mobile Service (MMS)
MMS is according to ITU a “mobile service between coast stations and ship stations, or between ship stations, or between associated on-board communication stations; survival craft stations and emergency position-indicating radio beacon stations …” (ITU, 2012).
The inter-stations communication via voice bears the risk of imprecise situation forwarding amongst participants, since English is the second language for many and language barriers may displayable conveying crucial information.
Related Work
MTCAS incorporates technologies, which are part of the current state of the art in ship dynamics modelling, trajectory planning, VTS technologies and modern positioning, navigation and timing (PNT).
Ship Dynamics Modelling
Physical characteristics of a ship limit its manoeuvrability.
Ship characteristics, such as hull form, size, and propeller/ engine, effect with environment conditions, such as water/waves and air/wind.
Both, ship characteristics and environment conditions are part of modern mathematic models for dynamic manoeuvrability calculation.
Model results can be facilitated in trajectory planning.
(Benedict, Kirchhoff, Gluch, Fischer, & Baldauf, 2009)
Trajectory Planning
On a strategic level waypoint planning is part of every voyage plan, which is typically settled pre-departure.
On an operational level ships’ crew executes manoeuvers by adjusting the helm or autopilot, to start a turn.
On the tactical level, decisions are made, that implement the strategy on the operational level.
This is where manoeuvrability and environment can have leverage on operational performance on safety and efficiency.
With evolutionary algorithms, behavioural leaning approaches and/ or neural networks trajectories can be found, which consider ship and environment.
With these techniques, single ship optimal solutions can be found.
To find a global optimum n-trajectory negotiation approaches have recently been developed (Hornauer & Hahn, 2013).
VTS Technologies
Detection of deviations from anticipated behaviour is implemented in modern VTS-Systems.
The project EfficienSea, and its successors, advance in the area of centralized concepts for sea traffic management.
Times of VTS’s sole availability via MMS will soon be surpassed.
With ongoing activities such as the project COSINUS, VTS-Systems are integrated into automated route exchange amongst ships via a data link.
Resilient Positioning, Navigation and Timing (PNT)
To exchange trajectories for proficient collision avoidance, instead of routes, precise data is required.
This is not given in nowadays systems, where GPS may induce standard deviation error in positioning and GNSS may negatively influence common timing through interferences.
Resilient PNT encounters these disadvantages with sensor data fusion, which has been demonstrated in project ACCSEAS and MonaLisa.
Whenever collision avoidance as a safety of life critical application should be based on absolute positioning, then the question arises, how resilient provision of PNT data can be achieved onboard a vessel.
Due to the vulnerability of GNSS with respect to ionospheric disturbances, jamming and spoofing the joint usage of other systems (terrestrial backup systems) and other onboard sensors is considered.
Vulnerability encountering backup systems like e-LORAN, R-Mode or absolute RADAR positioning have been evaluated and proposed (Ziebold et al., 2010), (IMO, 2012).
Onboard a vessel a sensor fusion algorithm is responsible for the PNT data provision.
All available Position, Velocity and Timing (PVT) and Navigation data, from onboard sensors in order to provide optimal PNT output data, is integrated.
Asides optimal estimations of the PNT output data, also integrity information is provided, based on accuracy estimations.
A new COLREG-compliant collision avoidance system developed by the MTCAS project in its first demonstration test in Germany in Wilhelmshaven on September 6th, 2017.
THE MTCAS Approach
MTCAS assists in collision avoidance by warning the crew before critical situations develop and recommends evasive manoeuvres for conflicting ships.
Dissident from TCAS, MTCAS does not automatically intervene in terms of issuing steering commands, such that it can be seamlessly integrated into nowadays (legally regulated) operations on-board of a ship.
Meanwhile, MTCAS supports seafarers in cooperatively finding safe and efficient trajectories, whose on-board implementation (solely by seafarers) avoids collisions.
MTCAS will be developed on the basis of required equipment and advanced sensor technologies.
Further, within the project, organizational processes around MTCAS are developed and tested, considering responsibilities and interaction of people on board and in VTS.
The development of MTCAS is based on four core concepts:
Improved Situational Awareness
An essential contribution of MTCAS is enhancing safety and efficiency, by increasing situational awareness about critical traffic situations.
A starting point for MTCAS is the route exchange technology, which has been developed in the COSINUS project, enhancing harmonized situational awareness aboard and ashore.
MTCAS integrates this technology for conflict detection and evasion.
To gain required operational precision the technology will be extended with improved integrity monitoring and exchange of ship dynamics.
Additionally, MTCAS is collecting information about the environment from heterogeneous data sources.
The more information is available, the better is the situation assessment.
When the situation is evaluated, MTCAS will provide the result to the captain and ask for a confirmation.
That happens on all related ships.
MTCAS will submit the confirmation of the captain to all off the other ships.
Therefore, all captains are aware of the situation and know that the others are as well.
MTCAS ensures all captains have the same information about the situation and prevents misunderstandings.
Context-sensitive Prediction
Depending on the current traffic situation and under consideration of ship dynamics as well as information on the route and past motions of the own ship MTCAS predicts ship movements and short term traffic progression.
This incorporates for instance intention prediction, topology of water ways, bathymetry, ships’ destination, rules and regulations and VTS information.
This prediction leads to an enhanced alarm management.
Due to the prediction false alarms are suppressed or corrected.
This decentralized calculation of traffic and manoeuvre predictions (on each ship) is exchanged (Ship2Ship2Shore) and commonly coordinated/adjusted.
Thus a local overview of the situation is enriched to a complete traffic situation overview over time.
Testing MTCAS (2018 February)
Decentralized automatic negotiation of evasive manoeuvres
MTCAS aims at on-board and ashore working decentralized conflict detection and at safe and efficient conflict resolution in critical situations.
Ships’ masters agree jointly on a set of evasive trajectories.
Monte Carlo simulation to analyze the risk of incorrect collision detection
Situation awareness is improved through route exchange and context, which improves the prediction of ship movements.
Where today systems would trigger three alarms (left), the context sensitivity of MTCAS allows a detailed operational picture of driving situations (right).
A set of evasive trajectories is therefore always suggested to all ships’ masters, which has to be accepted of declined.
MTCAS will guarantee that evasive trajectories are found within real-time and that the crew can always be aware of and integrated in the conflict resolution process.
Within the project MTCAS’ safety will be proven with qualitative and quantitative means, to secure a gain towards maritime safety.
The two mayor benefits from this project are improved predictive situation awareness and to reduce misunderstandings my supporting the seafarer in consistent situation assessment and evasive manoeuvre planning.
Waldseemuller’s 2nd world map (1516) by which he had abandoned Ptolemy’s classical map projection and used newly available information provided by Portuguese a.o. explorers.
Lorenz Fries Map of the World (1522 / 1535)
French map (1547)
Ali Macar Reis map (1567) (Ottoman Archives, Turkey)
Bertelli / Forlani 1568 World Map ("Vniversale Descrittione Di Tvtta La Terra Conoscivta Fin Qvi") based on an earlier Gastaldi map
Mercator world map (1569)
Portulan portuguese map of the world by Domingos Teixeira (1573)
Jodocus Hondius' Map of the World - 1595
Atlas sive Cosmographicae Meditationes de Fabrica Mundi et Fabricati Fugura (1596) author : Gerardus Mercator (source : Rarebookroom)
Wanguo Quantu or Complete Map of the Myriad Countries (1620s)
Double-hemisphere map of the world (1651)
Hemisphere map of the World by Dutch publisher Joachim Bormeester (1685)
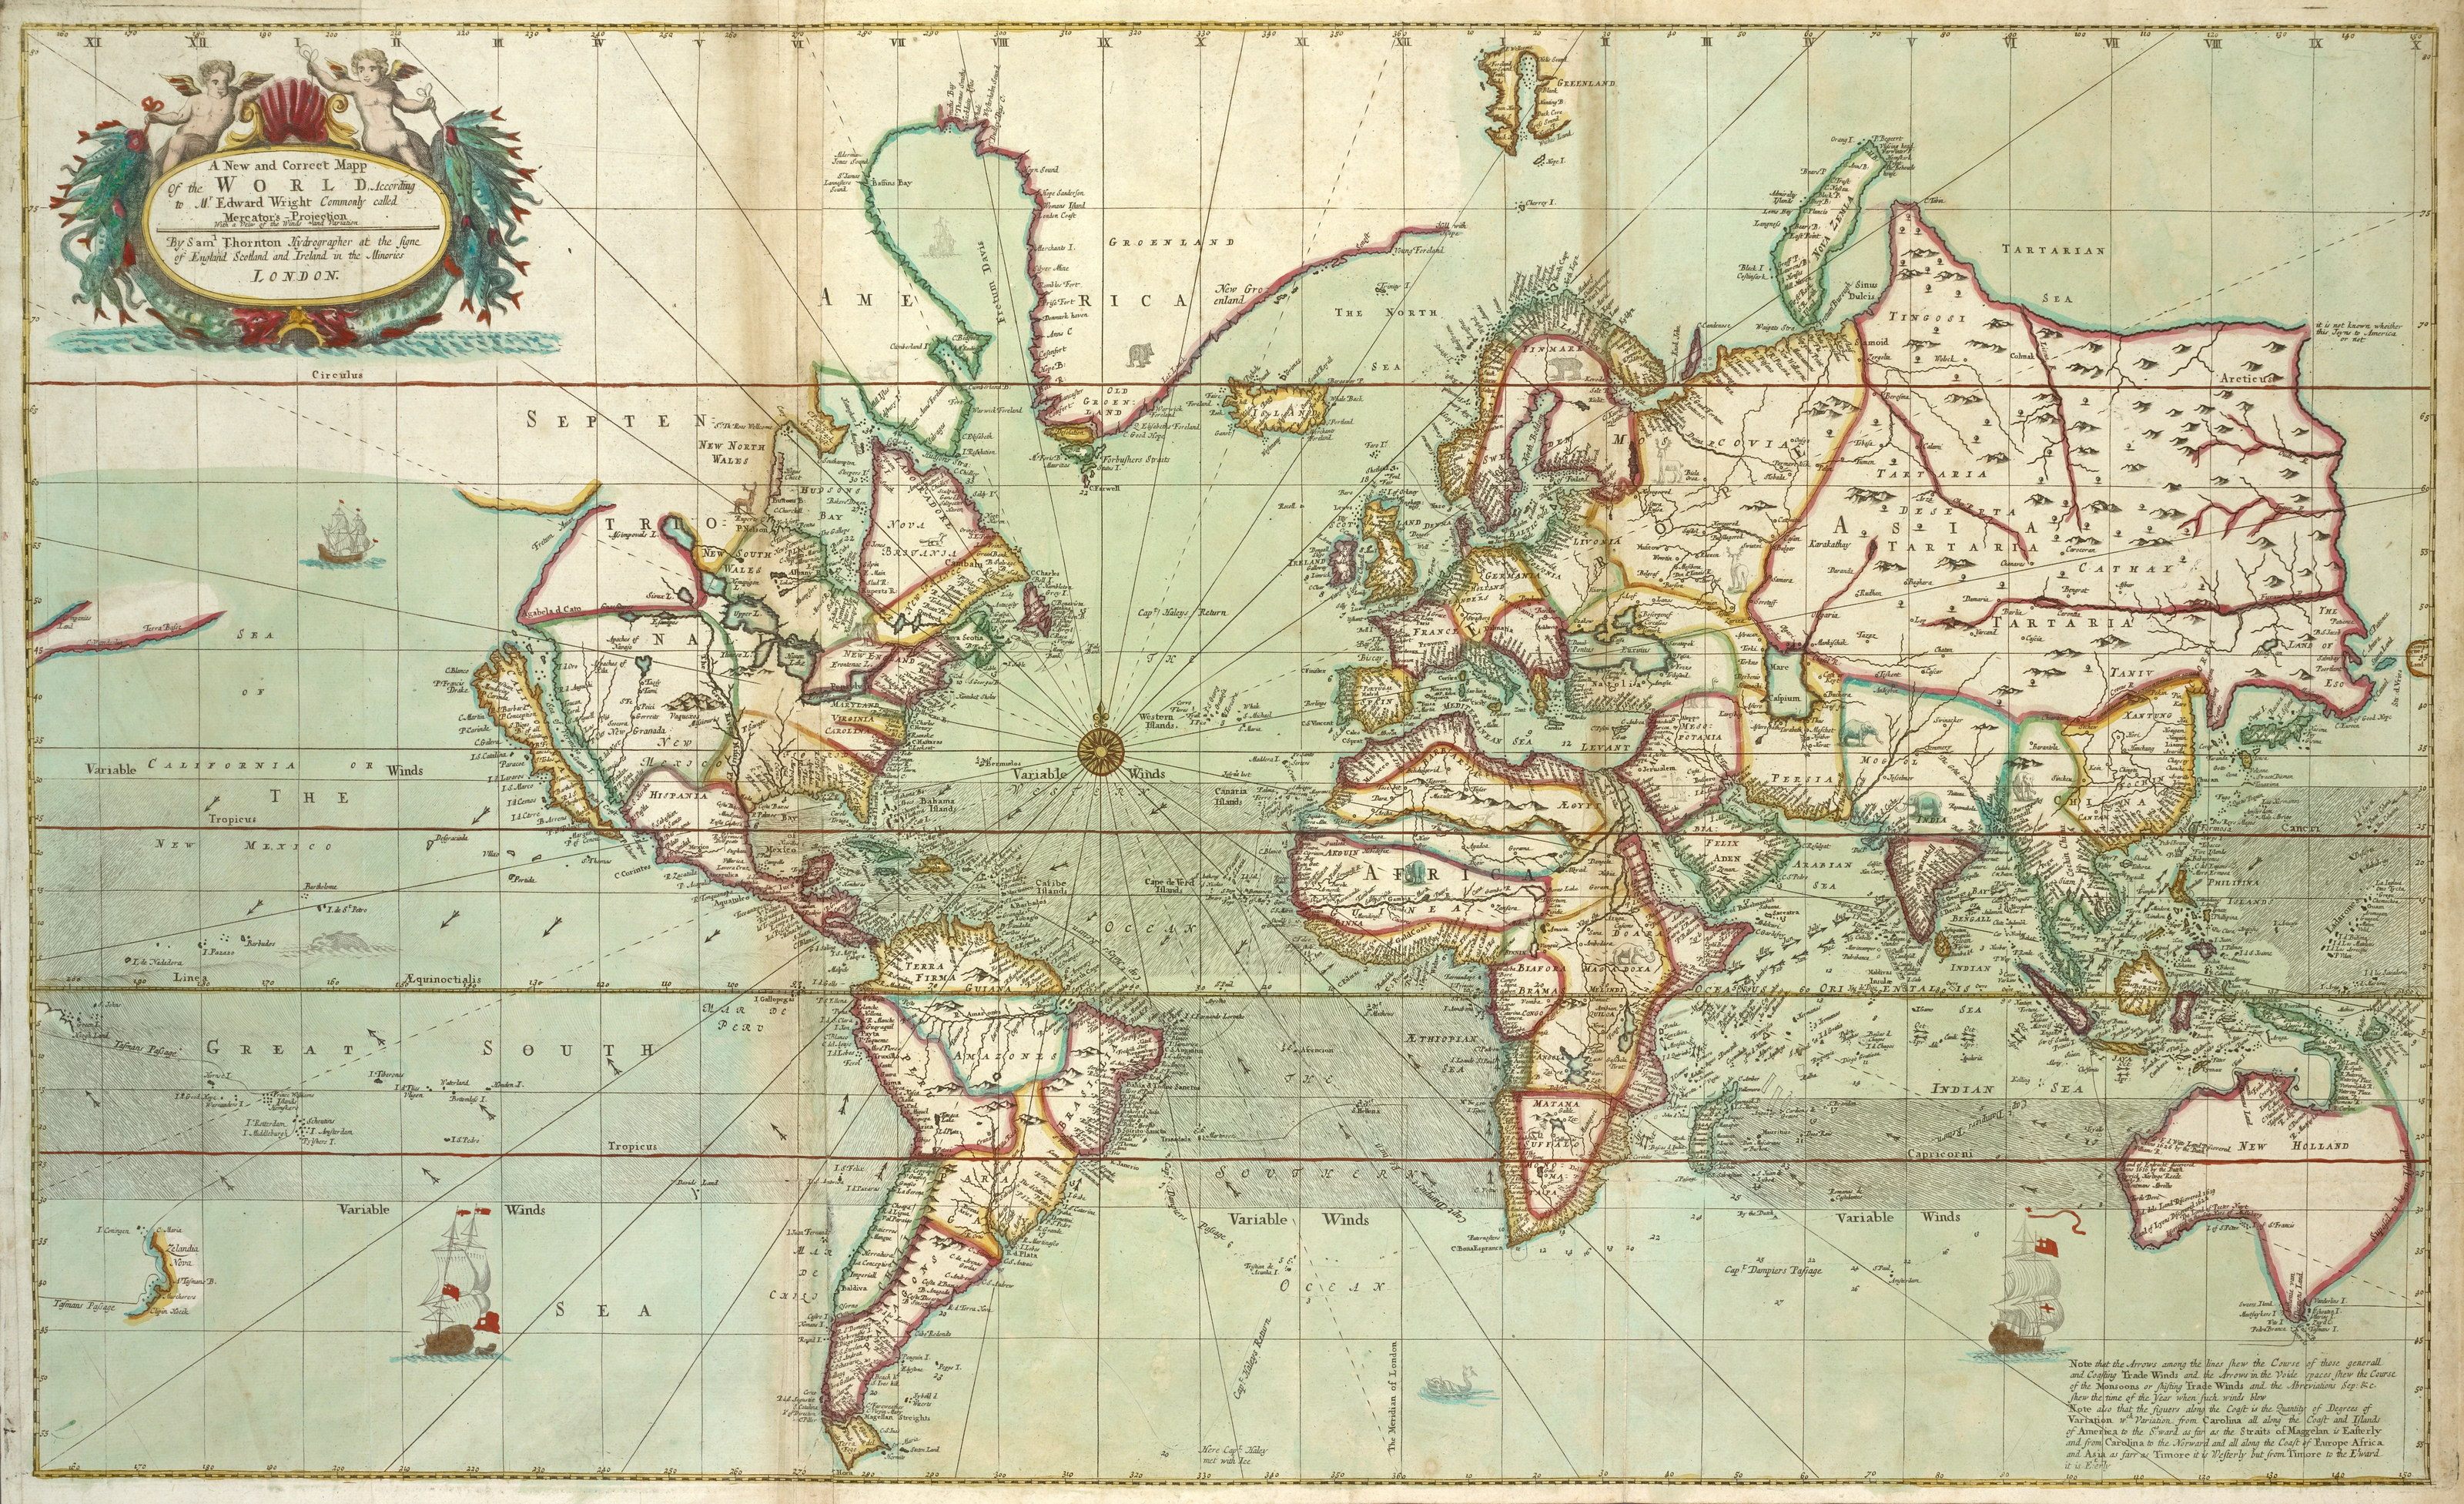
Samuel Thornton sea atlas (circa 1702 - 1707) Title reads: " The new and correct Mapp of the WORLD according to Mercador's projection" A large sea-chart of the world on Mercator's Projection.
It depicts California as an island, and shows the Mississippi and the Great Lakes in North America which was at the time the newest updates in world cartography.
Thornton also provided great details in the sea trade winds, the time of the year they flow, as well as seasonal monsoons. The map also reveals the routes of such great maritime explorers as - Abel Tasman: a Dutch explorer who discovered Tasmania to which he gave his name, New Zealand, and the Fiji Islands. - William Dampier: The first English explorer to explore part of Australia and the first person to circumnavigate the world three times. - Edmund Halley: English astronomer and geophysicist who is famous for successfully calculating the orbit of the comet now known as Halley's Comet.
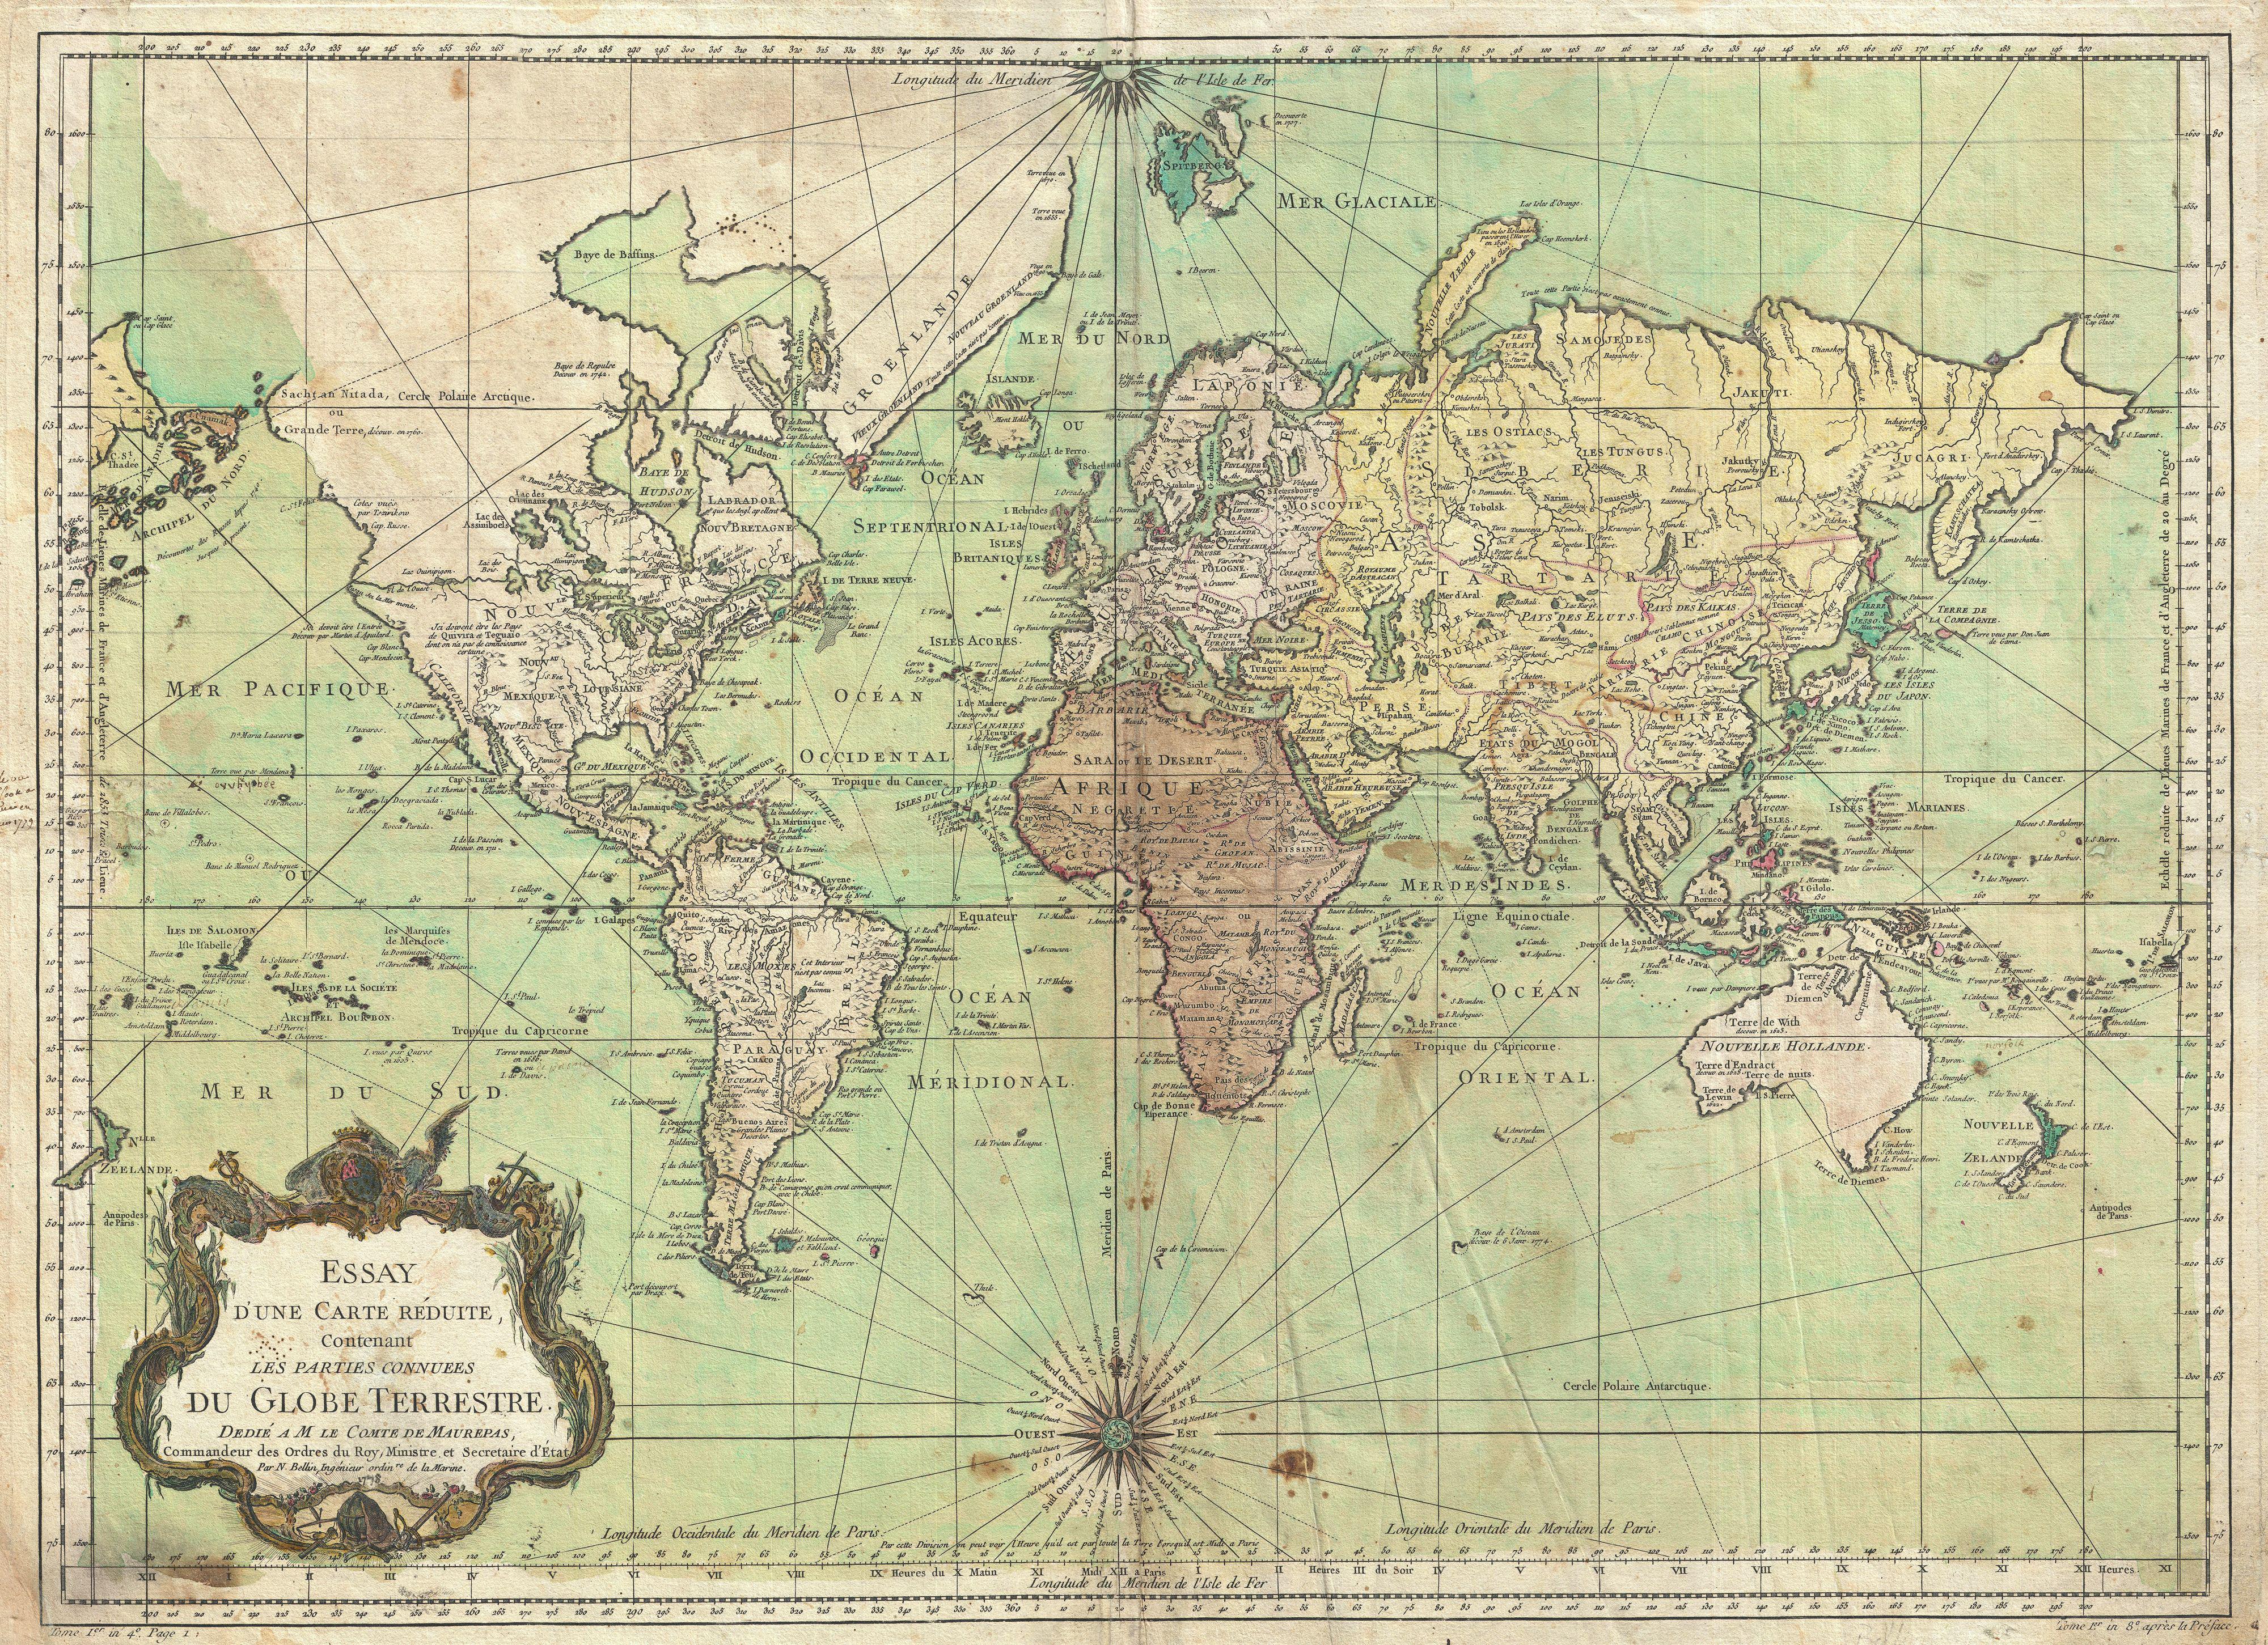
An attractive first edition first state example of Jacques Nicolas Bellin’s 1778 nautical chart of the world. Presents the entire world on a Mercator Projection based on a Paris (L’Isle de Fer) meridian. This is notably the first state of this important map, exhibiting a pre-Cook geography throughout, but most specifically in the Pacific and along the northwest coast of America. North America to the west of the Mississippi is vaguely rendered according to 16th century expeditions into the region by Coronado, La Salle, De Soto, and others. Bellin identifies the semi-mythical civilizations of Quivira and Teguayo, both associated with legends of the Seven Cities of Gold, in what is modern day Utah, California, and Nevada. Along the western coast the strait discovered by Martin Aguilar is noted. Further north still the River of the West (Fl. de l’Ouest) extends from the west coast to the Lake of the Woods (Lac de Bois) and thence via additional waterways to the Great Lakes and the Atlantic. The River of the West appeared in many 18th century maps of the Americas and is reflective of French hopes for a water route from their colonies in Canada and Louisiana to the Pacific. Still further north the coastline becomes extremely vague, in places vanishing altogether. The Aleutians are vaguely rendered according to various sightings by Vitus Jonassen Bering and Aleksei Chirikov in the 1740s and identified as the “Archipel de Nord”. In the Pacific, various Polynesian Island groups are noted though many are slightly or significantly misplaced. The Solomon Islands are vastly oversized referencing the early 17th claims of Quiros. The other lands discovered and erroneously mapped by Quiros in 1606 and Davis in 1686 during their search of the great southern continent are also noted. Hawaii, as yet undiscovered, is absent. New Zealand is rendered twice though is accurate in its form and position. Australia, here labeled “Nouvelle Holland”, has part of its southern coastline ghosted in and Van Diemen’s Land (Tasmania) is attached to the mainland. The southern coast of New Guinea is similarly ghosted in, suggesting its unexplored state. It is of interest that there is a common misconception regarding this map that suggests the first edition was dated 1748. There are editions with a printed date of 1748, but these are actually later editions. The 1748 date is a printing error in which “8” and “4” are transposed, the actual date of publication being 1784. The first edition of this map is the 1778 example shown here.
1744 Bowen Map of the World on Mercator Projection (Sea of Korea identified)
1801 Map of the World on Mercator Projection by John Cary.
Designed to illustrate the explorations of the previous century A New Chart of the World, on Mercator's Projection: Exhibiting the Track & Discoveries of themost Eminent Navigators, to the Present Period. Details the entire world as it was known at the turn of the 19th century. Displays the continents in considerable detail but offers only minimal information in the Arctic and Antarctic latitudes. Designed to illustrate the explorations of the previous century, focusing specifically on the important explorations of Cook, Vancouver, Perouse, and Gores. Offers copious notations on explorations and unconfirmed discoveries throughout. Prepared in 1801 by John Cary for issue in his magnificent 1808 New Universal Atlas.


.jpg)


/https%3A%2F%2Fblueprint-api-production.s3.amazonaws.com%2Fuploads%2Fcard%2Fimage%2F844287%2Ff26b52aa-d982-48c3-bae0-de9f34958004.jpg)


_033.jpg)


