Saturday, February 1, 2014

Cruise ship timelapse - Extension of Balmoral at Blohm+Voss repair shipyard


Fred. Olsen took delivery of the ship on November 7, 2007, renaming her after the Balmoral estate. The company initiated a major refit at the Blohm + Voss repair shipyard in Hamburg, Germany, before her inaugural cruise on February 13, 2008 to Florida—her base for Caribbean cruising.

The work included the insertion of a 30 meter (99 ft) midsection, built in conjunction with Schichau Seebeckwerft in Bremerhaven, and floated into Hamburg at the end of October 2007.
The reconstruction added a further 186 passenger and 53 crew cabins, making the ship currently the company's largest.
It also introduced 60 new balconies, along with new and modified public areas, all designed to appeal particularly to the British cruise market.

Friday, January 31, 2014

How the U.S. maps the World’s most disputed territories

Arctic management area and disputed waters

From Wired  by Greg Miller

When the United States decides to recognize a new government, or an existing country changes its name, Leo Dillon and his team at the State Department spring into action.
Dillon heads the Geographical Information Unit, which is responsible for ensuring the boundaries and names on government maps reflect U.S. policy.
The team also keeps an eye on border skirmishes and territorial disputes throughout the world and makes maps that are used in negotiating treaties and truces.
These days, Dillon says, maritime borders are where much of the action is.
(The recent political squabbling and military posturing between China and Japan over the tiny islands known as Diaoyu in China and Senkaku in Japan is one potentially worrisome case in point.)
Dillon’s been at the State Department since 1986, and he says his job remains as fun as ever.
“The landscape of political geography is constantly changing,” he said.
“Every day I come in here and there’s something new.”

We spoke with Dillon to learn more about it.


A tiny island off the coast of Morocco, which Spain calls Perejil island, and Morocco calls Leila.
Both countries claim the chunk of rock, which is inhabited primarily by goats, and the dispute is so hot that they almost went to war over it in 2002.
During summer 2010, Google noticed that its maps attributed the island to Morocco, which it is geographically closer to.
It consulted the UN, and decided to mark the island as a disputed territory—but as of this writing, it now attributes the island to either Spain or to no one, depending on the search criteria entered.

WIRED: What’s an example of an interesting border dispute you’ve worked on?
 
Leo Dillon: One case I worked on that was kind of fun involves a tiny island off the coast of Morocco.
It’s very close to shore and very, very small.
But about 11 years ago Morocco sent a few troops there and Spain swooped in with helicopters and expelled them and it became a big deal.
[Then-Secretary of State] Colin Powell was asked to mediate the conflict.
[In Powell's plan] everyone was going to leave the island, with no prejudice as to who it belonged to. They drew up an agreement but the problem was the name.
The Spanish wouldn’t use the Moroccan name and the Moroccans wouldn’t use the Spanish name.
I was at a dinner party that Saturday night and I got a call from the Secretary’s staff saying that instead of a name they wanted to use the coordinates for that island.
So I showed them how to get on a database and do that.
I could hear the Secretary in the background saying, “Ask him how accurate those coordinates are.” They’re not totally accurate, but there’s no island nearby with which it could possibly be confused.
So the documents he drew up for the mediations referred to “the island and such and such coordinates” and those documents had to be signed by the prime minister of Spain and the king of Morocco by midnight that same day.
The prime minister of Spain signed, no problem.
But they had to send a high speed car looking for the king of Morocco.
This was in the days before cellphones were prevalent.
So they caught up to him and he basically had to pull over at some house and say, “Excuse me, I’m your king, could I use your phone?”
He called up Powell and asked him to read the document, which he immediately agreed to.
So that was a big deal, and my small part in it was to provide those coordinates.
It’s a great example of how geographic names matter.


WIRED: Where do geographic names come from in more ordinary circumstances?

Dillon: What we’re looking for is names that are used officially or names that are used locally. Actually, officially usually trumps locally.
Ninety-five percent of the names in our huge database come from official maps, and maybe five percent require special treatment.
That’s where I come in quite often and investigate.
Especially in places like Asia or Africa it comes up because sometimes there’s a typo on a map or something doesn’t look quite right.
A good example is a Syrian town near the border with Turkey.
It’s an important town that’s been in the news a lot.
Most people call it A’zaz, but then I noticed our staff had changed it to I’zaz because there’s a large scale map that spells it that way.
And some local people apparently do call it I’zaz.
But almost everybody calls it A’zaz, and I had to build a case using everything from Syrian websites, to reputable atlases like National Geographic to internet sources.
A State Department map illustrating disputed borders in South America.


WIRED: What happens when a new country comes up?
Does that trigger a lot of work for you?

Dillon: It sure does.
Every time a new country comes by it shakes up the order.
Usually you have a lot of advance notice, but it still gets complicated.
For instance, when we recognized Kosovo there were many sets of boundaries.
The peacekeeping forces there were using boundaries that weren’t really the legal boundaries at all. Their job was to keep peace in a buffer zone, so they’d set up working boundaries in a way that made it easier for them to keep people with guns apart.
We were going with the largest scale available map, in this case a series of Yugoslavian-made maps in the Library of Congress.
But it took a while to explain to people why we had the boundary the way we had it and what we were basing it on.
The names were an issue too.
Before, Serbian names were all we used, but now the State Department said we can’t do that, we have to use both Serbian and Albanian names for each and every town and feature.
We had to go chase down an authoritative source of Albanian place names, which had never really existed. The Kosovars did a reasonably good job of tracking them down.
But then we had to make a basic reference map, and I couldn’t include as many towns as I wanted to because I couldn’t fit all the labels.
The other problem from our perspective is that a new country makes all the old reference maps obsolete.
The other day I was asked for a good page-sized map of the Central African Republic because things are going on there.
We have one produced in 2004.
Well, it’s no good anymore because it doesn’t say South Sudan.


WIRED: What kinds of information do you use when you’re working on a border dispute?

Dillon: It’s mostly whatever commercial satellite imagery we have available.
Honestly, these days it’s a lot of good old Google Earth.
We prefer commercial because it’s neutral.
But we also use terrain data from SRTM [the Shuttle Radar Topography Mission] or LIDAR or whatever else we need.
In one case, my colleague went to the capitals of both Kosovo and Macedonia.
Formerly they were two states in Yugoslavia.
Their borders weren’t all that properly defined, and they needed to normalize their borders to have proper diplomatic relations.
But they were very mistrustful of each other.
He showed up with some Google Earth and Landsat images and showed them that there was this ridge line.
He showed them that it’s not a big deal, you might have to give up an acre here or there, but if you just follow the ridge line that’s where the boundary should be.
And they agreed.
So it was a kind of technical solution to a politically charged situation.
It worked out very quickly.


WIRED: Do you ever go to a place and survey a disputed border?

Dillon: No, we don’t do that.
That’s not our job.
Instead we try to act as a good faith broker between two parties, and we only do it if they both ask us.
That’s what happened in Kosovo-Macedonia.
We also helped out in Azerbaijan-Armenia and Ethiopia-Eritrea.


WIRED: Do you ever use historic maps?

Dillon: All the time.
A good example is during the Iraq war.
Our embassy staff were trying to negotiate with the Kurds in the north, and the Kurds were saying these lands used to belong to us, and our folks there had no way of knowing if that was true.
I got tasked with finding old maps that would corroborate what these guys are saying.
So I went to the Library of Congress and found old maps of the area.
I was able to make copies and georectify them and put them up against Kurds’ claims, and that was used as a negotiating tool.
Our folks were able to say look, you said this whole area used to be in this particular province, but you can see here that only half of it was.
And they’d say, “Oh yeah, maybe you’re right.”
One of my colleagues is working hard now on India and China, which is one of the few borders that never really had a solid treaty behind it.
He’s got all these detailed maps from both sides, and he’s trying to work through the differences.
He’s found areas where the British surveyors on the Indian side made mistakes.
He’s basically doing detective work, where he can say it’s obvious they had a guy on this ridge line and another guy on this ridge line, but there was a valley in between they couldn’t see, so they basically drew a line where they shouldn’t have.


Dillon and his team often use historic maps to research boundary claims. 
This 1900 map depicts a (still) contentious region of the Costa Rica-Nicaragua border as arbitrated by President Grover Cleveland.
Image: courtesy of Leo Dillon


WIRED: Do you work with a lot of classified maps?

Dillon: Most classified maps we deal with are something that’s going on at a given time.
They show the movement of rebel groups or narcotics or something like that.
But they’re ephemeral.
I don’t like to make them because why make a map that only a small number of people will see and is only useful for a short time?


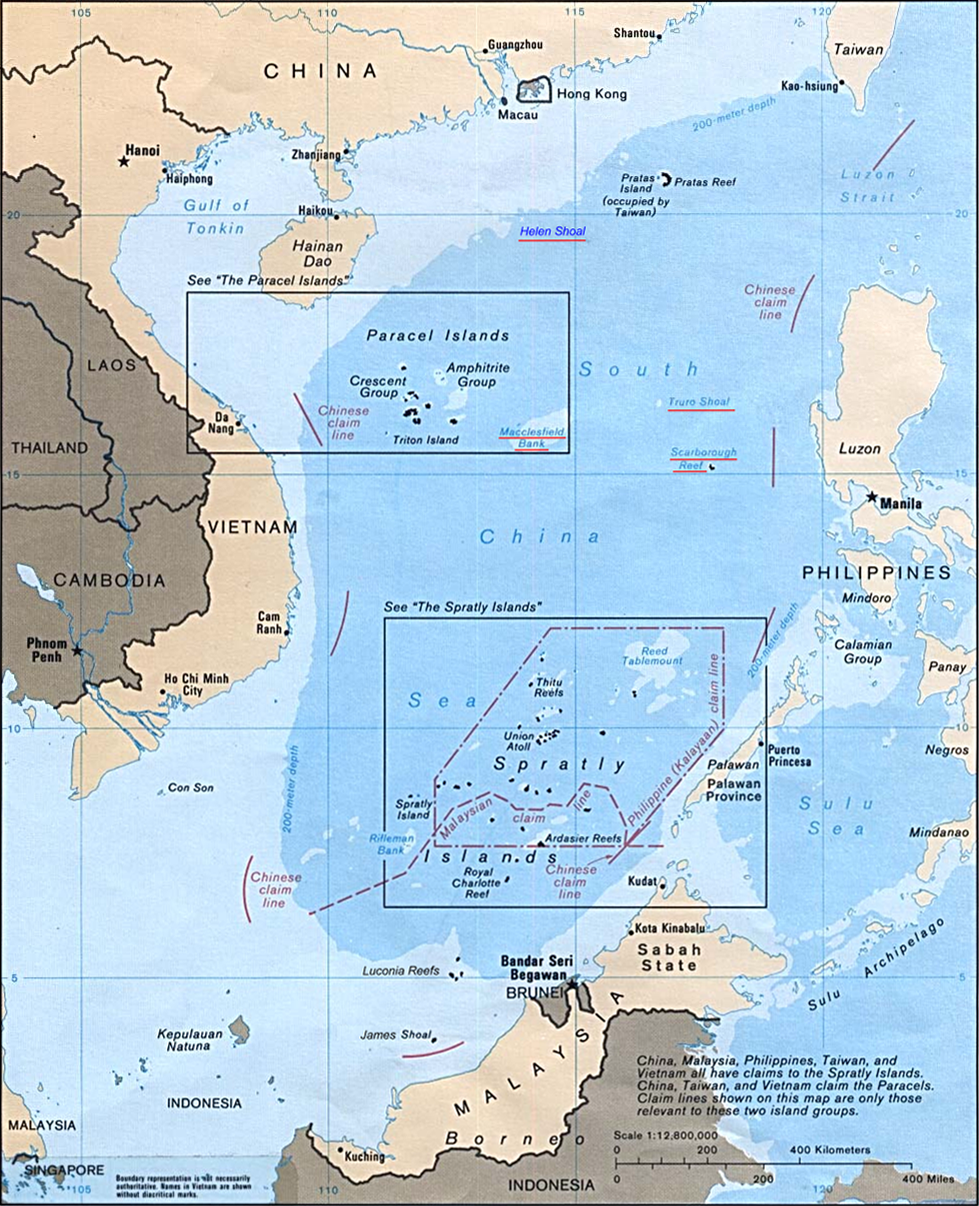
South China Sea disputed territories

WIRED: Where are some of the current hot spots in terms of border disputes?

Dillon: Maritime borders are really where the hot spots are right now.
The South China Sea is huge right now.
You’ve got all these tiny islands there that are claimed by various actors.
In the eastern Mediterranean there’s all these complicated maritime agreements that some states recognize and other states don’t.
As people are trying to exploit resources in the sea it’s getting more and more important for them to be able to delimit the areas of sovereign rights.
You have what’s called your territorial seas, which is 12 nautical miles [off the coast], then you have your exclusive economic zone which is 200 nautical miles, and you even have certain rights to what’s called the extended continental shelf which goes beyond 200 nautical miles — if you can define it. Some states are trying to do that responsibly using international law, and some states are not doing it responsibly.


WIRED: How does defining maritime borders differ from defining land borders?

Dillon: Maritime boundaries are actually simpler.
Most people agree on a principle of equidistance, so you just have to get together and agree on a distance.
You take an island or a coastline and start drawing concentric circles out and find a midline between them.
But there are disputes all the time.
Burma and Bangladesh took a case to the International Court of Justice recently.
Chile and Peru is another case we’re really watching.
A decision could be out any day. (see GeoGarage blog)


WIRED: Is climate change creating new areas of dispute?

Dillon: Sea level rise is going to play an enormous role in coastal states.
People who are trying right now to negotiate their maritime boundaries with a neighboring state have to take that into account.
If you chose a spot right now that’s the terminus of your land boundary and you move it out 12 nautical miles, and your shoreline is very shallow, you may find yourself in 100 years with your land terminus underwater.


WIRED: Have open access cartography tools like Open Street Maps impacted your work?

Dillon: In a way, yes.
Not so much with boundaries because boundaries are legal instruments.
Anybody can put down a boundary in OSM but nobody’s going to pay attention to it because there’s nothing backing it up.
But in the realm of names, definitely so. People are putting down names in OSM that are quasi-official or not official or local, and those are very interesting.
We look at them and we collect them.
Before the internet, we had a much easier time defending the names we used because we were considered much more of an authority.
Now, if you want to find out how to spell a town in an Arabic country, if you go to Wikipedia you may find a name that’s more commonly used on the ground. It’s something we’re having a hard time keeping up with.
The democratization of cartography, much like the internet as a whole, has opened up the world of geographical knowledge to a much bigger degree.

Thursday, January 30, 2014

Image of the week : Dunes of the Great Bahama Bank

Though the above image may resemble a new age painting straight out of an art gallery in Venice Beach, California, it is in fact a satellite image of the sands and seaweed in the Bahamas.
The image was taken by the Enhanced Thematic Mapper plus (ETM+) instrument aboard the Landsat 7 satellite.
Tides and ocean currents in the Bahamas sculpted the sand and seaweed beds into these multicolored, fluted patterns in much the same way that winds sculpted the vast sand dunes in the Sahara Desert.
NASA picture acquired January 17, 2001

From NASA

Thirteen years ago, a satellite acquired this beautiful image (above) of light and sand playing off a portion of the ocean floor in the Bahamas.
The caption that accompanied the image didn’t include many details, only noting that the image was acquired by the Enhanced Thematic Mapper Plus (ETM+) sensor on Landsat 7 and that, “tides and ocean currents in the Bahamas sculpted the sand and seaweed beds into these multicolored, fluted patterns in much the same way that winds sculpted the vast sand dunes in the Sahara Desert.”


An image as beautiful as this seemed like it deserved a bit more explanation, so I  grabbed a recent (January 9, 2014) scene of the same area captured by the Moderate Resolution Imaging Spectroradiometer (MODIS) on the Aqua satellite.
That image (below) shows a much broader view of the area.
You can still see some details of the intricate network of dunes, but the MODIS image offers a much better sense of the regional geology.
For instance, you can easily see that the section of dunes shown in the first image (the white box in the lower image) is part of a much larger limestone platform called the Great Bahama Bank. Limestone is a sedimentary rock formed by the skeletal fragments of sea creatures, including corals and foraminifera, and this particular limestone platform has been accumulating since at least the Cretaceous Period.

You can also see a sharp division between the shallow (turquoise) waters of the Great Bahama Bank and the much deeper (dark blue) parts of the ocean.
The submarine canyon that separates Andros Island from Great Exuma Island is nearly cut off entirely from the ocean by the Grand Bahama Bank, but not quite.
A connection to deep waters to the north gives the trench the shape of a tongue, earning the feature the name “Tongue of the Ocean.”
At its lowest point, the floor of the Tongue of the Ocean is about 14,060 feet (4,285 meters) lower than Great Bahama Bank.
The shallowest (lightest) parts of the Grand Bahama Bank, in contrast, are just a few feet deep.

Wednesday, January 29, 2014

Climate change 'could be making fish smaller'


This visualization shows how global temperatures have risen from 1950 through the end of 2013.
2013 also marked the 37th consecutive year with a global temperature above the 20th century average.

From BBC

A decline in the length of fish in the North Sea could be linked to climate change, according to researchers at the University of Aberdeen.

 Shorter haddock could be linked to rising sea temperatures.
Picture: David Moir

Their findings suggest edthe maximum body length of fish including haddock, whiting, herring, plaice and sole has fallen by as much as 29% over 38 years.
They said that coincides with an increase in water temperatures of between 1C and 2C.

Food availability and fishing pressure was also assessed.
The team hopes the findings - published in Global Change Biology - will promote further research into the impacts of climate change on fish.


Dr Alan Baudron, research fellow at the university's School of Biological Sciences, said: "We used data collated by the International Council for the Exploration of the Sea reporting the age and length of commercial fish in the North Sea.
"Our analysis showed that the majority of species examined - specifically, haddock, whiting, herring, Norway pout, plaice and sole - experienced a synchronous reduction in their maximum length over the time period.
"What is interesting is that this was detected across a range of fish species eating different diets, living at different depths and experiencing different levels of fishing mortality.
"The synchronicity suggests that the one common factor they all experienced - increasing water temperatures - could have been at least partly responsible for the observed reductions in length.
"The timing of the reduction in maximum length coincided with years when water temperature in the North Sea increased."

He explained: "Our findings are consistent with current understanding of the physiology of fish. Because fish are cold-blooded animals their metabolic rates are determined by the ambient temperature.
"In general, fish grow more rapidly during their early life when temperatures are warmer. The consequence of rapid juvenile growth is that they become mature at a smaller length and therefore don't grow as large as they would have in colder waters.
"Other factors, such as food availability or fishing pressure, also contribute to variability in body length.
"However, we showed that it is less likely that these factors could explain the synchronous change in length observed across species."

Dr Coby Needle, of Marine Scotland Science, who collaborated in this study, added: "This study contributes important information to help us address the issue of how fish growth is changing through time and highlights the importance of considering environmental issues when managing fisheries."

Links :
  • Nature : Shrinking of fishes exacerbates impacts of global ocean changes on marine ecosystems 
  • The Guardian : Global warming continues and won't be stopped by wishful thinking

Tuesday, January 28, 2014

Court grants Peru ocean territory claimed by Chile

Chile's claim to rich fishing grounds in the Pacific Ocean, disputed by Peru,
was upheld by an international court which said that said the maritime border between the countries would be set by a straight line extending 80 nautical miles west from the point where their land borders meet - less than the 200 nautical miles Chile wanted.
Peru gets more ocean, Chile keeps fishing grounds

From The New York Times

A six-year maritime dispute between Chile and Peru was settled on Monday when the International Court of Justice in The Hague ruled largely in favor of Peru, stripping Chile of economic rights over a swath of the Pacific Ocean.

Off the coast of Arica, a city on the border with Peru, the court set the boundary at 80 miles.
Beyond that, it drew a diagonal line southwest, slicing about 8,000 square miles of ocean from Chile’s “exclusive economic zone.”

 Maritime boundaries in Southamerican western coast,
showing Peruvian and Chilean claims to the ICJ.
The International Court of Justice (ICJ) issued its much-anticipated decision on the maritime dispute brought by Peru against Chile.
In its claim, Peru argued that no agreed maritime boundary existed between Peru and Chile, and asked the Court to "plot a boundary line using the equidistance method in order to achieve an equitable result."
Given the shape of the respective coastlines up to their land border, application of the equidistance method would have given Peru a maritime zone that essentially ran at a southwest diagonal from the land boundary.
News reports suggest that the fishing rights impacted by the decision constitute a $200 million dollar industry, including some of the richest anchoveta (anchovy) fisheries in the world.

For Peru and Chile, the case implicated a history of bad feelings on both sides dating to a war in the 19th century and various treaties and agreements since that time.
It stood the chance of destabilizing the ever-closer partnership developing between the two countries, and political leaders on both sides were summoning the highest level meetings and taking other steps in preparing for public reactions to the case, which has been headline news in both countries for weeks.

Although the decision, which cannot be appealed, was considered more likely to affect industrial fishing, hundreds of Arica fishermen and residents marched through the city waving black flags and Chilean flags, complaining about the loss of access to resources beyond the 80-mile point.
Local fishing associations had already said they would seek compensation from the Chilean government if the ruling deprived them of their livelihood.

 The Hague-based International Court of Justice awarded more than half the disputed 38,000-square-kilometer patch of ocean to Peru, but Chile got the bulk of the valuable coastal fishing grounds.
A Peruvian fishing association had estimated the value of fishing in the entire disputed area at $200 million a year.

Chile lost special rights to marine resources in about 8,000 square miles of ocean near its northern border, but retained control over its 12-mile territorial waters, where most small-scale fishing activity takes place.
The president of Peru, Ollanta Humala, said the ruling granted Peru most of what it had wanted.

In August 2010, the Ecuadorian government issued a nautical chart in which fixed its maritime boundary with Peru based on treaties 1952 and 1954 that Peru considered insufficient fisheries treaty to define the borders with Chile, so he sued this country before the International Court of Justice in the Hague.


In a televised address, Chile’s president, Sebastián Piñera, whose term ends in March, said Chile disagreed with the court’s reducing the boundary to 80 miles off Arica but would respect the ruling. He added that it would have to be “implemented gradually,” and that giving up part of the economic zone was “an unfortunate loss for the country.”

 Peru-Bolivia Boundary in Atacama Desert
according to Mapa del antiguo Departamento de Moquegua, hacia 1865. 
Paz Soldan. Geografia del Peru.

The dispute was a legacy of the War of the Pacific, which lasted from 1879 to 1883.
Chile won, conquering Peruvian territory and depriving Bolivia of a coastline.
A treaty between Peru and Chile in 1929 granted Chile control of Arica, and the countries later fixed a land boundary.
The maritime boundary, however, was never fully defined.

 Date February 14, 1879 – October 20, 1883 (Chile-Peru Peace) Bolivia-Chile armistice in 1884; peace with Bolivia signed October 20, 1904
Location Peru and Bolivia in Pacific coast of South America
Result Chilean victory, Bolivia became a landlocked country
Territorial
changes
In 2008, Peru, under President Alan García, took Chile to the World Court. (doc)
Peru’s proposal would have allowed it to project a 200-mile maritime zone across waters that Chile considered high seas, giving Peru an additional 15,000 square miles.

From the ICJ.

Chile argued that the border had been clearly established by fishing treaties signed by Chile, Peru and Ecuador in 1952 and 1954; by subsequent agreements; and by customary practice and the unilateral actions of Peru.

 The new maritime border between Chile and Peru as declared by the ICJ.
From the ICJ.

The court settled on a compromise, recognizing that while the treaties had not expressly established the maritime boundary, the 1954 document had “cemented” a “tacit agreement.”
Through fishing activities, enforcement and other practices based on those treaties and subsequent agreements, the court said, both countries had acknowledged a maritime border running 80 miles from the coast along a line of latitude.


 A map juxtaposing Peruvian and Chilean claims, with the new ICJ border shown in black.
The Court first had to determine whether there was an agreed maritime boundary between Chile and Peru. It concluded, based on the 1947 Proclamations of Chile and Peru, the 1952 Santiago Declaration and various 1954 Agreements, that the parties had agreed to an all-purpose maritime boundary.
In terms of the extent of that boundary, the Court relied primarily on the historical practice of the parties, which largely involved the exercise of fishing rights by "small fishing boats" of each nation.
The Court concluded that the agreed boundary extended to 80 nautical miles from the agreed land boundary, along a parallel.
This point was marked as "Point A" by the Court.
To determine the boundary from Point A seaward, the Court proceeded on the basis of the Articles 74 and 83 of the UN Law of the Sea Convention ("UNCLOS") to apply its usual three-stage methodology: (1) "to construct a provisional equidistance line unless there are compelling reasons preventing that"; (2) to "consider whether there are relevant circumstances which may call for an adjustment of that line to achieve an equitable result"; and (3) "to conduct a proportionality test to assess whether the effect of the line, as adjusted, is such that the Parties respective shares of the relevant area are markedly disproportionate to the lengths of their relevant coasts."
The Court, consistent with practice and UNCLOS, then drew a diagonal from Point A heading in a south-westerly direction a further 120 nautical miles until it reached "the 200-nautical mile limit measured from the Chilean baselines (Point B)."

At that point, there was a short, further extension of the boundary to a Point C, to where the 200-nautical mile limits of both parties intersected.

Still, Chilean officials said they were confused by the court’s reasoning in setting the boundary at 80 miles off Arica.
“We still don’t understand the arguments of the court for reducing the extension of the parallel,” said Mario Artaza, a former Foreign Ministry official and diplomat.
“However, Chile lost relatively little compared to what Peru was demanding.”
The ruling, Mr. Artaza added, “offers the opportunity to begin a new stage in our relationship.”

 Map showing Peru's territory gains, highlighted in yellow.
Peru had sought a sea border perpendicular to the coast, heading roughly southwest.
Chile insisted the border extend parallel to the equator.
The court, whose rulings cannot be appealed, compromised by saying a border already existed parallel to the equator extending 80 nautical miles from the coast.

From there, it drew a line southwest to where the countries' 200-mile territorial waters end. 
Note : the area remaining in Chilean hands "is where the Chilean boats fish the most."
In sum, the decision gave both parties something, and by doing so, calmed a potentially incendiary situation.
The Court sided with Chile in enforcing the first 80 miles of the boundary on a line parallel to the equator.
Thus, Chile preserves some of the most productive fishing grounds it might otherwise have lost. However, the Court agreed with Peru in setting a maritime boundary that extends from the 80-nautical mile point along a line that is equidistant from both countries' coasts.
This opens a considerable portion of formerly Chilean fishing waters to Peru.
As a general matter, pragmatism won the day.
What is significant here is the Court's reliance on the practice of the parties in the "pre-200 nautical" mile era, and its willingness to reach an overall pragmatic conclusion by extending the boundary invoking more recent custom as well as UNCLOS (i.e., use of an equidistant line based on the shape of coastlines rather than running along a parallel).
Other international disputes, particularly between Chile and Bolivia, remain unsolved and pending before the ICJ, and this decision suggests that the current members of the Court will continue to look carefully at actual treaties, agreements, and practices between the parties and may be expected to reach decisions that are not significantly disruptive of that history and practice.

Links :

Monday, January 27, 2014

Science of big waves


The world's best surfers are gearing up for Mavericks International, an elite surf competition that pits big-wave riders against the monster swells at a Northern California Beach.
The competition happens every year in the winter at Pillar Point in Half Moon Bay, Calif., at a time when the waves and weather align.
When the forecast looks good, surfers have just 48-hours to make it to the competition.

Big-wave surfers competing in the Mavericks Invitational can thank Mother Nature for producing 40-foot-high breakers -- and the forecaster who predicted the perfect surf was on its way to Half Moon Bay.
The huge waves are part of the same weather pattern responsible for California's severe drought.
(other video)

Waves this year are forecast to reach up to 40 feet (12 meters) tall, with the peaks coming every 18 to 19 seconds, SFGate Reported.
The biggest waves at the competition can sometimes reach 70 feet (21 m) high.

But just why do the waves get so big at this particular time and spot?
[In Photos: Famous Surf Spots Around the World]

Winter storms thousands of miles away over the Pacific Ocean near Alaska provide the energy.
There, a low-pressure front from the north collides with a high-pressure front from the south.
The resulting pressure differential generates strong, fast winds that blow over a vast area of ocean for long periods of time.
This wind energy then transfers to the ocean, where it creates big swells.


The tides also play a role in Maverick's monster waves.
During the transition from high to low tide, wave energy roiling the ocean reaches the seafloor.
This energy has nowhere to go but up, increasing the wave's height, according to Bay Nature, a San Francisco-area magazine.

The Weather Channel Storm Surge Expert Michael Lowry explains
the secret behind the huge waves in Northern California's "Mavericks.

But the real magic comes from Half Moon Bay's bizarre geometry.
After all, the beaches nearby don't get the same massive waves.
The crests at Pillar Point, by contrast, can get so big that they register on seismographs miles away.
In 2007, researchers from California State University at Monterey Bay and the National Oceanic and Atmospheric Administration used sound waves to create contour maps of the ocean floor near the competition.
These maps show a ramp that rises sharply, but drops steeply off on either side, creating what the surfers call a launching pad.
When waves come from the right direction, the big ones touch the ocean floor and slow down, then curve into a 'v' that focuses the wave's energy.
With its energy thus focused, the wave quickly jumps in height, and the Big Kahuna is born, KQED's Quest reported.

Links :

Sunday, January 26, 2014

Underwater time-lapse shows secret life of a coral reef

Other videos on coraltimelapse

From BBC

Australia's Great Barrier Reef - the world's largest living organism - has been entrancing divers with its vivid colours and curious lifeforms for centuries.

But for one man, the glimpses he caught under water were not enough - he wanted to see more of the life hidden from most people.

Using time-lapse photography, Dr Pim Bongaerts of University of Queensland's Global Change Institute has spent the past five years documenting the movement, communication and even violent interactions that living corals engage in.

It is all behaviour that is part of the life cycle of a coral reef, but happens too slowly for us to see.

Dr Bongaerts shared some of his remarkable time-lapse footage exclusively with the BBC, and revealed some of the underwater mysteries that it has brought to life.