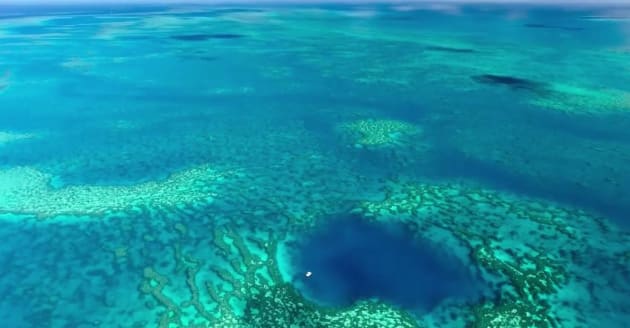
According to new satellite imagery of the area, a giant blue hole was
recently discovered within Australia's Great Barrier Reef.
Marine
biologist Johnny Gaskell who has since explored the spot, said,
"What we
found inside was hard to believe considering 5 months ago a Category 4
cyclone went straight over the top of it."
According to Gaskell,
pristine colonies of giant birdsnest corals and extremely long Staghorn
corals found in the "blue hole," were completely unaffected by Cyclone
Debbie, which slammed into the region as a Category 4 storm back in late
March.
Blue Hole mission in the Great Barrier Reef.
This Blue Hole has previously been explored and documented by geologists who suggested it could be even older than the famous Great Blue Hole, in Belize.
It's location is in one of the least explored parts Great Barrier Reef, over 200km from our home @daydreamislandresort.
Gaskell began searching for blue holes in March last year after Cyclone Debbie hit, in hope of finding coral that was spared from the storm.
The high walls that line the sinkholes tend to preserve what lies below from damaging weather. Large hurricanes can be particularly dangerous for corals, as they are smashed by swells.
The blue hole that Gaskell spotted on Google Maps was in a remote location, nearly 190 kilometres away from the nearest island.
While the specific blue hole had been previously identified, its remoteness made it difficult to access and little was known about it.
Gaskell was able to finally confirm that it was a blue hole during the diving expedition in September.
The majority of blue holes are formed from sinkholes or caves that develop slowly over time, as rock begins to erode and collapse.
Many of the world’s blue holes formed during the last Ice Age, after sea levels rose and filled existing sinkholes with water.
The term blue hole simply comes from the dark, navy waters that characterise the formations, often creating a striking contrast with the turquoise that surrounds them.
“This Blue Hole has previously been explored and documented by geologists who suggested it could be even older than the famous Great Blue Hole, in Belize." pictures : Johnny Gaskell
To get there we had to travel overnight for 10 hours and time the tides perfectly...
Was well worth it! Inside the walls was similar to the site we explored a few weeks back, but this hole was deeper and almost perfectly circular.
We dived down to just over 20m yesterday, before hitting bare sediment, that slowly sloped towards the centre.
Again it was great to see big healthy coral colonies.
“Due to the sediment build-up over thousands of years, blue holes can be like time capsules for the ocean,” Gaskell said.
We call it 'The Crack'....
Up there with the most ultimate
snorkels I've ever done...
“At around 15 to 20 meters deep, there were huge Birdsnest Corals (Seriatopora) and super elongated Staghorn Corals (Acropora), both of which were among the biggest and most delicate colonies I’ve ever seen,” Mr Gaskell said.
After diving the Blue Hole over the weekend,
we decided to move sites and check out what looked like a huge crack in
the reef
Open to the ocean at one end, and closed in by Reef at the
other.
The total length was over a 1Km long, about 50m wide and the
depth is still unknown.
The strong current along the walls meant we had
to drift the whole way.
This video doesn't do the site justice as most
of the bigger inhabitants were not keen to come close. Only filmed fish
and corals at the top on the edges.
Freediving into the depths we saw
Grey Reef Sharks, Whitetip Reef sharks, Maori Wrasse, a Tawny Nurse and a
3m Lemon shark.
Seeing a huge school of Humpnose Unicornfish was
definitely my highlight.
Counted over 100 in one photo.
Want to know exactly where it is? Sorry, it's still a secret.
The blue hole sits in the heart of the Great Barrier Reef off the Whitsunday Coast. “Its location is in one of the least explored parts Great Barrier Reef, over 200 km from Daydream Island. " Gaskell however, hasn't revealed the exact location of his discovery, so it remains a new and local secret... "Hopefully it will be left alone. An influx of divers would severely damage the coral colonies, as they are more delicate than usual."
Picture : nautical charts (Australia AHS) overlaid upon Google Maps imagery in the GeoGarage platform webmapping.
It's a long way
offshore this spot, but hopefully we'll get back there one day.
The
Crack...
Example of another Blue Hole in the GBR found in the GeoGarage platform ? There are a couple of known blue holes in Australia but they are quite unexplored and due to the sheer size of the Great Barrier Reef, its certain that more are out there. Wonky Hole is 80 metres (262 feet) deep and an amazing dive teaming with sea life and covered in whip coral and gorgonians. The Barrier Star is another hole dropping to 90 metres (295 feet) with an overhang at the sandy bottom and an abundance of reef life and coral.
Gaskell plans to continue looking for and surveying blue holes in the Great Barrier Reef.
“Some of these sites have had scientists explore them in the past, but due to the remote offshore location, there are still parts of the Great Barrier Reef that remain a mystery,” he said.
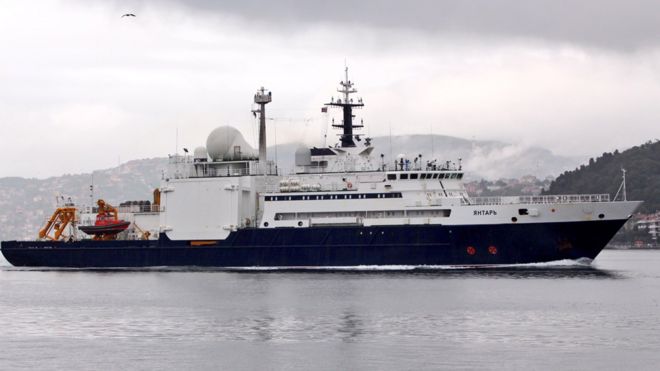
Enter the Yantar, officially an oceanographic research vessel, but actually bristling with surveillance equipment, and the mother ship for manned and unmanned deep-sea submersibles.
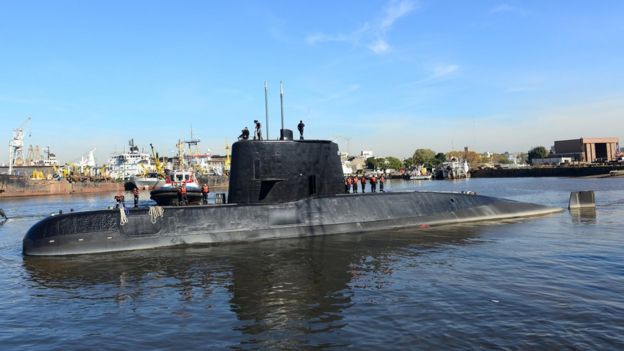
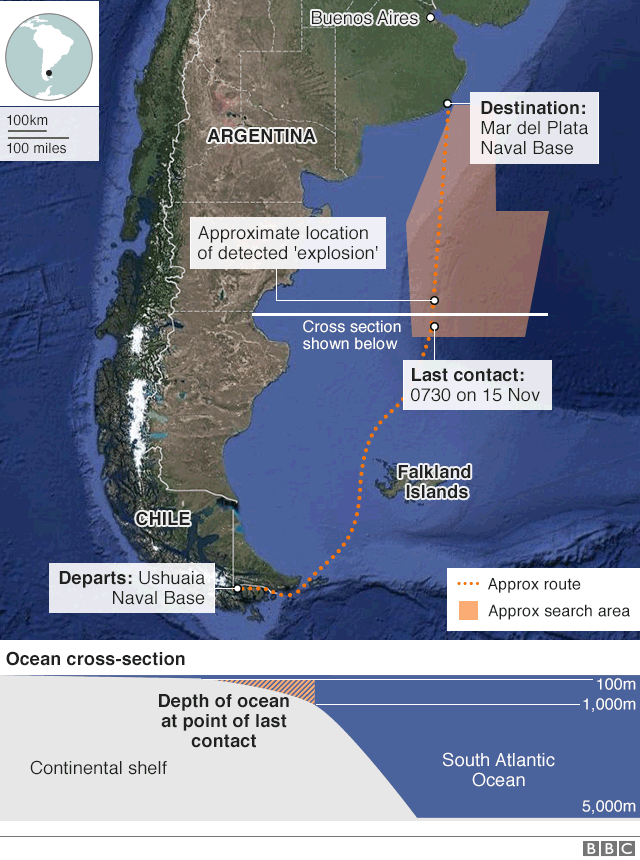
A Russian ROV - remotely operated underwater vehicle - is scouring the ocean floor off Argentina.
The disappearance of the ARA San Juan remains a mystery
photo Reuters
But what else has the Yantar (Russian for "amber") been up to?
The Yantar is capable of tampering with them, says Igor Sutyagin, a London-based expert on the Russian military.
But there is no evidence that it has done so.
"It's difficult to tap into optical fibres - it's just light inside, not electrical data," he told the BBC.
"It would be easier just to cut the cable."
A news report from the Russian parliament says the Yantar can do just such clandestine work, using deep-diving submersibles.
"The Yantar has equipment designed for deep-sea tracking, and devices that can connect to top-secret communications cables," said Parlamentskaya Gazeta (in Russian) last October.
Mr Sutyagin, of the Royal United Services Institute, says the Yantar belongs to Russia's Main Directorate of Underwater Research (GUGI in Russian), part of the defence ministry.
The 108m-long (354ft) vessel has a crew of 60 and went into service in 2015.
It was built in the Baltic port of Kaliningrad, the first in a series called Project 22010.
A second, called Almaz, will soon be on its way to the navy.
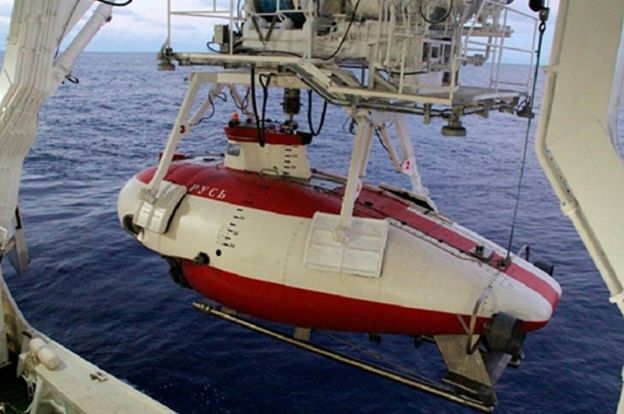
The Yantar can deploy the three-man submersibles Rus and Konsul, which can dive to about 6,000m (20,000ft).
The Rus submersible has a crew of three and dived to 6,180m in the Atlantic
The Rus submersible has a crew of three and dived to 6,180m in the Atlantic
photo Russian Defence Ministry
Spying on the US
The Russian parliamentary report noted that in the summer of 2015 the Yantar had deployed near the US Kings Bay naval base in Georgia.
"According to Pentagon officials, the Russians were gathering intelligence on US submarines' equipment, including underwater sensors in the DoDIN network," the Russian report said.
Mr Sutyagin said the US underwater sensors near Kings Bay would be interesting for the Russian military, which might wish to copy the US technology.
In late 2016 the Yantar was found to be loitering over undersea communications cables off the Syrian coast, including some links to Europe.
The Yantar's frequent stops at points along a cable route suggested that a submersible was examining the sea floor, the report said.
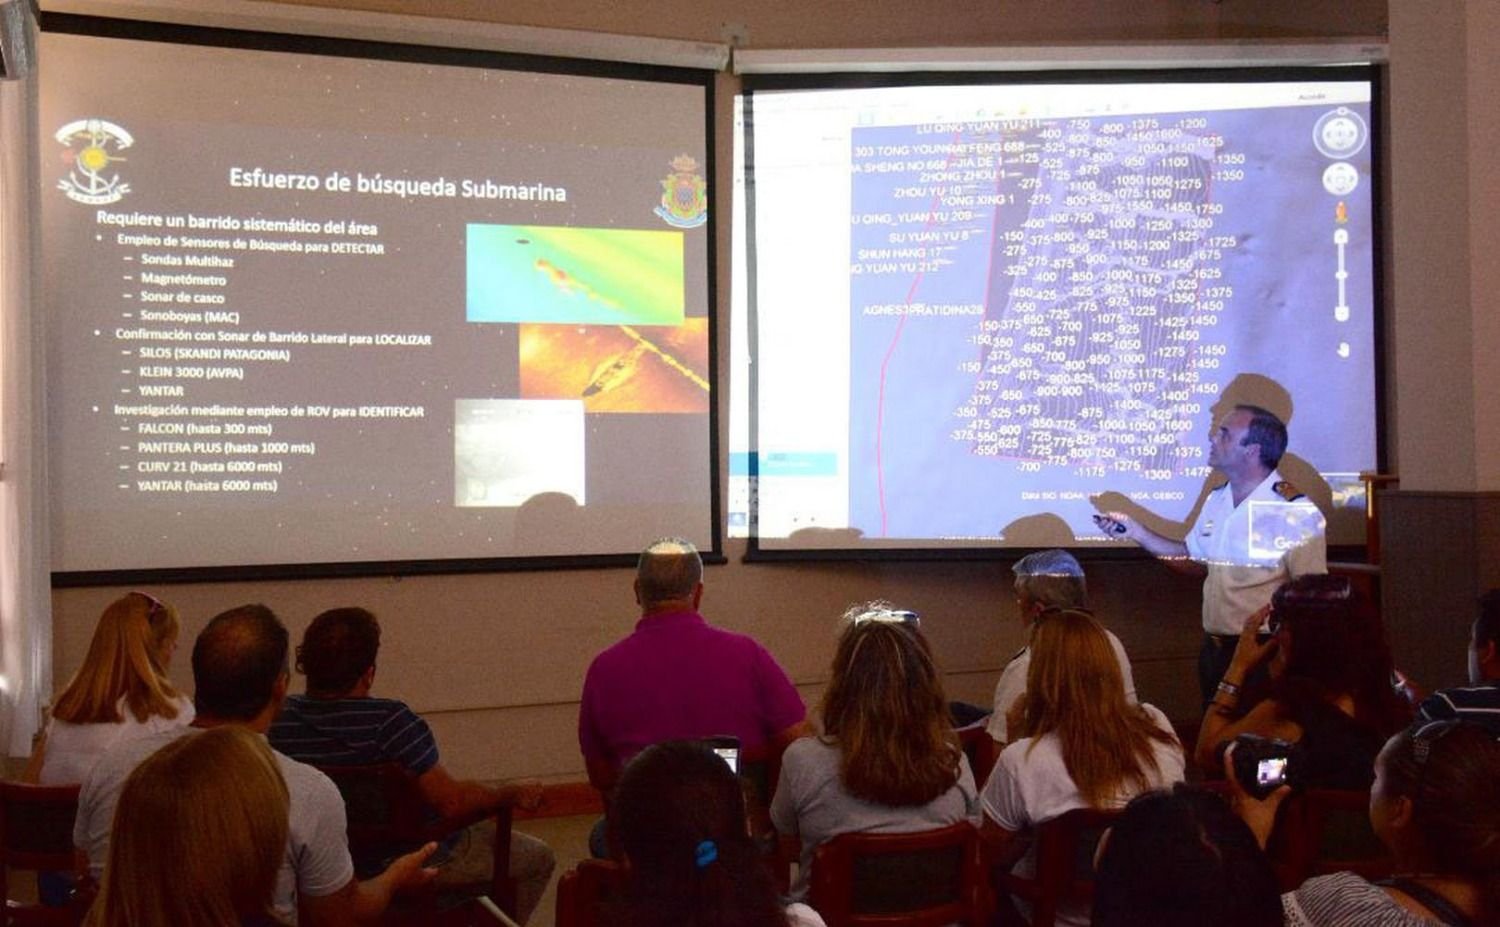
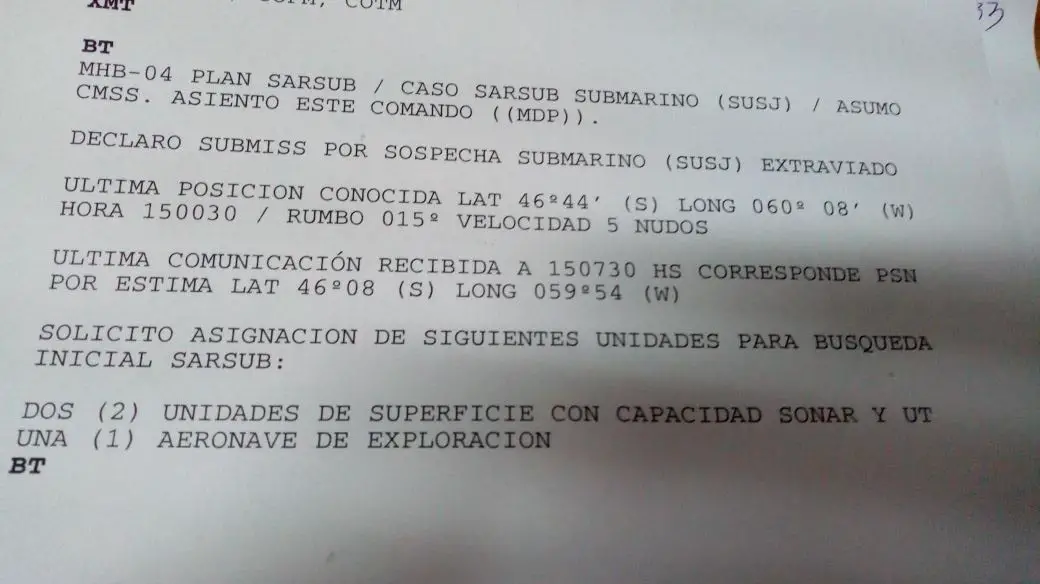
According to Argentina's Navy document, the last known position of the ship on November 15 was 46°44 ‘ south, 59°54’ west. Mystery of ARA San Juan
Search and rescue
Besides the Argentina mission, the Yantar has been used previously for search and recovery.
The Russian parliamentary report said the ship had located two Russian fighter jets - a Su-33 and a MiG-29 - that crashed into the Mediterranean in 2016, during the Syria war.
The Yantar "recovered secret equipment from the planes in good time", the report said.
That could be secret radar or missile data, or the "identification, friend or foe" system, Mr Sutyagin said.
In 2000 a ship like the Yantar might have saved some Kursk sailors' lives and literally salvaged the Russian navy's reputation.
Satellite data enables scientists to map the seafloor, which is sinking under the weight of rising seas. (This map shows gravity anomalies in the western Indian Ocean.) Credit: NASA Earth Observatory
The bottom of the ocean is more of a "sunken place" than it used to be.
In recent decades, melting ice sheets and glaciers driven by climate change are swelling Earth's oceans.
And along with all that water comes an unexpected consequence — the weight of the additional liquid is pressing down on the seafloor, causing it to sink.
Modeled barystatic contributions and definition of the individual ocean basins.
(a) Time series of the modeled barystatic sea level changes from each individual process and their sum. The shaded areas show the 1σ confidence interval.
b) Definition of each ocean basin. The dots show the tide gauge locations, and the color the basin to which each tide gauge is linked. The black lines show the upper and lower bounds of the altimetry domain.
Consequently, measurements and predictions of sea-level rise may have been incorrect since 1993, underestimating the growing volume of water in the oceans due to the receding bottom, according to a new study.
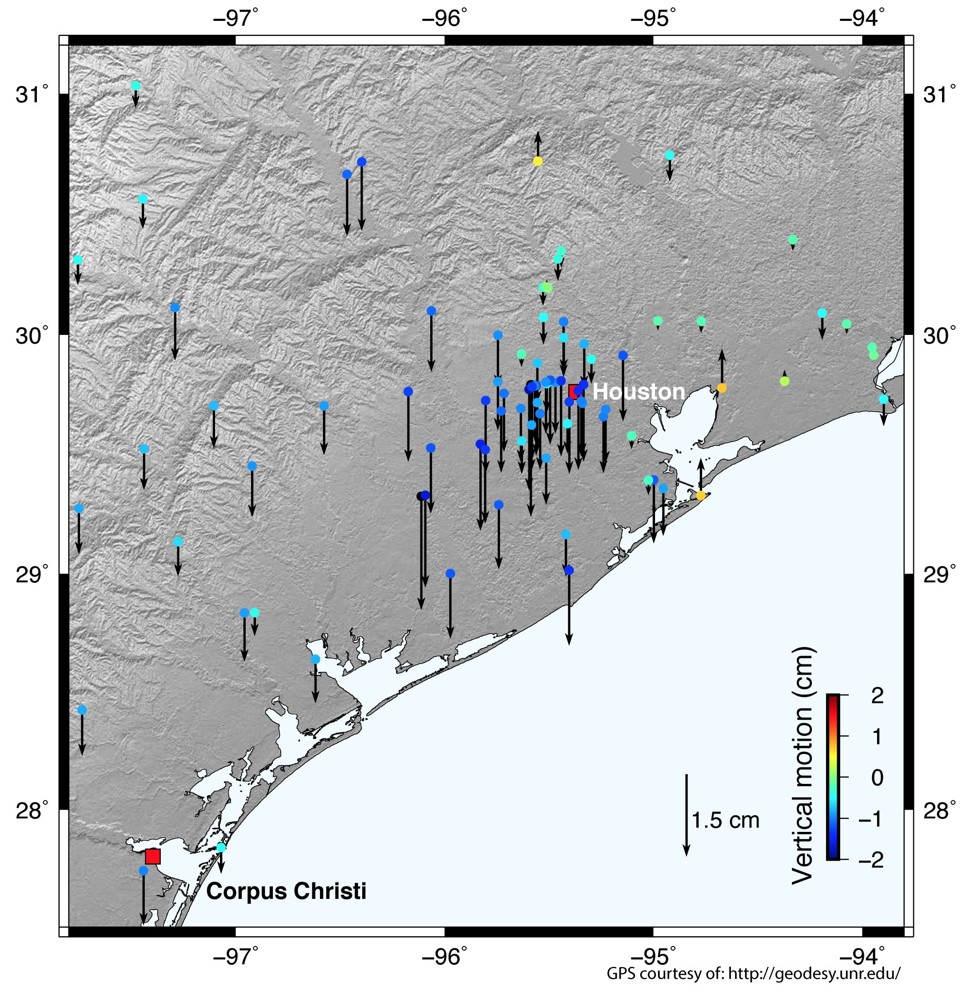
The 275 trillion pounds of water from Hurricane Harvey deformed the ground in Texas.
The weight of Harvey's water pushed Houston down
Scientists have long known that Earth's crust, or outer layer, is elastic: Earlier research revealed how Earth's surface warps in response to tidal movements that redistribute masses of water; and 2017's Hurricane Harvey dumped so much water on Texas that the ground dropped 0.8 inches (2 centimeters), the Atlantic reported.
Linear trends and accompanying 1σ confidence intervals resulting from ice mass and LWS changes over 1993–2014 in (a) solid Earth deformation over the oceans, (b) relative sea level, and (c) geocentric sea level.
Note that geocentric sea level change is equivalent to the sum of relative sea level and ocean bottom deformation change.
The blue line depicts the line where local sea level change is equal to the ocean mean sea level trend, whose value is written in blue under each map.
In the new investigation, researchers looked at more long-term impacts to the seafloor.
They evaluated how much the shape of the ocean bottom may have changed between 1993 and 2014, taking into account the amount of water added to the ocean from liquid formerly locked up on land as ice.
Previous research into seafloor stretching had omitted that extra water, the scientists wrote in the study.
To do that, they reviewed approximations of mass loss on land, as ice melted and drained into the oceans, and compared that to estimates of sea volume changes.
They found that around the world for two decades, ocean basins deformed an average of 0.004 inches (0.1 millimeter) per year, with a total deformation of 0.08 inches (2 mm).
However, there were distinct regional patterns to the seafloor's bending and stretching, and the amount of sag in certain parts of the ocean bottom could be significantly higher — as much as 0.04 inches (1 mm) per year in the Arctic Ocean, for a total of 0.8 inches (20 mm), the study authors reported.
Basin-averaged and global mean effects of present-day mass redistribution on observed relative and geocentric sea level change.
The solid line represents the average spatial signal over each region.
The dashed line (“TG rec”) represents tide gauge reconstructions based on the virtual station method using the locations of the 627 PSMSL tide gauges.
The altimetry domain consists of the global oceans, bounded by ±66∘ latitude.
For the virtual station estimate of the altimetry domain, all regions except the Arctic Ocean region are used.
As a result, satellite assessments of sea-level change — which don't account for a sinking ocean bottom — could be underestimating the amount that seas are rising by 8 percent, according to the study.
The accuracy of future sea-level estimates could be notably improved if the sinking of the ocean floor were incorporated into the calculations, "either based on modeled estimates of ocean mass change, as was done in this study, or using more direct observations," the scientists concluded.
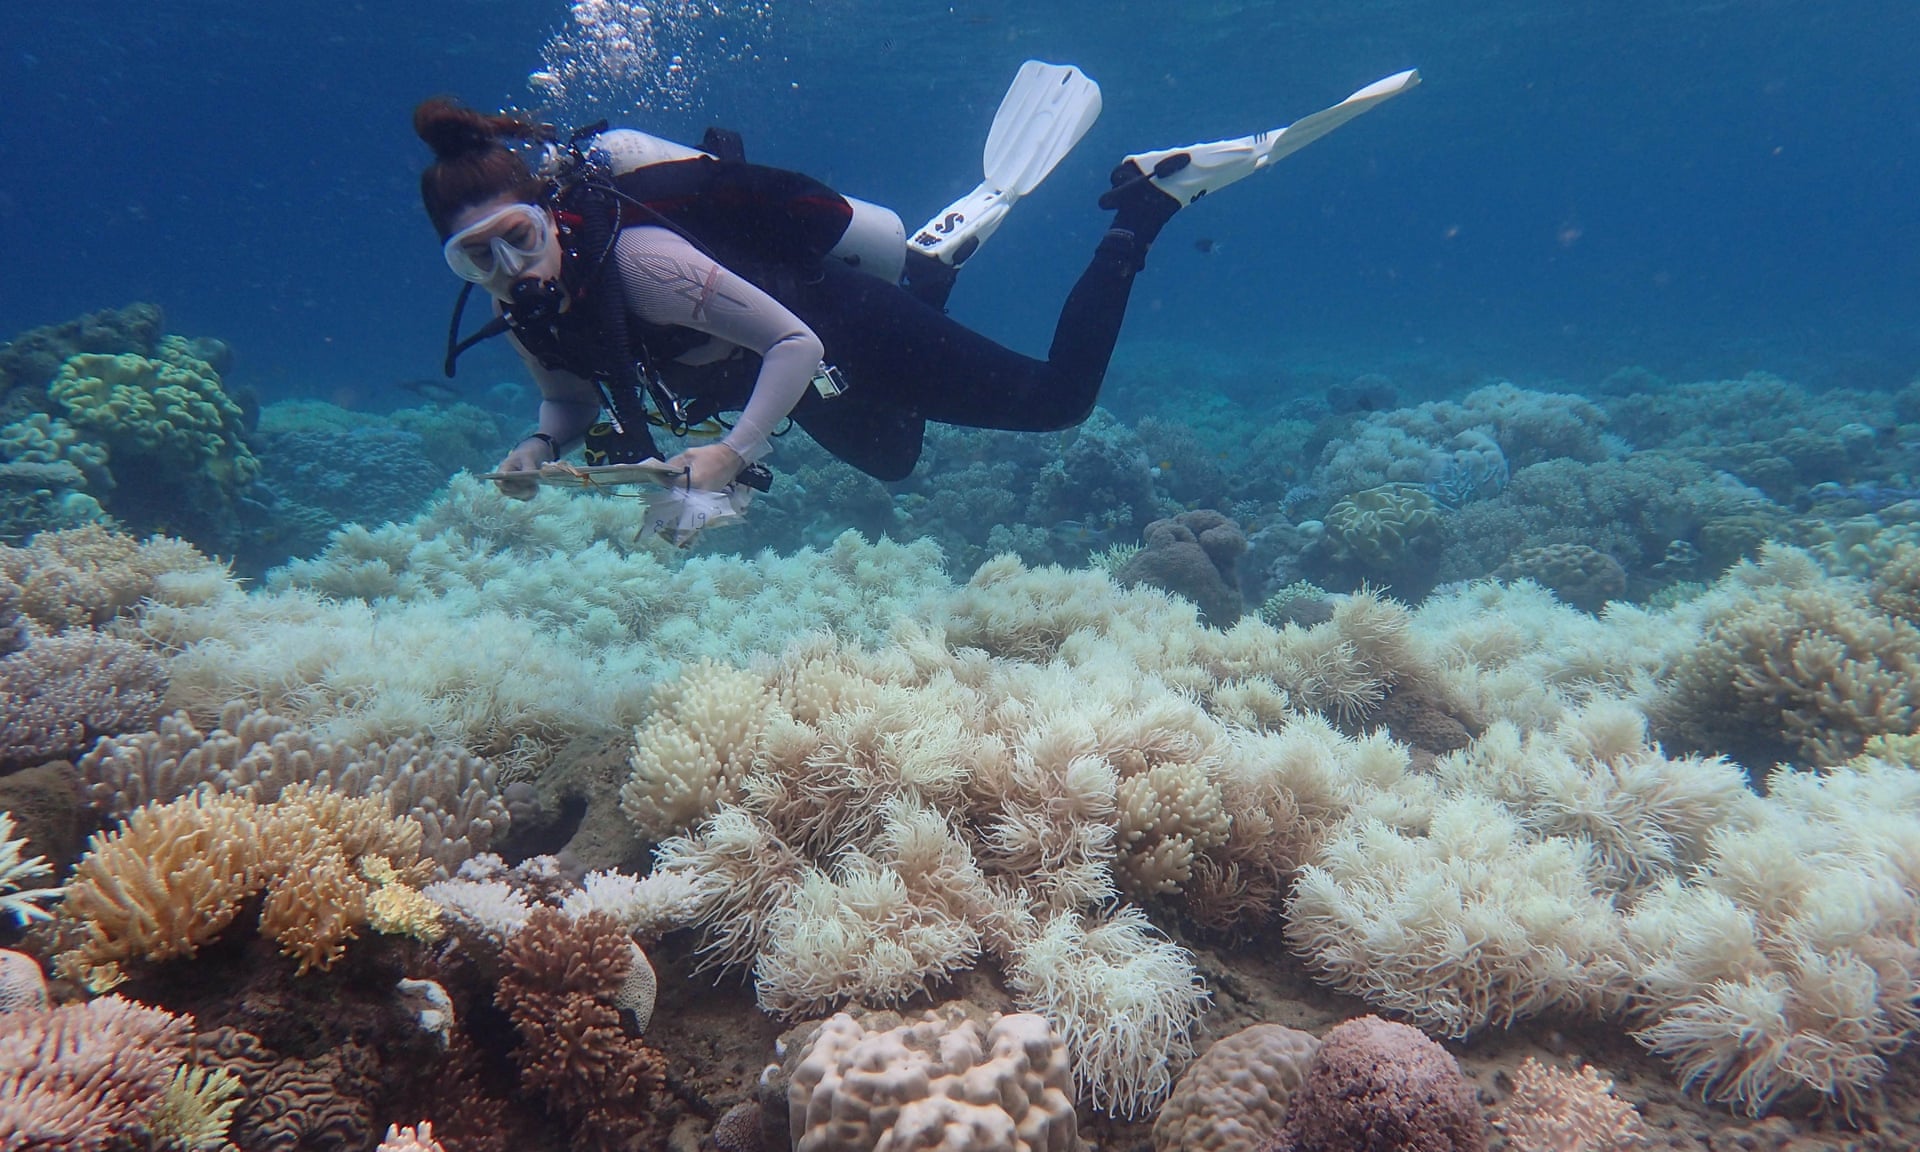
Study of 100 tropical reef locations finds time between bleaching events has shrunk and is too short for full recovery
Repeated large-scale coral bleaching events are the new normal thanks to global warming, a team of international scientists has found.
In a study published in the journal Science, the researchers revealed a “dramatic shortening” of the time between bleaching events was “threatening the future existence of these iconic ecosystems and the livelihoods of many millions of people”.
Did you know there’s coral in Scottish waters? Discover how a barren seabed transformed into a vibrant seascape
The study examined 100 tropical reef locations across the world, analysing existing data on coral bleaching events as well as new field research conducted on the Great Barrier Reef after the longest and worst case of bleaching caused by climate change killed almost 25% of the coral.
“Before the 1980s, mass bleaching of corals was unheard of, even during strong El Niño conditions,” said lead author Prof Terry Hughes, director of the ARC Centre of Excellence for Coral Reef Studies. “Now repeated bouts of regional-scale bleaching and mass mortality of corals has become the new normal around the world as temperatures continue to rise.”
The study found that time between bleaching events had diminished five-fold in the past 30 to 40 years, and was now too short to allow for a full recovery and was approaching unsustainable levels.
While mass bleaching events used to occur about once every 27 years, by 2016 the median time between them had shrunk to 5.9 years.
Only six of the 100 sites had escaped bleaching.
“Our analysis indicates that we are already approaching a scenario in which every hot summer, with or without an El Niño event, has the potential to cause bleaching and mortality at a regional scale,” the paper said.
Globally, the annual risk of severe and moderate bleaching had increased by almost 4% a year since the 1980s, from an expected 8% of locations to 31% in 2016.
The Western Atlantic remained at highest risk but Australasia and the Middle East saw the strongest increases in risk of bleaching.
This video shows the intricate details of small coral polyps, which contract and expand after disturbances, in stunning 4K quality.
Friday’s paper also determined the link between El Niño and mass bleaching events has diminished as global warming continues.
Prior to the 1980s mass coral bleaching on a regional scale was “exceedingly rare or absent” and occurred in localised areas stretching tens of kilometres, not the hundreds of kilometres affected in recent times, the paper said.
These local bleaching events were largely caused by small-scale stressors like unusually hot or cold weather, freshwater inundation or sedimentation.
Then global warming increased the thermal stress of strong El Niño events, the paper said, widening the impact of individual bleaching events. Now, they are occurring at any time.
“Back in the 80s it was only during El Niño events that waters became hot enough to damage corals and induce them to bleach,” co-author Andrew Baird, a professor at James Cook University, told Guardian Australia.
“But now it’s 30, 40 years later and we’re seeing those temperatures in normal years.”
Baird said it was difficult to know if the current conditions were reversible but “the window to address it is diminishing”.
“It’s impossible to know if this is the end of coral reefs but it might be,” he said.
“We really need to get on top of climate change as soon as possible.”
The vaults of the largest coral sperm bank in the the work may one day hold the key to saving ocean life.
There have been several large-scale and devastating mass bleaching events in recent years.
The 2015-16 event affected 75% of the reefs studied by the researchers, who said it was comparable to the then unprecedented mass bleaching of 1997-98, when 74% were affected.
“Interestingly one of the first papers that effectively drew attention to the issue – back in 1999 – suggested that by 2016, 2017, 2020, we would be seeing bleaching annually,” Baird said.
“That’s pretty close to what’s happening unfortunately.
“Some of these earlier works were quite prescient in their prediction and unfortunately we didn’t pay enough attention back then.”
The study follows a discovery late last year that 3% of the Great Barrier Reef could facilitate recovery after bleaching – a finding the researchers at the time suggested was akin to a life-support system but small enough not to be taken for granted.
On Friday scientists announced that a major outbreak of coral-eating crown of thorns starfish had been found munching the Great Barrier Reef in December, prompting the Australian government to begin culling the spiky marine animals.
The predator starfish feeds on corals by spreading its stomach over them and using digestive enzymes to liquefy tissue.
“Each starfish eats about its body diameter a night, and so over time that mounts up very significantly,” Hugh Sweatman, a senior research scientist at the Australian Institute of Marine Science told ABC radio.
“A lot of coral will be lost,” he said.
The crown of thorns were found in plague proportions in the Swains reefs, at the southern edge of the Great Barrier Reef, by researchers from the Great Barrier Reef Marine Park Authority.
The authority already killed some starfish at Swains reefs in December and said it would mount another mission in January.
There have been four major crown of thorns outbreaks since the 1960s in the Great Barrier Reef but it recovered each time because there were always healthy populations of herbivorous fish. The outbreaks are usually triggered by extra nutrients in the water but the reason for the current outbreak was unclear, Sweatman said.
In the last three years Médecins Sans Frontières (MSF) has carried out nearly 400 search and rescue operations in the Mediterranean Sea.
Every year thousands of refugees, many fleeing from violence, war, persecution and poverty in Sub-Saharan Africa, drown while trying to reach Europe via the Mediterranean. MSF has saved thousands of other refugees from suffering the same fate.
The MSF Search and Rescue interactive map shows the locations of all of MSF's rescues in the Mediterranean since 2014.
The majority of these sea rescues have taken place off the coast of Libya.
The MSF says that "almost everyone rescued from this stretch of water has passed through Libya, where many of them have been exposed to alarming levels of violence and exploitation".
The project has released an interactive story map which allows you to view some of these migratory journeys on a map, while also learning about the individual experiences of the people who actually made the journeys.
Each of these individual journeys are mapped to show each stage of one refugee's migration from Africa to Europe.
'Back' and 'Next' buttons allow the user to follow each stage of the journey made by the interviewed refugees.
As the map updates the map side-panel also updates to provide information about the journey.
This information includes the first-hand experiences of the individual refugee and more general information about the conditions that refugees experience at the mapped locations.
15 Years: Fortress Europe is an animated map of migrant and refugee deaths in Europe over the last fifteen years.
The map uses data from the Migrant Files to show where and when migrants have died while trying to get to Europe, or while trying to move around the continent.
As the map plays through the fifteen years of data red markers are added to the map to show the location of each migrant death.
The map sidebar continually updates to show details about each migrant death and you can click on individual markers on the map to read more details about each of these deaths.
Since 2013 the Migrant Files has been maintaining a database of migrants who have died in Europe or on their way to Europe.
The database lists more than 30,000 people who have died trying to get to Europe since the year 2000.
An interactive map on the Migrant Files website shows that a large proportion of these deaths occur in the Mediterranean, particularly among migrants trying to cross from Libya & Tunisia to Italy.
The Silk team has also created an interactive map from the Migrants' Files data examining the number of migrant deaths in the Mediterranean.
Their map allows you to query the information about migrant deaths by year, location and cause of death.
If you click on a map marker on the Fatal Migration Incidents in the Mediterranean map you can read details about the mapped incident, including the number of casualties and the date of the incident.
The Migrant Map 2000-2015 is another interactive map of the Migrant Files data, visualizing the number of dead or missing migrants across Europe and Africa.
The map presents a truly shocking picture of the scale of this human tragedy.
You can select markers on the map to learn more about the individual cases reported and about the source of the information.
The map also includes an animated heat-map layer which helps to highlight some of the hot-spots for migrant deaths over the last six years.


