Wednesday, December 31, 2014

Tuesday, December 30, 2014
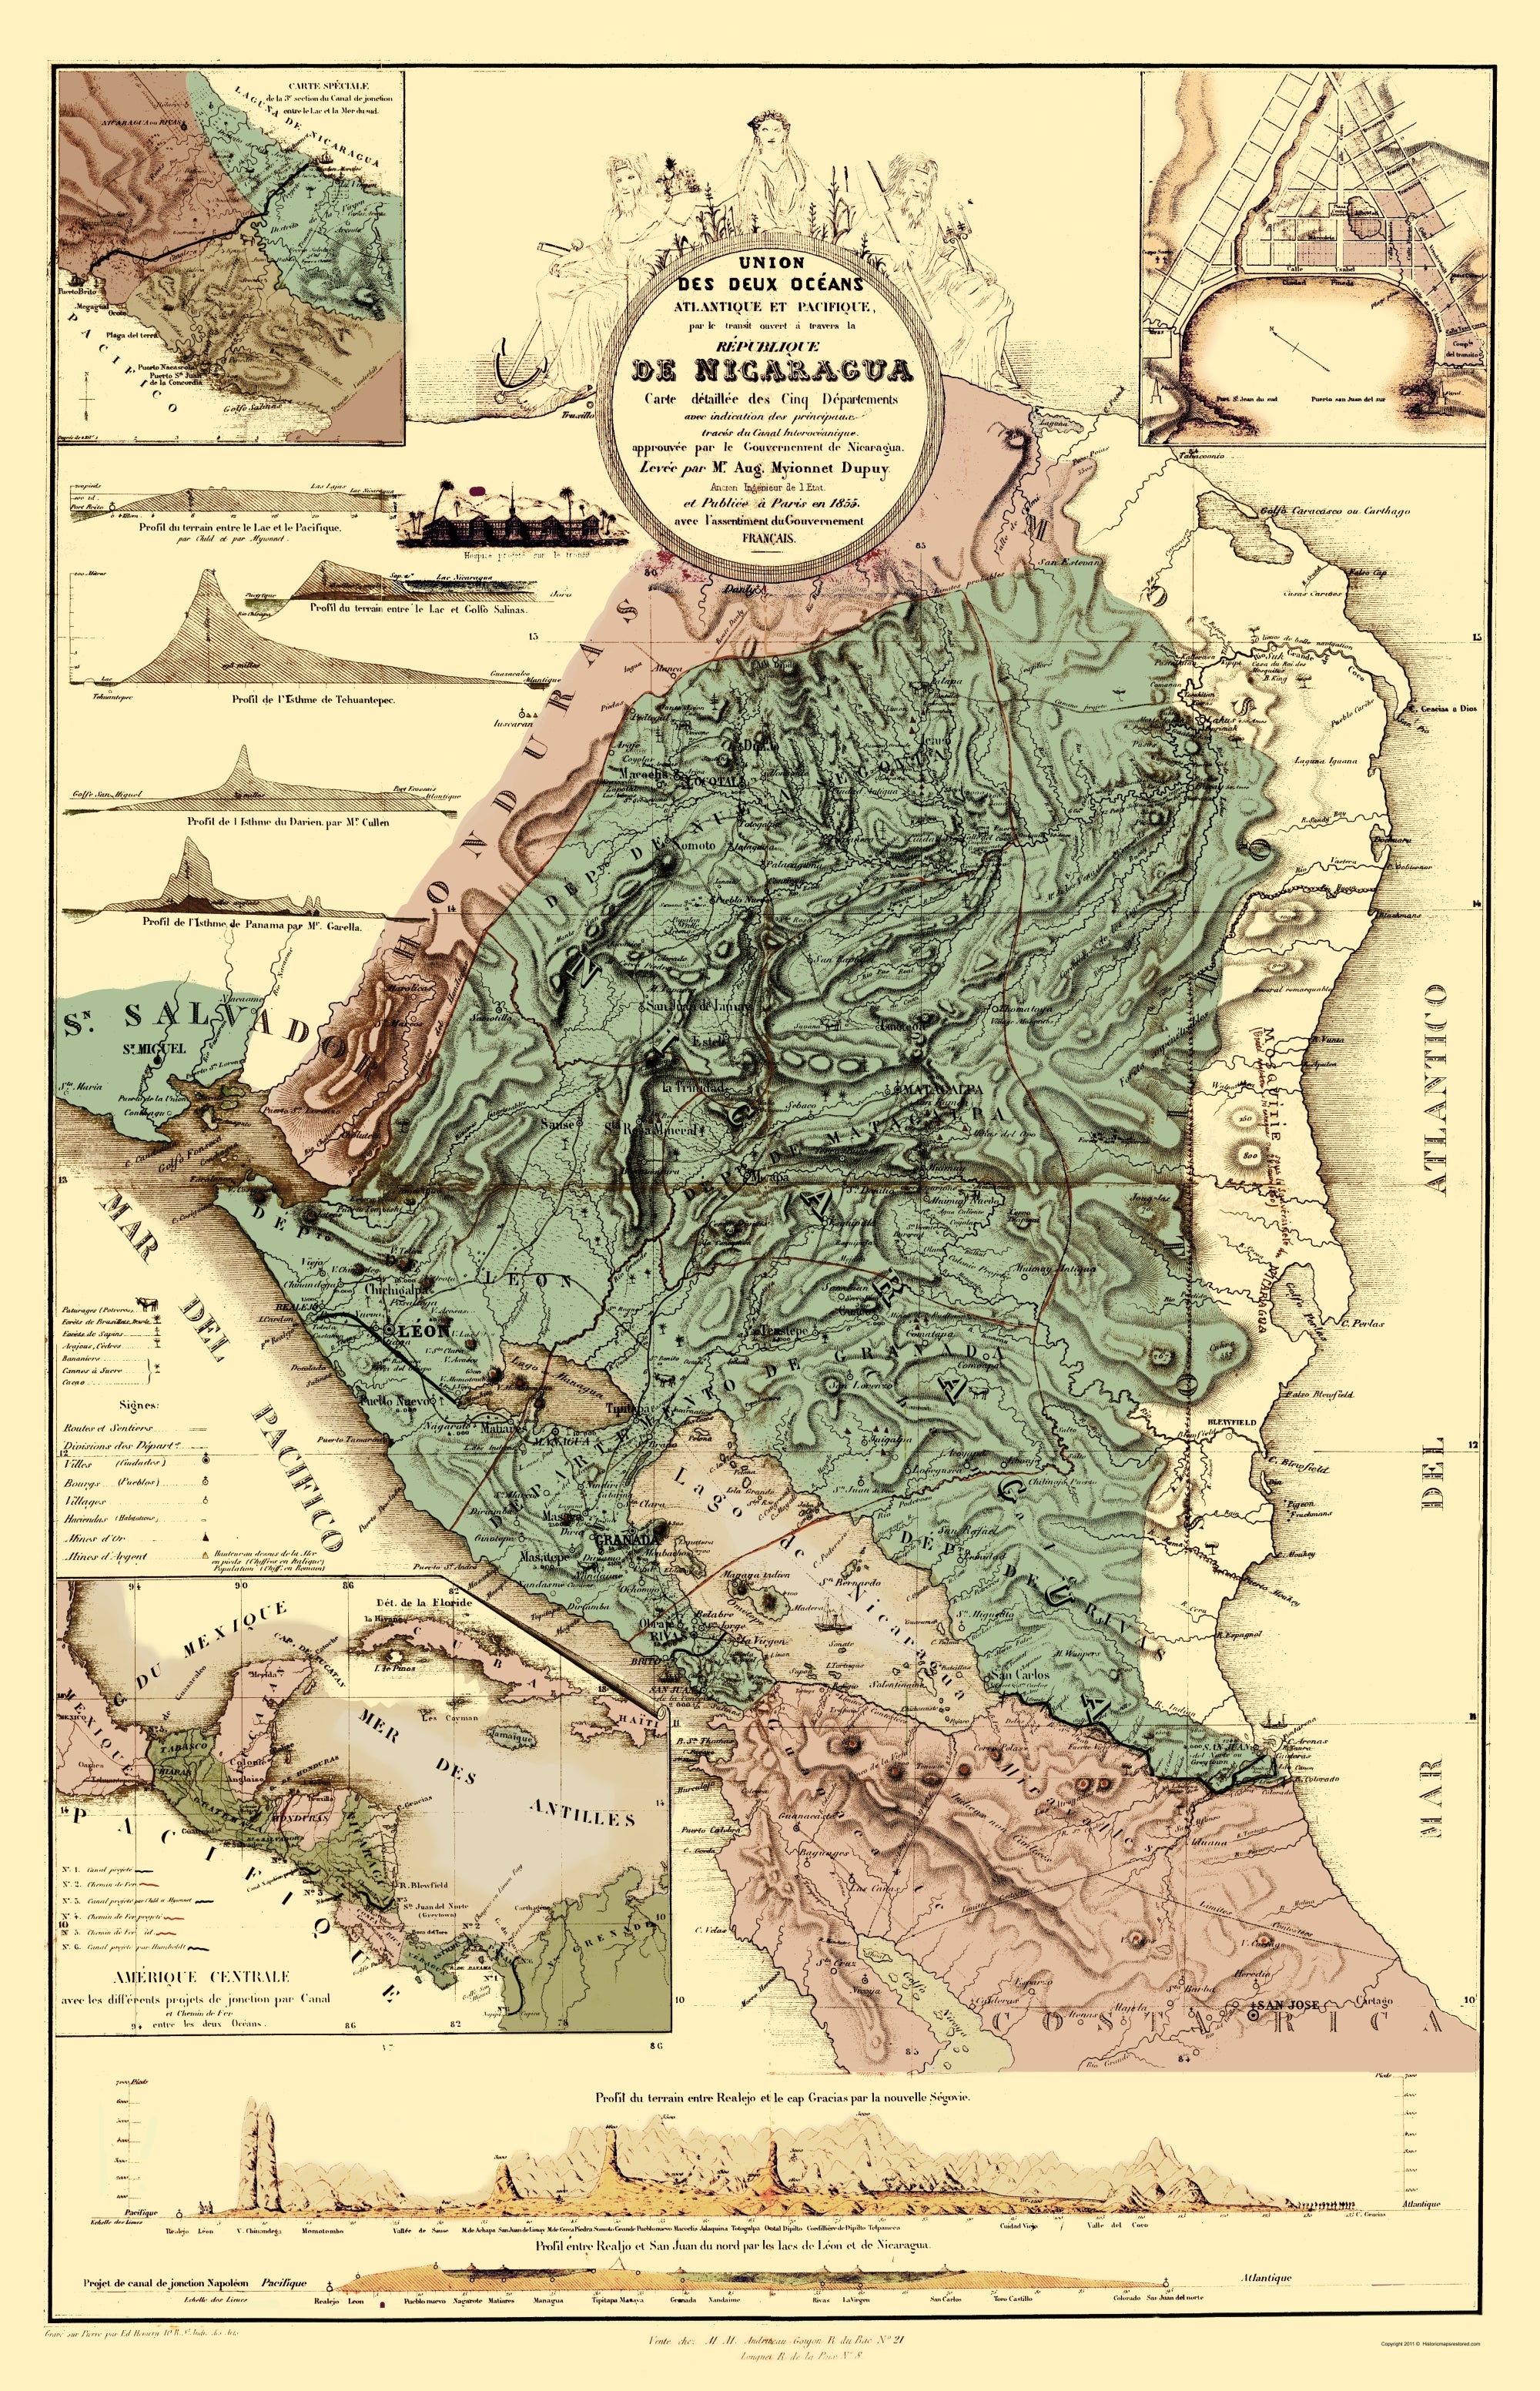
Nicaragua launches construction of inter-oceanic canal

Nicaragua has announced the start of work on a new canal linking the Atlantic and Pacific Oceans.
At an opening ceremony, Wang Jing, the president of HKND, the Chinese company building the canal, said this moment would go down in history.
The 278km (172 mile) waterway will be longer, deeper and wider than the Panama Canal.
But critics fear a negative environmental impact and doubt its viability and economic benefits.
The Grand Canal of Nicaragua, as it has been called, aims to rival Panama's waterway and lift the country out of poverty.
The opening ceremony was largely symbolic, as work began on an access road for machinery needed to build a port for the canal on Nicaragua's Pacific coast.
Nicaragua's Vice-President Omar Halleslevens said the canal would change the history and the economy of Nicaragua, one of Latin America's poorest countries.
"With this great canal, Nicaragua expects to move 5% of the world's commerce that moves by sea, which will bring great economic benefits and double the GDP (gross domestic product),'' said Mr Halleslevens.
Nicaragua Canal Project Overview image from HKND
Analysis: Arturo Wallace, BBC News, Nicaragua
There is a clear sense of expectation here, where the construction of a man made passage between the Pacific and Atlantic oceans designed to dwarf the Panama Canal has officially begun.
But there is also tension: over the past few weeks protests against the canal have increased.
And the authorities' decision to hold the main groundbreaking ceremony in Managua, some 120km away from where the waterway is to built, won't help convince the many sceptics who still doubt the project's viability.
The government claims that the project, awarded to a Hong Kong based international consortium, will finally lift the Western hemisphere's second poorest country out of poverty.
But many fear environmental damage may outweigh the economic benefit, or oppose the extremely generous terms offered to the Chinese investors.
Those who live on the projected route simply don't want to lose their land and livelihoods.
HKND says it expects the project to be finished within five years and operational by 2020, and to cost about $50bn (£32bn).
The project is to include two ports, an airport, a resort and an economic zone for electricity and other companies.
But some have questioned the canal's financial soundness and allege that Wang Jing lacks experience in developing or financing big infrastructure projects.
Opponents are also concerned about the impact construction may have on Lake Nicaragua and on poor communities in the area.
The route announced in July would pass through the lake, an important source of fresh water.
Environmentalists have warned of the risks of damming rivers and moving large amounts of soil. Communities along the route have staged protests.
Links :
- The Guardian : Protests as Nicaragua starts work on $50bn interoceanic canal
- The Conversation : Panama Canal rival: work starts in Nicaragua amid fears over environment and role of China
- GeoGarage blog : Nicaragua waterway to dwarf Panama canal
Monday, December 29, 2014
US NOAA update in the Marine GeoGarage
(currently under construction, upgrading to a new viewer
as Google Maps API v2 is officially no more supported),
this info is primarily intended to our universal mobile application users
(Marine US iPhone-iPad on the Apple Store &
Weather 4D Android -App-in- on the PlayStore)
and also to our B2B customers which use our nautical charts layers
in their own webmapping applications through our GeoGarage API.

- 11401 ed32 Apalachicola Bay to Cape San Blas
- 11406 ed14 St.Marks River and approaches
- 11408 ed30 Crystal River to Horseshoe Point;Suwannee River;Cedar Keys
- 12325 ed5 Navesink And Shrewsbury Rivers
- 12331 ed33 Raritan Bay and Southern Part of Arthur Kill
- 12374 ed15 North Shore of Long Island Sound Duck Island to Madison Reef
- 13274 ed29 Portsmouth Harbor to Boston Harbor; Merrimack River Extension
- 16305 ed11 Bristol Bay-Cape Newenham and Hagemeister Strait
- 17407 ed16 Northern part of Tlevak Strait and Uloa Channel
- 17408 ed9 Central Dall Island and vicinity
- 17409 ed11 Southern Dall Island and vicinity
- 17431 ed12 N. end of Cordova Bay and Hetta Inlet
How do you know if you need a new nautical chart?
See the changes in new chart editions.
NOAA chart dates of recent Print on Demand editions
- U.S. Coast Guard Local Notices to Mariners (LNMs),
- National Geospatial-Intelligence Agency Notices to Mariners (NMs), and
- Canadian Coast Guard Notices to Mariners (CNMs)
Please visit the NOAA's chart update service for more info or the online chart catalog
Tsunami-hit nations mark anniversary
From BBC
The violent upward thrust of the ocean floor at 07:58 local time (00:58 GMT) displaced billions of tonnes of seawater, which then raced towards shorelines at terrifying speeds.
The waves stripped vegetation from mountain sides hundreds of metres inland, capsized freighters and threw boats into trees. The estimated cost of the damage was just under $10bn (£6.4bn).
Ten years on, many coastal towns and villages have rebuilt their communities and lives. The shores of Indonesia and Thailand, left ravaged by the tsunami, appear transformed.


How the wave spread: 26 December 2004


The quake ruptured the greatest fault length of any recorded, spanning a distance of an estimated 1,500km (900 miles) - longer than the US state of California.
The rupture started beneath the quake's epicentre and progressed northward along the fault at about 2km/sec (1.2 miles/second) - lasting about 10 minutes - according to the Tectonics Observatory at the California Institute of Technology.
The length of the rupture meant that the waves reached a wider geographical area - as far afield as Mexico, Chile, and the Arctic.
The waves travelled at speeds of up to 800km/h (500mph).

Computer modelling after the tsunami, estimated that waves had reached a height of almost 20m (65ft) in some areas.

However, scientists investigating damage in Aceh, Indonesia found subsequent evidence that waves had reached 20-30m (65-100ft) in places.
Despite there being several hours between the earthquake and the impact of the tsunami, nearly all the victims were taken completely by surprise. With no adequate warning systems in place, there was no alert issued to people to seek safety.
In the aftermath of the disaster, the Indian Ocean Tsunami Warning and Mitigation System was formed to detect seismological changes and provide warnings of approaching waves.
However, on the 10th anniversary of the disaster, risk experts and UN officials have warned weaknesses remain in the system, particularly regarding the communication of warnings at local level.
Links :
- National Geographic : Will Indonesia be ready for the next tsunami?
- LiveScience : Tsunami science: Advances since the 2004 Indian ocean tragedy
- WSJ : Tsunami’s legacy: Quest for early warning
Sunday, December 28, 2014
Surf sailing
Saturday, December 27, 2014
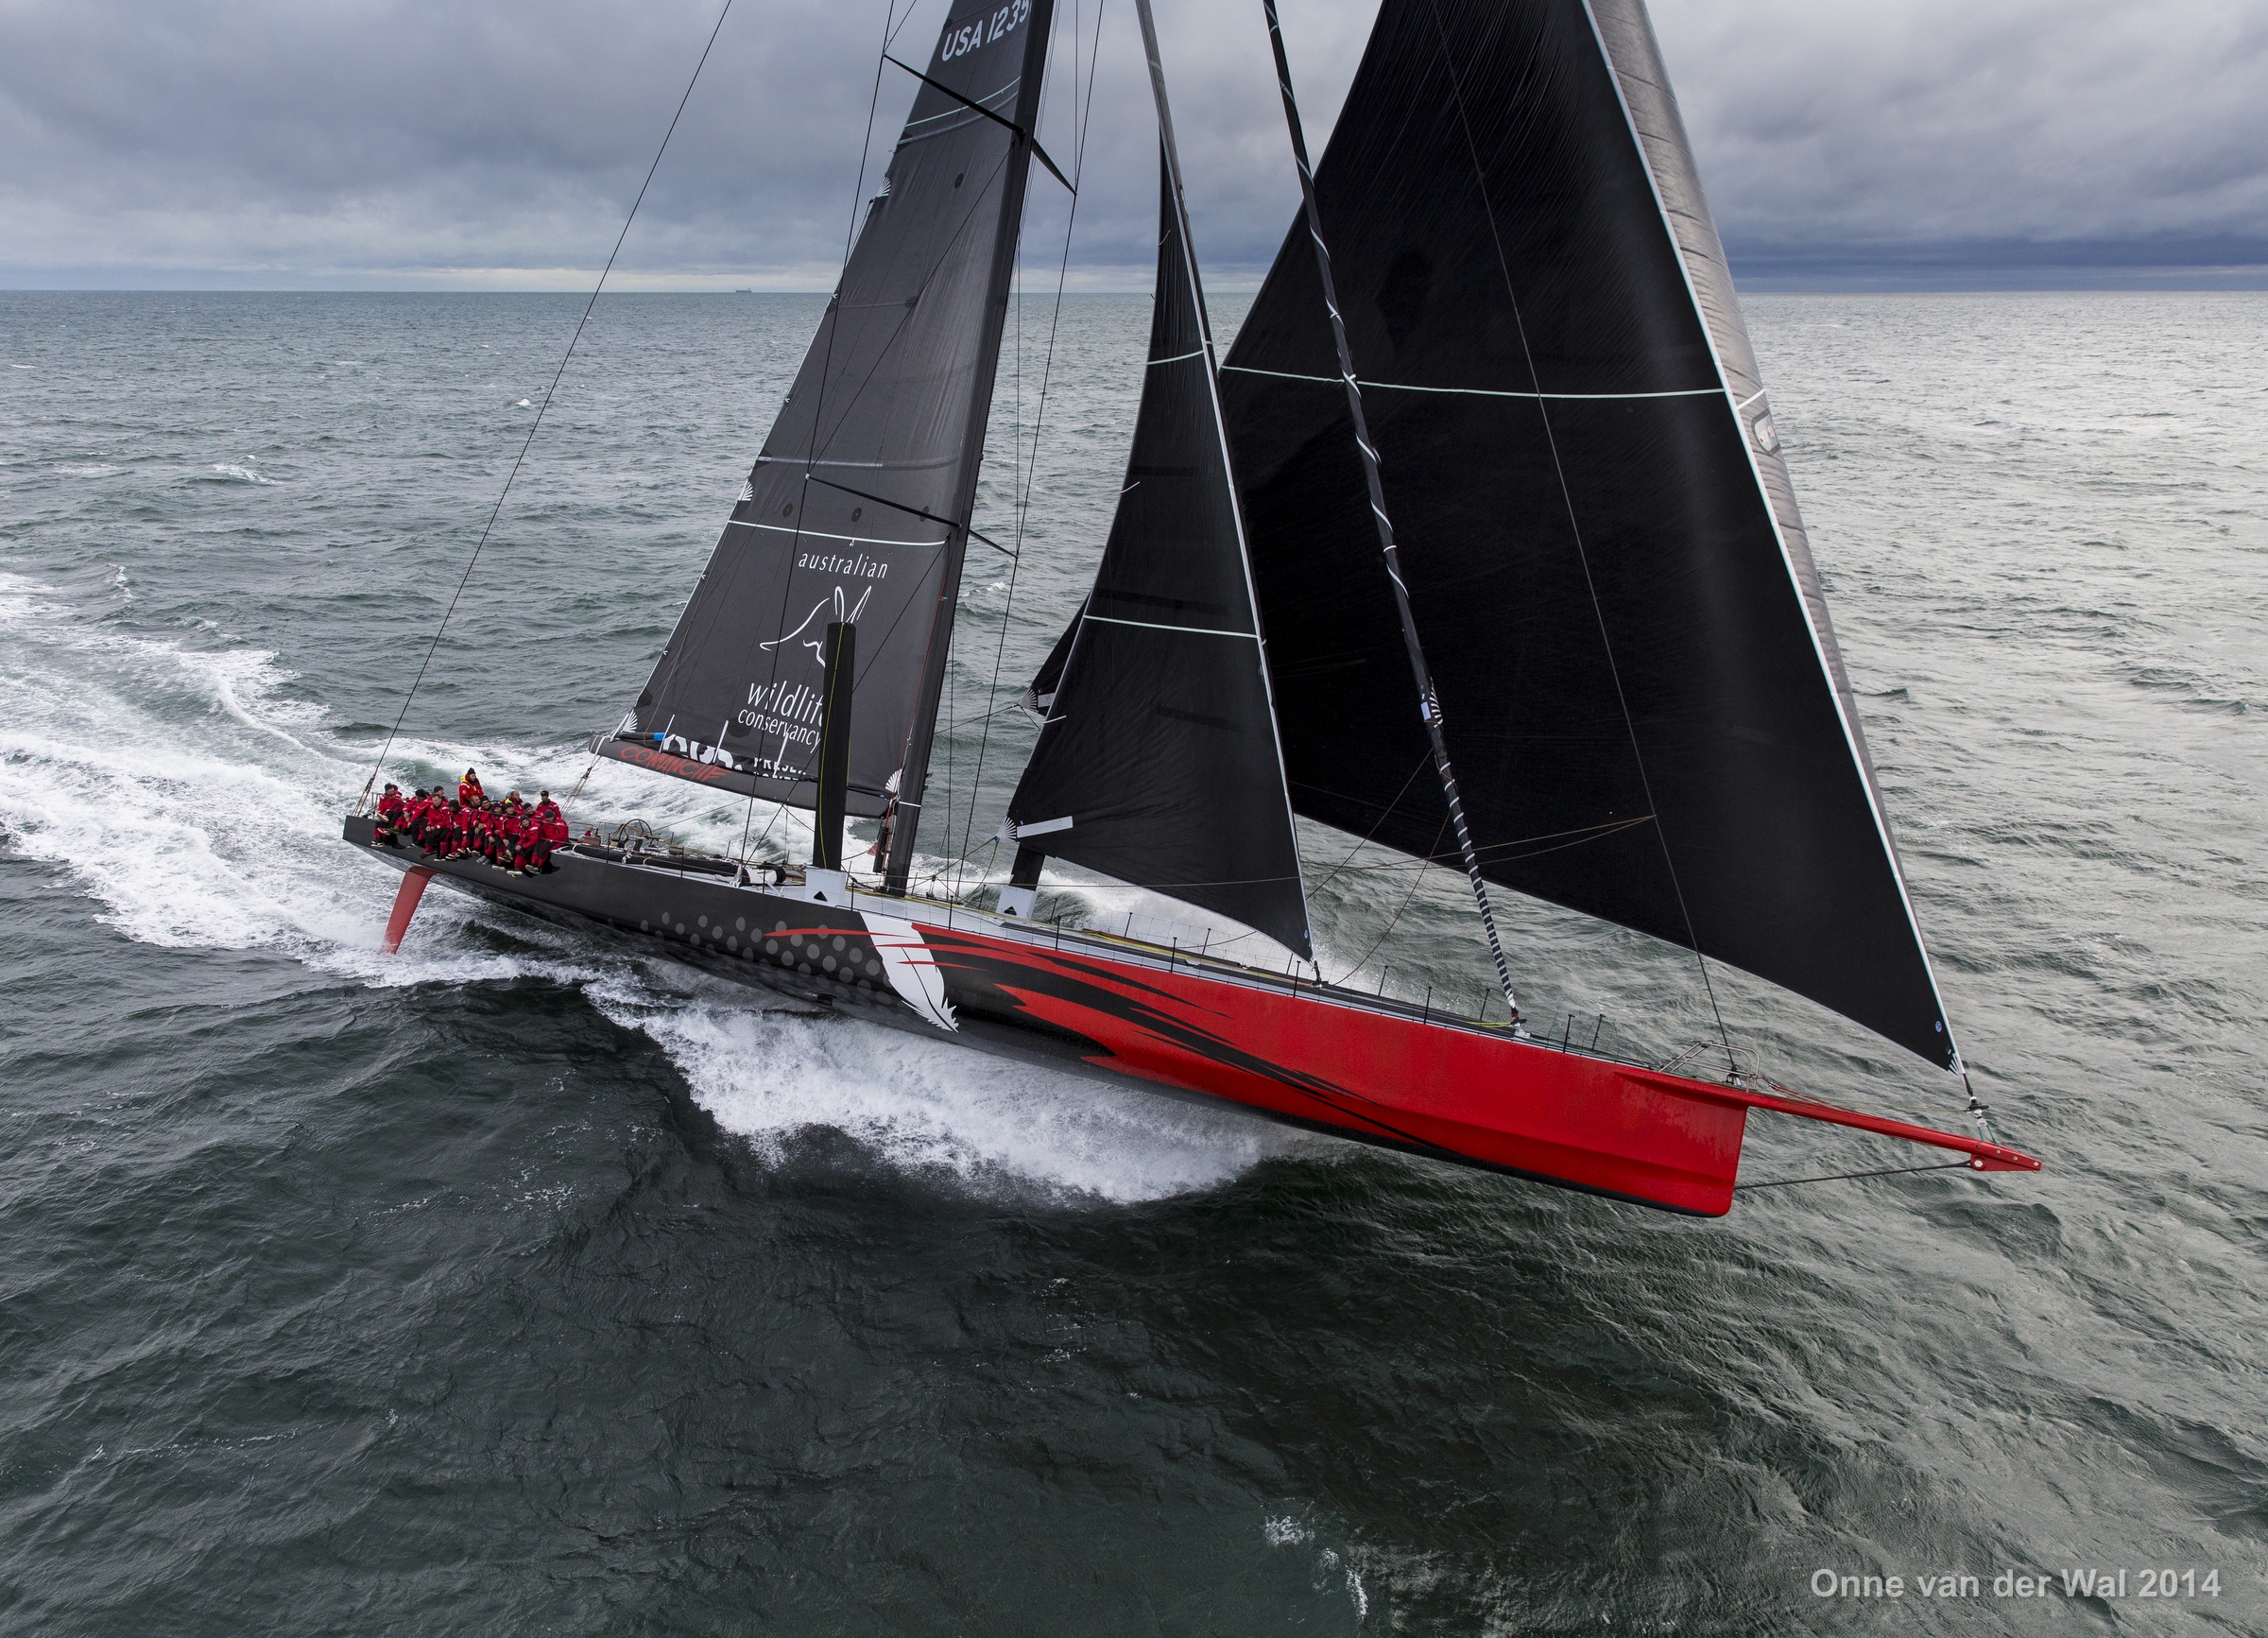
BAR Nacra 20 training
You will want to watch it, and you'll want to watch it right to the end, because someone is taking 'It's Time to Fly' WAY too seriously.
The question is... who?
Take a look at the BAR team in training on the foiling Nacra F20.
Friday, December 26, 2014
Rolex Sydney Hobart Yacht Race : who knows what danger lurks at sea?

But there are hazards below the surface all the same.


Links :
- GQ : The Rolex Sydney Hobart Yacht Race: 10 things you need to know
Thursday, December 25, 2014
Dolphin dance project
The Dolphin Dance Project produces films about communication between humans and wild dolphins through dance.
The Dolphin Dance Project works only with wild dolphins.
Dolphins are not rewarded or coerced by anything other than their own curiosity and joy to interact with intelligent, playful members of another species - just like the human dancer.
Recognizing that we are guests in the dolphins' environment, the filmmakers followed a strict code of etiquette.
There is never any attempt to interact if dolphins are resting or show any sign of annoyance or disinterest.
Wednesday, December 24, 2014
Sedna
Long time ago, a young woman of extraordinary beauty was forced by her father to marry a bad shaman who took her on an island, far from her home.
Unhappy and never ceasing to cry, she eventually succeeds to soften her father who came to remove her in secret.
But when they fled by boat, the shaman realized it and unleashed a terrible storm.
The father threw his daughter overboard and she disappeared in the depths of the oceans...
And so begins the story of Sedna, goddess of Greenlandic waters, where is sailing the boat "La Louise" with a crew of skiers from France and Switzerland.
But gradually, as the days pass, they will realize the legend of Sedna is probably more real than it seems…
Tuesday, December 23, 2014
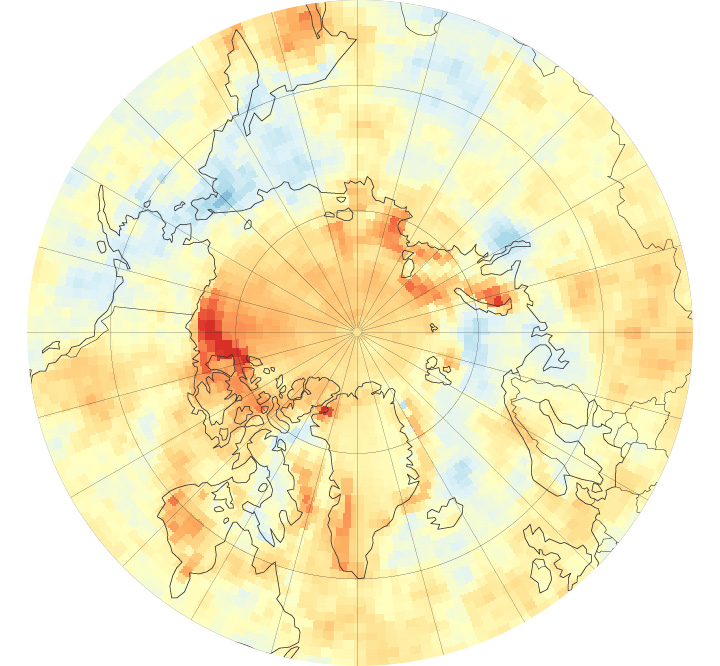
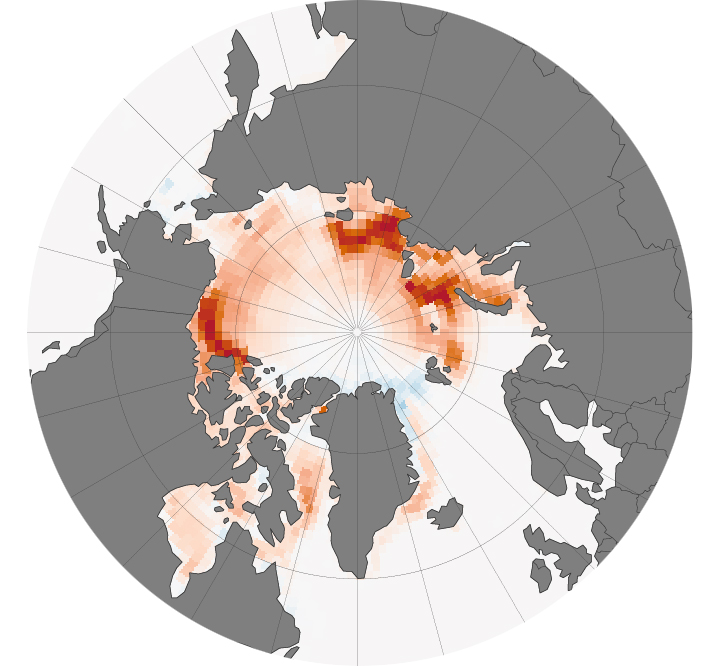
Satellite map shows evidence of a dangerous Arctic warming feedback loop
see NOAA
One of the ways our planet manages its heat budget is by storing solar energy in the oceans.
In recent years, the Arctic has been taking in more than its usual share of heat energy, which could be bad news for our steadily warming planet.
This latest dire climate update was presented by NASA scientists here at American Geophysical Union meeting on Dec. 17.
The map above was made using heat-sensing, satellite-borne instruments that measure the rate of solar radiation change.
In the Arctic, the rate of heat absorption has increased by more than 10 Watts of energy per square meter since 2000. In some areas—like the big red blob representing the Beaufort Sea north of Alaska—this rate has increased as much as 45 Watts per square meter.
Different land surface types bounce it off back into space, while others absorb it. Ice, snow and clouds are really reflective.
Water varies, depending on the angle of the sun.
For the past 15 years, NASA has been using a satellite sensor called CERES (on three different satellites, Terra, Aqua and Suomi-NPP) to calculate how much solar energy is being absorbed versus bounced back into space.
Every summer, the Arctic ice cap partially melts away, and freezes again in the winter, covering more or less (OK, mostly less) the same area it has in the past.
But, because recent years have had record levels of sea ice loss, a lot of that winter ice is barely a year or two old, and less than 6 feet thick.
When summer comes back around, this thin ice melts quickly, exposing the ocean below to solar radiation.
Since 1982, the average onset of the annual summer melt season has moved up by seven days.

This creates a solar radiation feedback loop.
The thin ice melts earlier in the summer when the sun is higher in the sky, which exposes the heat-sinking ocean surface to collect even more solar radiation.
This causes a feedback loop, as more heat is absorbed into the ocean, which in turn causes more melting.
Currently, the average temperatures in the Arctic are rising twice as fast as the rest of the globe.
In addition, the researchers originally thought the loss of sea ice would result in more clouds forming over the Arctic, which would make up for some of the lost sea ice by reflecting back sunlight (the rest of the world’s oceans are covered by clouds much of the time).
However, the cloud cover isn’t filling in, and is in fact being quite unpredictable.
This is contributing to the overall rate of solar energy absorption.
Atmospheric scientist Jennifer Kay of the University of Colorado, a collaborator on this research, says it’s too soon to use CERES data to confirm any long term climate trends.
“Climate is usually considered to be a 30 year average,” she said at a press conference.
As CERES has been collecting Arctic solar energy data since 2000, this research is only about halfway done.
Monday, December 22, 2014
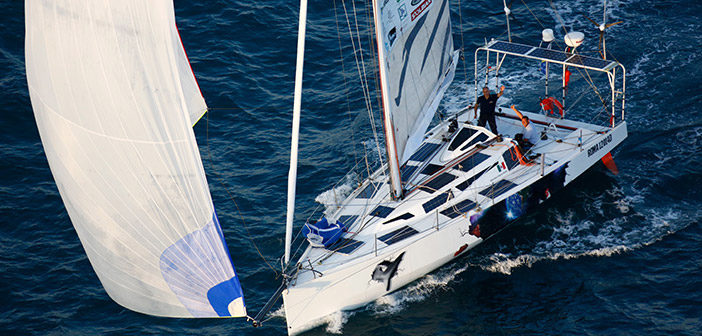
Satellites guide sailor from treacherous waters
Matteo Miceli is attempting to sail the Eco40 around the world
using only renewable energy in a project called ‘Roma Ocean World’.
He is the first one-man, non-stop sailing trip around the world without any additional fuel or food stops throughout the entire journey of more than 27,000 nautical miles (roughly 50,000 km), which begins Sunday, October 19, 2014.
Matteo Miceli, the renown Italian sailor, will make this self- sustaining journey lasting approximately five months, providing entirely for his own needs to demonstrate that it is possible to undergo such a trip, entirely self-sustaining, with only resources that have been provided by nature.
see Live tracking
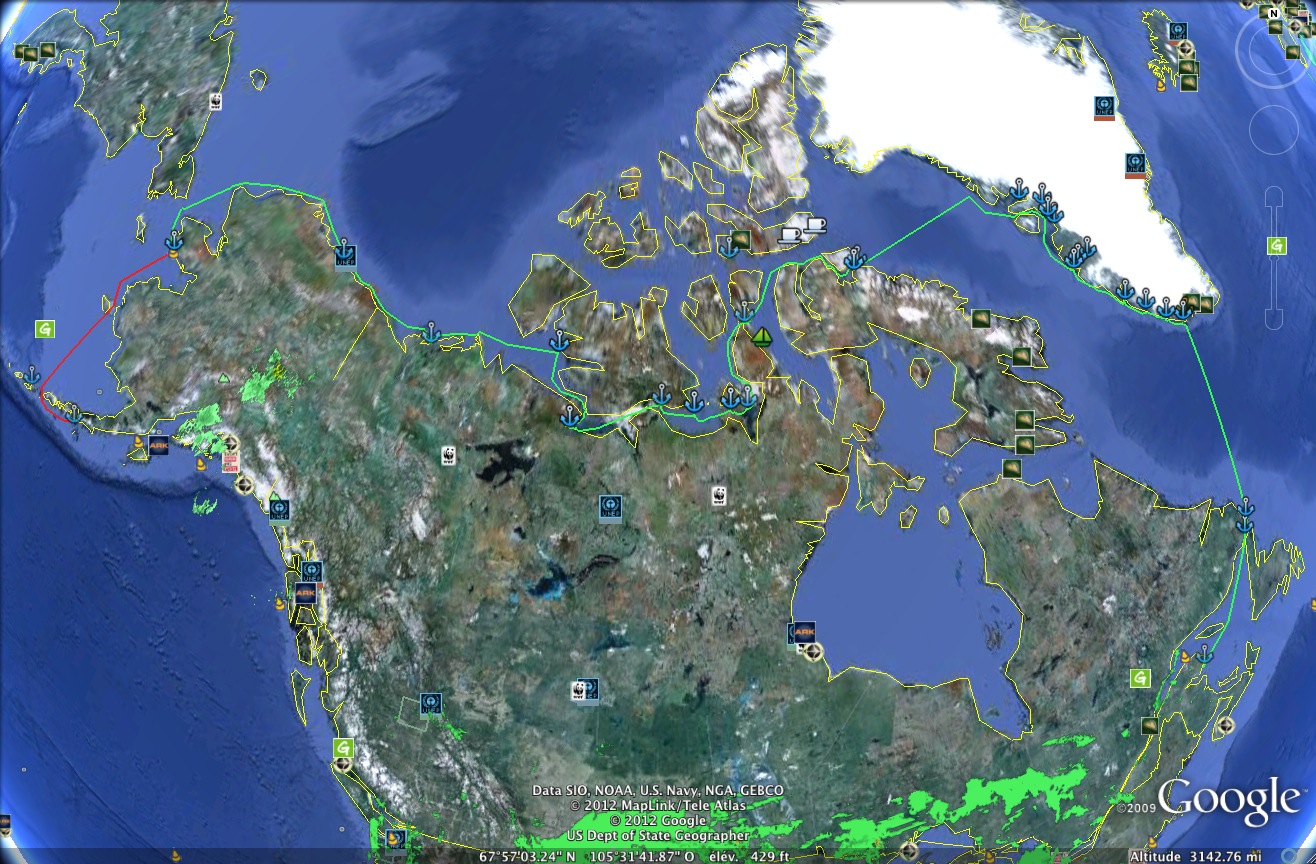
Almost 4 km long, the iceberg drifting near the Prince Edward Islands was detected and tracked by European satellites.
"According to our experience, at these latitudes the big icebergs undergo strong fragmentation. The presence of a big iceberg could be an indicator for a field of smaller fragments which could be very dangerous for the boat," said Luca Pietranera from e-GEOS, a satellite data processing company that provides information to the team planning Matteo's route.
A team of professors from the University of Rom and the Polytechnic Turin would also like to record the ECO40 boat’s movements by using three Leica Geosystems GR25 GNSS reference receivers which will enable:
- Calculating the height of waves along the ECO40 route by using the boat as a buoy and will validate the numerical models of the UK-based Met (meteorology) office;
- Improving the structural design of the Class 40 sailboat by means of calculating the boat’s dynamic stress and boat material durability during the trip;
- And recording the wave characteristics taken from the ECO40’s movements to produce a polar diagram of the boat’s speed, which will be useful for future Class 40 racing boats.
Radar imagery from ESA's Sentinel-1A satellite and the Italian space agency's Cosmo-SkyMed were used to track the movement of the iceberg – and guide Matteo away from the treacherous waters.
The benefit of radar is that it can see through clouds and in the dark, and can therefore provide regular updates on the positions of the icebergs.
It may seem like an awfully cold place for a sailing trip, but Matteo is attempting to sail the Eco40 non-stop around the world using only renewable energy in a project called 'Roma Ocean World', technically lead by the 'La Sapienza' University of Rome.
Even his food supply is self-sufficient.
The aim is to demonstrate how modern technology, together with a responsible attitude, allows us to enjoy maritime sports while respecting the environment.
During the voyage, information on the changes taking place on land and at sea are being collected, underlining the importance of monitoring the effects of climate change on our planet.

In addition, measurements on wind and waves are being used to check satellite data.
Today, Matteo is in the Indian Ocean.
"In terms of iceberg hazards, the most dangerous part of the Eco40 route will be the passage south of Cape Horn, foreseen in February. For this reason, tracking of the big iceberg there has already started," said Mr Pietranera.
The 32 km-long iceberg drifting along the boat's projected route near the South Georgia and the South Sandwich Islands in the South Atlantic has already been picked up on the satellite radars.


Credit: ASI/Cosmo-SkyMed 2014, processed by e-GEOS
- Roma Univ: "Roma ocean world" green wonder boat set to sail
- GeoGarage blog : Copernicus Sentinel-1 : making our seas safer / Earth observation enters next phase /
Sunday, December 21, 2014
NZ Linz update in the Marine GeoGarage

As our public viewer is not yet available
(currently under construction, upgrading to a new webmapping technology as Google Maps v2 is officially no more supported),
this info is primarily intended to our universal mobile application users
(Marine NZ iPhone-iPad on the Apple Store/ Weather 4D Android -App-in- on the PlayStore)
and our B2B customers which use our nautical charts layers
in their own webmapping applications through our GeoGarage API.
- NZ45 Cape Egmont to Rangitikei River
- NZ68 Nugget Point to Raratoka Island (Centre Island)
- NZ69 Stewart Island/Rakiura
- NZ681 Approaches to Bluff and Riverton/Aparima
Note : LINZ produces official nautical charts to aid safe navigation in New Zealand waters and certain areas of Antarctica and the South-West Pacific.
Reporting a Hazard to Navigation - H Note :
Mariners are requested to advise the New Zealand Hydrographic Authority at LINZ of the discovery of new or suspected dangers to navigation, or shortcomings in charts or publications.
Saturday, December 20, 2014
Friday, December 19, 2014
Brazil DHN update in the Marine GeoGarage
(currently under construction, upgrading to a new webmapping technology as Google Maps v2 is officially no more supported),
this info is primarily intended to our universal mobile application users
(Marine Brazil iPhone-iPad on the Apple Store / Weather 4D Android -App-in- on the PlayStore)
and also to our B2B customers which use our nautical charts layers
in their own webmapping applications through our GeoGarage API.

17 charts has been updated and 2 charts have been added since the last update
DHN update November 1, 2014
- 1405 PORTO DE AÇU NEW
- 1406 PROXIMIDADES DO PORTO DE AÇU NEW
- 701 PORTO DE MUCURIPE (Fortaleza)
- 901 PORTO DE MACEIÓ
- 906 PORTO DE SUAPE
- 920 PROXIMIDADES DO PORTO DE MACEIÓ
- 930 PROXIMIDADES DO PORTO DO RECIFE
- 1511 BARRA DO RIO DE JANEIRO
- 1512 PORTO DO RIO DE JANEIRO
- 1622 BAÍA DE SEPETIBA
- 1631 BAÍA DA ILHA GRANDE - PARTE CENTRAL
- 1636 PORTO DE ANGRA DOS REIS E PROXIMIDADES
- 1804 PORTO DE SÃO FRANCISCO DO SUL
- 1902 PROXIMIDADES DA ILHA DE SANTA CATARINA
- 23100 (INT.2124) DO RIO DE JANEIRO À SANTOS
- 201 BARRA NORTE DO RIO AMAZONAS
- 204 DAS ILHAS PEDREIRA À ILHA DE SANTANA
- 242 DA ILHA DOS PORCOS À BAÍA DO VIEIRA GRANDE
- 243 DA ILHA ITAQUARA À ILHA DOS PORCOS
Today 444 charts (510 including sub-charts) from DHN are displayed in the Marine GeoGarage
Don't forget to visit the NtM Notices to Mariners (Avisos aos Navegantes)
Navy develops ‘GhostSwimmer’ drone that looks like a shark
(other video)
From Wired by Jordan Golson
The American military does a lot of work in the field of biomimicry, stealing designs from nature for use in new technology.
After all, if you’re going to design a robot, where better to draw inspiration than from billions of years of evolution?
The latest result of these efforts is the GhostSwimmer: The Navy’s underwater drone designed to look and swim like a real fish, and a liability to spook the bejeezus out of any beach goer who’s familiar with Jaws.

The new gizmo, at five feet long and nearly 100 pounds, is about the size of an albacore tuna but looks more like a shark, at least from a distance.
It’s part of an experiment to explore the possibilities of using biomimetic, unmanned, underwater vehicles, and the Navy announced it wrapped up testing of the design last week.
The robot uses its tail for propulsion and control, like a real fish.
It can operate in water as shallow as 10 inches or dive down to 300 feet.
It can be controlled remotely via a 500-foot tether, or swim independently, periodically returning to the surface to communicate.
Complete with dorsal and pectoral fins, the robofish is stealthy too: It looks like a fish and moves like a fish, and, like other underwater vehicles, is difficult to spot even if you know to look for it.
Down the line, it could be used for intelligence, surveillance, and reconnaissance missions, when it’s not assigned to more mundane tasks like inspecting the hulls of friendly ships.
Animal lovers will be glad to hear that the GhostSwimmer could take the jobs of the bottlenose dolphins and California sea lions the Navy currently trains to spot underwater mines and recover equipment.
The GhostSwimmer joins the ranks of animal-based awesome/creepy robots like the “Cheetah” that can run at nearly 30 mph, the Stickybot that climbs like a gecko, and the cockroach-inspired iSprawl that can cover 7.5 feet per second.
And it may get a baby brother: The Department of Homeland Security has been funding development of a similar, smaller robot called the BIOSwimmer.
True to military form, there’s a whole suite of acronyms to go along with the new toy: The UUV (unmanned underwater vehicle) has been in testing at the JEBLC-FS (Joint Expeditionary Base Little Creek-Fort Story), and was developed by the CRIC (Chief of Naval Operations Rapid Innovation Cell) project, called Silent NEMO (actually, this one doesn’t seem to stand for anything).
It was developed by the Advanced Systems Group at Boston Engineering, a Navy contractor that specializes in the development of robotics, unmanned systems and something called “special tactical equipment”.
The company and Navy haven’t said much about when GhostSwimmer might be deployed or how much it would cost, but next time you’re at the beach and see a fin sticking out of the water, it might be a killer shark—or it might just be a Navy robot.
Links :
- DefenseUpdate : Robotic spy fish conducts underwater surveillance
- GeoGarage blog : Protecting harbors and ships with a robotic tuna fish
Grounding of the Arafenua on the Tikei atoll

During a surveillance mission, the Arafenua customs patrol boat set sail from the island of Fatu Hiva (Marquesas archipelago) to Tikei atoll (Tuamotu archipelago) on 30 May 2014 at 22:00 and grounded there on 1 June at about 04:00 (14°56’,504 S et 144°32’,436 W on the North coast of Tikei)

Tikei is a small coral island 2 miles long, wooded, without lagoon, uninhabited and unmarked, from northern Tuamotu in French Polynesia.
It is 345 miles from the port of Papeete in Tahiti.
It is difficult to land there because the island is surrounded on all sides by a reef which consists of a first barrier at the surface of water then a platier covered with 20 cm of water.
The tidal range is very low, about 30 cm.
The 1000 metre probe line is located approximately 0.6 miles from the reef.
Before leaving Fatu Hiva on Friday 30 May, the captain overboard gathered part of the crew to explain the mission.
At the end, it traces the road on the MaxSea PC installed in 2012 which is connected to a GPS and a Furuno radar.
Starting outside Fatu Hiva's Bay of Virgins, the road tangents the 1,000 metre sounding line in northwest Tikei.
The vessel sailed on a dark night to an uninhabited islet without any light source, making optical detection impossible.
Furthermore, overcast weather with squalls increases the watchman's difficulties and reduces the quality of the radar watch.
Other weather conditions (wind and swell) have no influence on the circumstances of the occurrence.
During the day, the optical watch would have made it possible to warn the shift manager that he was on his way to the platier.
The arrival at night can therefore be considered as a determining factor.
The weather conditions on June 4 were as forecast, 1.50 to 2 m swell.
The arrival of a swell train that generated a series of waves breaking whose height was above average is the determining factor.
The patroller has an electronic mapping equipment that works with MaxSea software.
This equipment is a ECS and not an ECDIS.
This ECS is not recognised by the IMO as a replacement for the paper charts.
The electronic chart used comes from a private publisher, it is not an ENC published by an official hydrographic service.
Consequently, electronic charting equipment can only be an aid to navigation; it cannot be the primary navigation or reference system.

There is no landing map of the island.
The most accurate paper chart is the "6689 - Tuamotu Islands (western part)", the one used for the approach.
It is, seen the scale (1/595 000), unusable for navigation in the direct vicinity of Tikei.
It was based on bathymetric information collected by SHOM until 1977.
It was last updated in 2010.
The geodetic reference does not appear on this map.
According the scale (1:595 000), the thickness of the pencil line (0.3 mm) is 178.5 m.
A cartridge indicates that the chart should not be used without consulting other documents, in particular Volume 1 of the Navigator's Guide for information on charts, their accuracy and limitations.
With regard to other navigation aids (radars, GPS, depth sounder), no malfunction was reported.
The lack of a landing card is an underlying factor.
The course was plotted by the captain at sea on MaxSea to arrive in the northwest of Tikéi near the 1000 m sounding line.
It is in fact an approximate isobath (broken line).
The master on board requested to plot this route on the two paper charts (7347 and 6689).
The road passes 1 mm from the islet of Tikéi on map 6689 (less than 600 m) and the landing point is not formalized although it is the first time that Arafenua approaches Tikéi.
It appears that the rules of caution set out in the navigator's guide volume 1 and its supplementary booklet entitled "L'hydrographie, les documents nautiques, leurs imperfections et leur bon usage" were not respected.
In particular the main advice for the layout of a road so as to ward off dangers which is the "thumb rule".
As specified in the above documents, the thumb refers to both an old length (2.7cm) and the width of the browser thumb.
The guard distance from the coast of Tikéi to the scale of the larger paper chart (6689) is nearly 9 miles (36 minutes at 14 knots).
Within this distance Tikéi should only be approached with great care.
The "thumb rule" also applies to electronic maps provided that the map is used at compilation scale, i.e. the scale of the paper map used to develop the electronic map.
The ease of use of the mapping software and the illusion of precision given by the electronic map that can be zoomed at will associated with GPS have made us forget the basic rules of caution.
In particular the constructive doubt with which aids to navigation should be exploited.
The habit of sailing together, for many years and in areas known for transits of a few hours, has blunted the knowledge acquired during initial training.
The master at sea's brief elaboration of the route and the absence of remarks on the route by the various watchkeepers were a determining factor in the grounding.
During the 0100 to 0400 watch, watch leader B could not accurately determine the island's position on the radar due to rain.
Having failed to adjust the anticlutter, he focuses on tracking the course on MaxSea without using the overlay function of the second radar.
He does not master the use of this equipment installed in 2012.
The island does not appear on the MaxSea map because the zoom is set to maximum.
Watch leader B loses track of the distance between him and Tikéi until he prepares his relief. Although the optical and radar watches were severely degraded, he did not take any action while approaching Tikéi at night.
It was only about 5 minutes before the grounding that he asked to intuitively reduce the engines by 100 revolutions.
The conduct of the landing watch is inadequate.
This is a determining factor.

The grounding
The ARAFENUA grounded because the actual position of the island is 1500 m further north than that indicated on the MaxSea mapping.

This shift in the island's position is a contributing factor.


The paper chart 6689 (scale 1/595000), published in 1978, was based on chart 6057 (1/510000), which it replaced.

This shift affected the chart 6057 then the current chart 6689, as well as the electronic navigation chart ENC FR266890 which were elaborated from this same paper chart.


- To the software publisher MaxSea :
- At SHOM :

Thursday, December 18, 2014
World Magnetic Model updated

NOAA and British Geological Survey update World Magnetic Model :
Critical changes made to ensure accurate navigation
NOAA officials announced today the World Magnetic Model (WMM), a representation of Earth’s large-scale magnetic field and an indispensable complement to GPS devices used by NATO, the United States and United Kingdom militaries, as well as civil applications ranging from mineral exploration to smartphone apps, has been updated.

Changes in the Earth's outer core trigger unpredictable changes in its magnetic field, an invisible force that extends from Earth's interior to where it meets a stream of charged particles emanating from the Sun.
For example, over the past few decades the North magnetic pole has been drifting toward Siberia at an irregular speed.
This migration can adversely affect the accuracy of navigation if not compensated for by an updated WMM.
The WMM2015 is a large-scale representation of Earth’s magnetic field.
The blue and red lines indicate the positive and negative difference between where a compass points the compass direction and geographic North.
Green lines indicate zero degrees of declination.
(Credit: NOAA)
“We know the Earth’s magnetic field is constantly changing,” said Stephen Volz, Ph.D., assistant NOAA administrator for NOAA’s Satellite and Information Service.
“But thanks to the environmental intelligence gathered from a wide array of platforms, including satellite observations, we can make vital updates to the World Magnetic Model and ensure the most accurate navigation for commercial applications.”
Updated every five years, the WMM, created using satellite observations of the Earth’s magnetic field, provides accurate magnetic field declination, the difference between true north and magnetic north critical for navigational safety.
Scientists continuously survey the magnetic field and can precisely map the present field and its rate of change and then extrapolate changes into the future.
WMM-corrected magnetic compass readings are not subject to ionospheric disturbances and work everywhere, including under the sea and in deep canyons.

"Although GPS is a great tool for navigation, it is limited in that it only provides your position. Your orientation, the direction you are facing, comes from the magnetic field," said James Friederich, a geodetic scientist at the U. S. National Geospatial-Intelligence Agency.
"Our war fighters use magnetics to orient their maps. Your smartphone camera and various apps can use the magnetic field to help determine the direction you are facing. All of these examples need the WMM to provide your proper orientation."
The WMM is the standard navigation model for the U.S. Department of Defense, North Atlantic Treaty Organization, International Hydrographic Organization and consumer electronics.
For the last 10 years, NOAA’s National Geophysical Data Center (NGDC) in Boulder, Colorado, working with the British Geological Survey in Edinburgh, Scotland, has co-developed the WMM on behalf of the U.S. National Geospatial-Intelligence Agency and the United Kingdom’s Defence Geographic Centre.
NOAA’s partner, the Cooperative Institute for Research in Environmental Studies (CIRES), contributed key science to this project.
Links :
- WBGS WMM2015 calculator / NOAA magnetic declination estimated value calculator
- NOAA WMM
- NOAA CrowdMag (allows users to collect their own magnetic field data using the magnetometers in their smartphone): Androïd / iOS