During the first dive of the Okeanos Explorer 2016 Hohonu Moana: Exploring Deep Waters off Hawaii expedition to explore on the northeast side of Necker Island, the Deep Discoverer remotely operated vehicle encountered this octopus, which confused several of our shore based scientists who have never seen anything like it. Upon further review, this ghostlike octopod is almost certainly an undescribed species and may not belong to any yet-described genus.
This tiny octopus, whose body measured about five centimeters across, was spotted swimming along at a depth of 825 meters as we explored Whiting Seamount on April 29, 2015.
A satellite image shows damage at Fukushima I Nuclear Power Plant In Fukushima Prefecture. The damage was caused by the offshore earthquake that occurred on March 11, 2011. Photo credit: Greenpeace
With the help of my colleagues in Japan and around the world, I’ve spent the past five years piecing together the impacts
that radioactive releases from Fukushima have had on the ocean, marine
life, and the people who live on both sides of the Pacific.
In the
process of sharing our insights with scientists and the public, I’ve
become frustrated with both sides of the nuclear power debate for
embracing either overly alarmist or dismissive attitudes toward the
problem.
In addition, I’ve grown concerned over the lack of oversight
for radioactive contamination in U.S. waters.
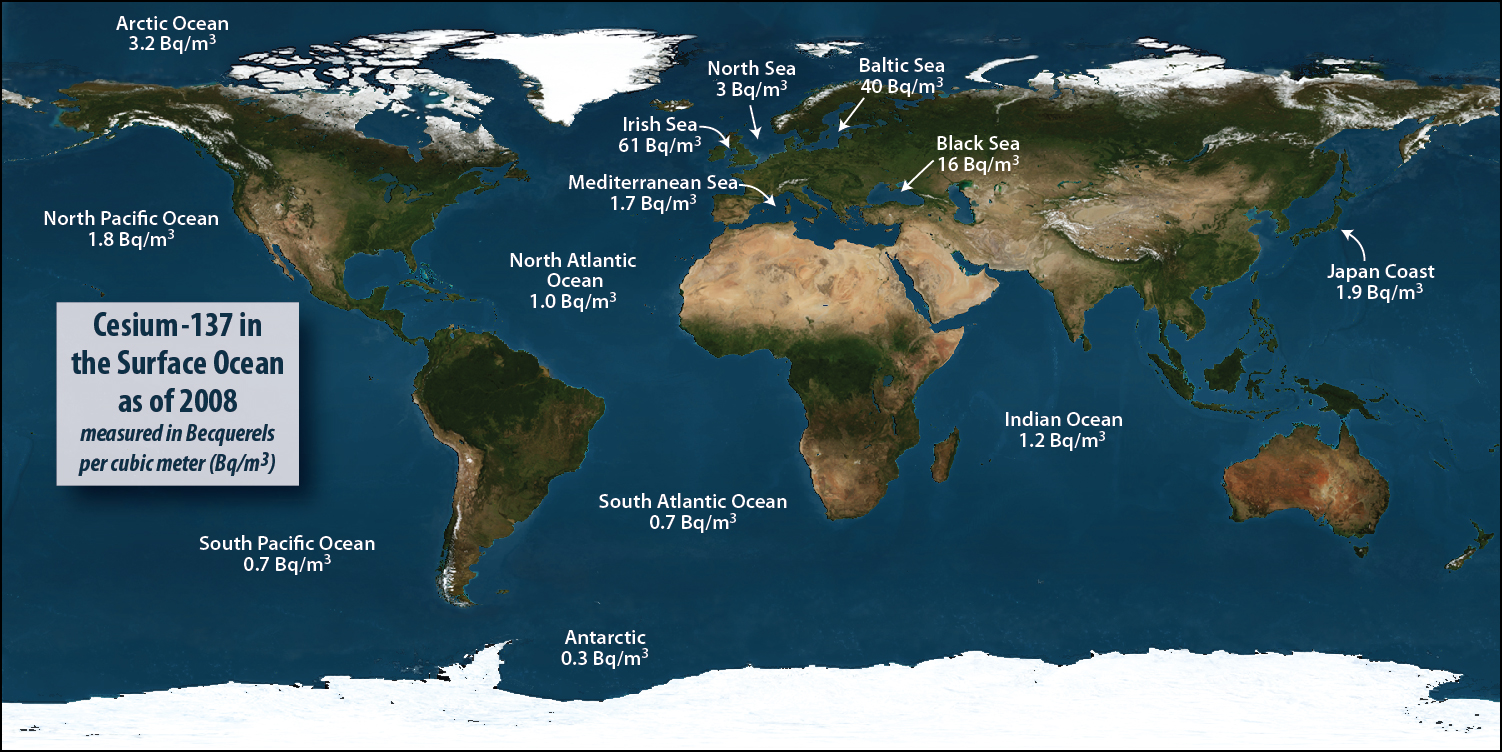
Cesium-137 in the surface oceans as of 2008 (pre-Fukushima)
In the 1960, immediately after the end of testing on the Pacific atolls, the concentration of radioactive cesium in the Pacific off the coast of Japan was about 50 Becquerels per cubic meter (Bq/m3) and 10 Bq/m3 off California.
By 2011 immediately before the earthquake and tsunami, that had fallen throughout the Pacific to about 2 Bq/m3 as a result of radioactive decay.
Today, the highest we have seen off the coast of North America is 6 Bq/m3.
Off the coast of Japan after the accident, (aside from the extremely high levels detected at the source of release from the reactors) we recorded a high of 4,500 Bq/m3.
source : whoi.edu
On March 11, 2011, the devastation in Japan after the earthquake and
tsunami provided a stark lesson in nature’s power.
But in the days that
followed, another disaster unfolded at the Fukushima Daiichi nuclear
power plant that continues to underscore how human activities can leave a
discernible imprint on something as large as the Pacific Ocean and on
people and organisms thousands of miles away.
Our Radioactive Ocean: The Impacts of Fukushima on the Pacific
WHOI chemist Ken Buesseler discusses radiation in the ocean and the impacts of Fukushima across the Pacific--from Japan to North America (2014)
Five years later, the story from the Japanese side of the Pacific is
this: Overall, things are under control with the construction of an “ice
wall” to prevent the continued releases of contaminated water into the
ocean, and fishing has resumed in all regions except those within 10
kilometers of the reactors.
However, these milestones obscure the fact
that the Japanese will be wrestling with the cleanup for decades and
will spend trillions of yen in the process.
It also minimizes the
threats posed by millions of gallons of highly contaminated water on the
power plant grounds and the likelihood that storms and other natural
events will continue to mobilize contaminants currently trapped in soils
and ocean sediments near shore.
More than 80 percent of the radioactivity from the damaged reactors
ended up in the Pacific — far more than reached the ocean from Chernobyl
or Three Mile Island. Of this, a small fraction is currently on the
seafloor — the rest was swept up by the Kuroshio current, a western
Pacific version of the Gulf Stream, and carried out to sea where it
mixed with (and was diluted by) the vast volume of the North Pacific.
These materials, primarily two isotopes of cesium, only recently began
to appear in the eastern Pacific: In 2015 we detected signs of
radioactive contamination from Fukushima along the coast near British
Columbia and California.
Radioactivity In Our Ocean: Fukushima & Its Impact On The Pacific
As expected, the topic of radiation leaking into the Pacific Ocean and threatening marine life and public safety is receiving a lot of attention.
Our intent with this lecture was to bring forth the most up to date information from American and Canadian scientists that are involved in measuring the levels of radiation so the public can be more informed.
The information collected, analyzed and shared by our speakers was done scientifically.
Levels of Fukushima cesium off the west coast of North America were measured independently by WHOI, Canada Fisheries and Kelp Watch 2015.
They all agree on levels of cesium isotopes in waters along the coast and offshore.
Although just barely discernible by our most sophisticated
instruments, these signs, and the many more signs from samples we’ve
collected on both sides of the Pacific, show that releases have
continued, but that at current rates, it would take 5,000 years to equal
the amount of cesium released in the accident’s first few months.
Despite this, the fact remains that this event is unprecedented in its
total release of radioactive contamination into the ocean.
Nevertheless,
we often struggle to detect signals from Fukushima above the background
radiation that surrounds us every day.
So what’s the middle ground?
First, it is incorrect to say that
Fukushima is under control when levels of radioactivity in the ocean
indicate ongoing leaks, caused by groundwater flowing through the site
and, we think, enhanced after storms.
At the same time, it is also wrong
to attribute to Fukushima events like recent die-offs of seal, whale,
and starfish along the West Coast rather than see that they are far more
complex and have been happening for far longer than we’d like to admit.
Recently, I’ve begun to see a much more serious threat to U.S.
waters.
With our nearly 100 reactors, many on the coast or near inland
waterways that drain to the ocean, you might expect a federal agency to
be responsible for supporting research to improve our understanding of
how radioactive contamination originating from one of these sites would
affect our marine resources.
Instead, the response we receive from an
alphabet-soup of federal agencies is that such work “is in the national
interest,” but ultimately “not our job.”
As a result, we have turned to
crowd funding to help us build data along the West Coast to address
immediate public concerns and to keep a watchful eye out to sea.
That is no longer sufficient.
As the EPA runs RadNet, which monitors
radioactivity in the air we breathe, we need an OceanNet to do the same
for our nation’s waters.
We also need to do a better job of educating
the public about radioactivity to lessen the impact of both inflammatory
and dismissive rhetoric.
Fortunately, accidents on the scale of Fukushima are rare, but there
is a great deal more we can and should do to prepare should something
similar happen here.
We can’t simply cast our lot on good fortune.
Instead, we need to do everything we can to fill the knowledge gaps that
have the potential to do great harm in the wake of disaster.
Harmony
of the Seas, the newest addition to Royal Caribbean's award-winning
Oasis Class fleet, under construction at Chantiers de l'Atlantique
shipyard is starting her first sea trials viewable in live on Weather 4D 2.0 mobile app.
This visualization shows total sea level change between 1992 and 2014, based on data collected from the TOPEX/Poseidon, Jason-1, and Jason-2 satellites. Blue regions are where sea level has gone down, and orange/red regions are where sea level has gone up. Since 1992, seas around the world have risen an average of nearly 3 inches. The color range for this visualization is -7 cm to +7 cm (-2.76 inches to +2.76 inches), though measured data extends above and below 7cm(2.76 inches). This particular range was chosen to highlight variations in sea level change.
The oceans have heaved up and down as world temperatures have waxed
and waned, but as new research tracking the past 2,800 years shows,
never during that time did the seas rise as sharply or as suddenly as
has been the case during the last century.
The new study, the culmination of a decade of work by three teams of
farflung scientists, has charted what they called an “acceleration” in
sea level rise that’s triggering and worsening flooding in coastlines
around the world.
The findings also warn of much worse to come.
The scientists reported in a paper published Monday in
Proceedings of the National Academy of Sciences that they have greater
than 95 percent certainty that at least half of more than 5 inches of
sea level rise they detected during the 20th century was directly caused
by global warming.
“During the past millennia, sea level has never risen nearly as fast as during the last century,” said Stefan Rahmstorf,
a physics professor at Potsdam University in Germany, one of 10 authors
of the paper.
“That was to be expected, since global warming inevitably
leads to rising seas.”
By trapping heat, rising concentrations of atmospheric pollution are
causing glaciers and ice sheets to melt into seas, lifting high tides
ever higher.
Globally, average temperatures have risen about 1°C (nearly 2°F) since the 1800s.
The expansion of warming ocean water was blamed in a recent study for about half of sea level rise during the past decade.
Changes in sea level vary around the world and over time, because of
the effects of ocean cycles, volcanic eruptions and other phenomenon.
But the hastening pace of sea level rise is being caused by climate
change.
“The new sea level data confirm once again just how unusual the age
of modern global warming, due to our greenhouse gas emissions, is,”
Rahmstorf said.
“They also demonstrate that one of the most dangerous
impacts of global warming, namely rising seas, is well underway.”
Were it not for the effects of global warming, the researchers
concluded that sea levels might actually have fallen during the 20th
century.
At the very least, they would have risen far less than was
actually the case.
A report published by Climate Central on Monday, the result of an
analysis based in part on the findings in Monday’s paper, concluded that
climate change was to blame for three quarters of the coastal floods
recorded in the U.S. from 2005 to 2014, mostly high tide floods.
That
was up from less than half of floods in the 1950s.
“I think this is really a first placing of human fingerprints on coastal floods, and thousands of them,” said Ben Strauss,
vice president for sea level and climate impacts at Climate Central.
Strauss led the analysis, which also involved government and academic
researchers.
Governments and communities have been slow to respond to the crisis
of rising seas, though efforts to adapt to the changes underway are now
being planned around the world.
“There’s a definite recognition among people who weren’t talking
about sea level rise 5 years ago that it’s something to be concerned
about,” said Laura Tam, a policy director at SPUR, which is an urban
planning think-tank based in San Francisco.
“And something that needs to
be planned for.”
A high-profile effort to track long-term changes in sea levels was
based on analysis of sediment layers at a single location in North
Carolina. Published in 2011,
that study produced a chart of sea levels that bounced up and down over
time, changing with global temperatures, and then ticked sharply upward
as industrialization triggered global warming.
“North Carolina basically showed us that this could be done,” said Andrew Kemp, a sea level scientist at Tuft’s University.
He was a co-author of both Monday’s paper and the paper published in 2011.
Monday’s paper combined the data from North Carolina with similar
analyses from 23 other locations around the world plus data from tide
gauges. Rob DeConto,
a professor at UMass Amherst who researches prehistoric climates, and
who was not involved with the study, described the report as a “nice
job” that “used a lot more data than anybody else has used in a study
like this.”
The analysis goes further than explaining historical sea level rise.
It includes worrying projections for the future.
By extending their findings to future scenarios, the scientists
showed that the amount of land that could be inundated in the coming
years will depend heavily on whether humanity succeeds in slashing
pollution from fuel burning, deforestation and farming.
The Paris Agreement negotiated in December aims
to do just that, with nations agreeing to take voluntary steps to
reduce the amount of pollution they release after 2020.
It could take
decades, though, before that untested approach is revealed to have been a
success, a failure, or something in between.
Coastal cities will face greater threat than anticipated
Even If humans quickly stop polluting the atmosphere, potentially
keeping a global temperature rise to well below 2°C (3.8°F) compared
with preindustrial times — a major goal of the Paris climate agreement —
seas may still rise by an additional 9 inches to 2 feet this century,
the study concluded. That would trigger serious flooding in some areas,
and worsen it in others.
Under the worst-case scenario investigated, if pollution continues
unabated, and if seas respond to ongoing warming by rising at the
fastest rates considered likely, sea levels could rise more than 4 feet
this century alone, wiping out coastal infrastructure and driving
communities inland.
The problem would be made far worse if the Antarctic or Greenland ice sheets collapse — something that’s difficult to forecast.
Their projections for future sea level rise were similar to those published in 2013 by scientists convened by the United Nations, following the Intergovernmental Panel on Climate Change’s most recent assessment of climate science.
They also closely matched projections that were coincidentally published in a separate paper in the same journal on Monday.
The similarity of the other papers’ projections “strengthens the confidence” in the findings, said Robert Kopp, a Rutgers University climate scientist who led the analysis.
The convergence of the findings in Monday’s papers was a “nice result,” said Matthias Mengel,
a researcher at at Potsdam University who coauthored the other sea
level rise study released Monday. He led a team of sea level scientists
who took a different approach than Kopp’s team to projecting future sea
levels.
Mengel’s team projected future sea levels by combining the results of
models that anticipate changes to icebergs, ice sheets and ocean
expansion in the years ahead, and used those findings to predict sea
levels.
For years, different approaches to projecting future sea level rise
have arrived at different results, but the gap has recently been
closing, which Mengel described as “a really good sign for sea level
science” — even if it’s ominous news for humanity.
An article in Saturday’s New York Times (Connecticut Rock Pile Known as Negro Heads May Get a New Name) described efforts
to rename a small island near New Haven Connecticut.
The island,
actually more of a “rock pile”, has long been known as Negro Heads, and
bears that name on the official nautical charts for Long Island Sound.
A buoy in Long Island Sound near Branford, Conn., that marks the rock formation known as Negro Heads.
Andrew Sullivan for The New York Times
The feature is a local landmark off the town of Branford, and has a warning buoy according to the Times story.
Here are closeup views of Branford from a 2014 nautical chart.
The rocks have been marked by buoys since at least 1846, but the name changed.
The newspaper article noted that the rock pile used to have a more
offensive name, and that it was changed to the present name “between the
1830s and 1880s”. That covers a large date range, so I looked through my collection of
Coast Survey charts to see if I could find the older name and get a
closer date for the name change.
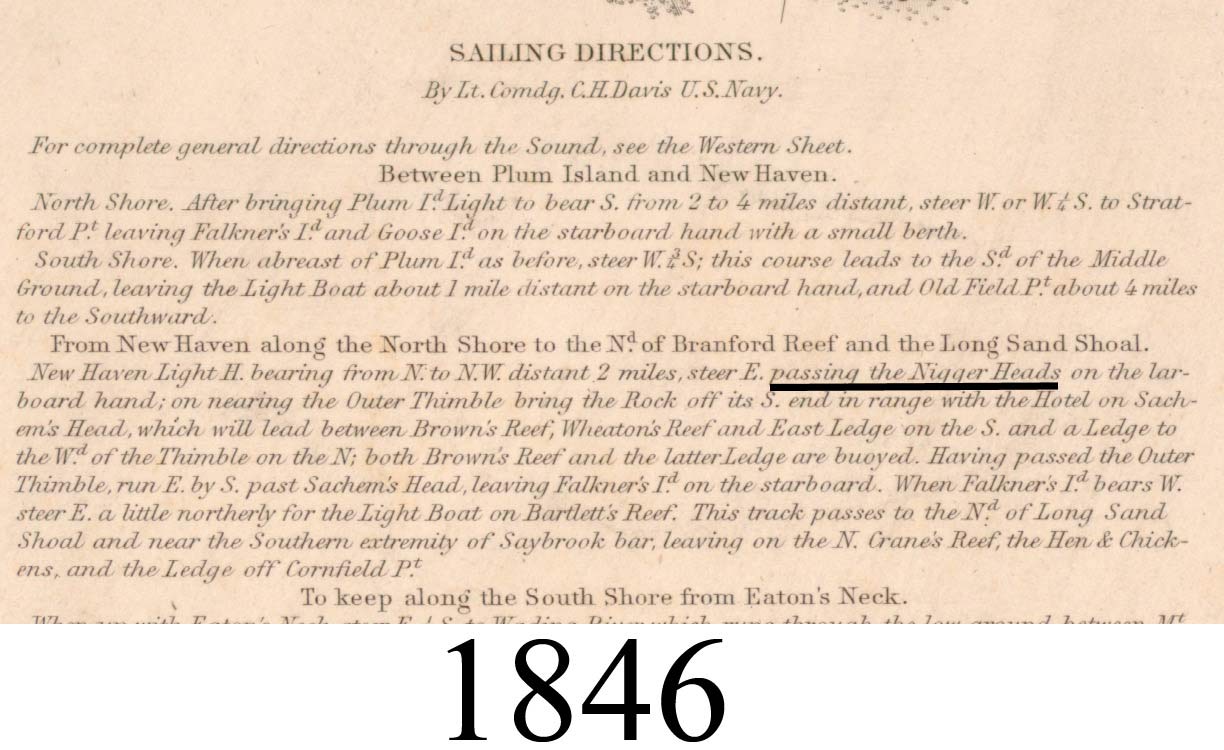
I found the old name (Nigger Heads) in
1846 and the new name in 1855.
I was surprised to find the change made
so early – before the Civil War.
The oldest 80,000 scale chart for the New Haven area is the 1846
chart which covers Long Island Sound from New Haven east to the
Connecticut River.
A closeup view shows that the rocks were called
“Nigger Heads” at that time.
Plum Island to Stratford Shoal 1846 1:80,000
Middle Part of Long Island Sound (USCGS)
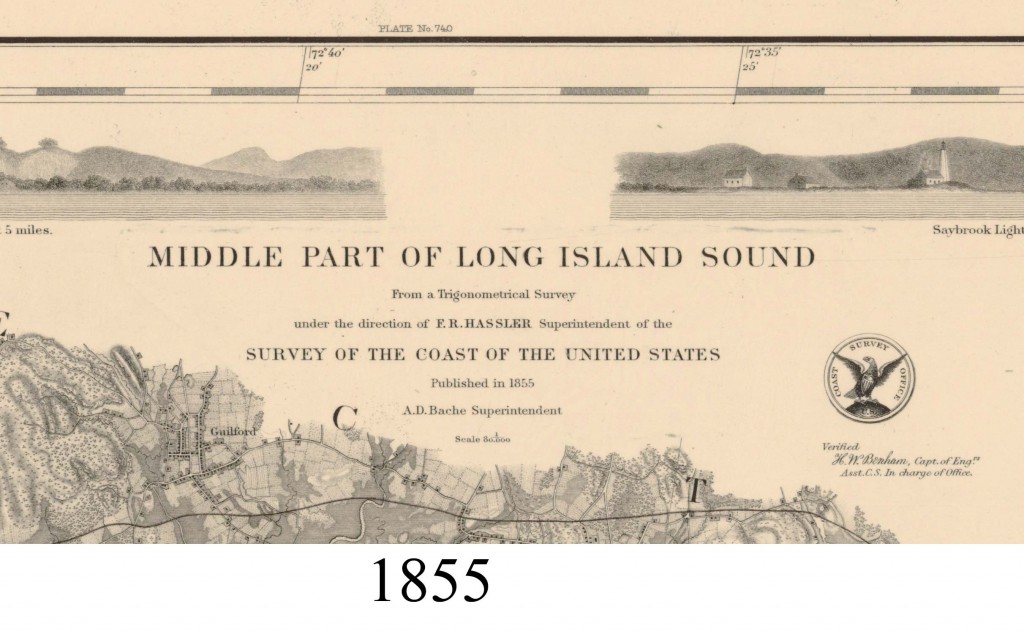
On the 1855 map we see the name change to the current “Negro Heads”.
Plum Island to Stratford Shoal 1855 1:80,000
Middle Part of Long Island Sound (USCGS)
Before I found the evidence, I was imaging that the new name might have
appeared much later in the century during the Reconstruction period.
We
don’t know who made the change, or whether it was the subject of much
discussion at the time. The map’s title tells us that it was published
by the US Coast Survey.
The “Sailing Directions” on each chart had the same usage.
While the official charts showed the new name from 1855 to the present, common usage may not have changed.
Note this 1903 article found online about a sailing trip along the shoreline:
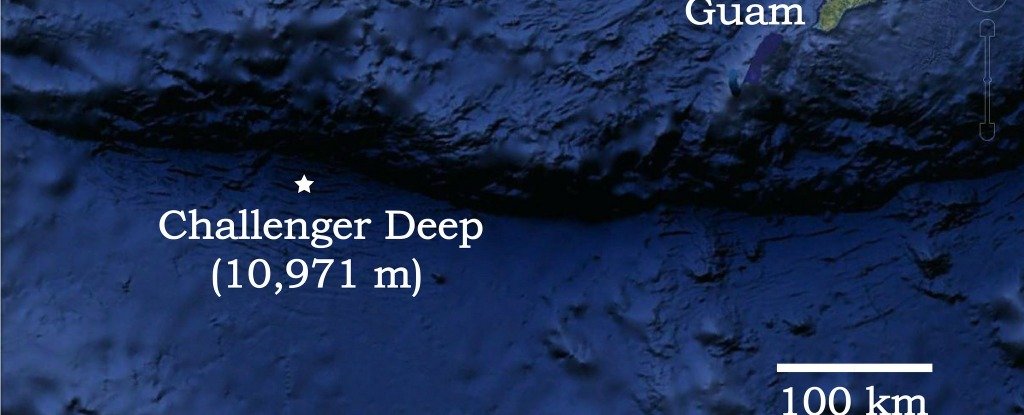
Scientists have released the first audio recordings taken from the deepest point on Earth's surface, Challenger Deep, at the bottom of the Mariana Trench.
Filled with strange moans, low rumbles, and the occasional
high-pitched screech, the soundbites below shed rare light on the dark
world that lies 10.9 km (6.7 miles) below the crushing weight of the
Pacific Ocean... and they're somehow both haunting and beautiful at the
same time.
Mariana Trench with the GeoGarage platform (NGA chart)
On the whole, we know very little about what goes on inside the Mariana Trench, located at the bottom of the Pacific Ocean around 322 km (200 miles) southwest of Guam, mostly because it's so difficult for us to get to.
But Robert Dziak, an oceanographer with the US National Oceanic and Atmospheric Administration (NOAA), figured that even if we couldn't explore the trench ourselves for long periods of time, we might be able to eavesdrop on it.
So his team dropped a titanium-encased hydrophone down to Challenger Deep, the trench's deepest point, and kept it recording for 23 days straight.
Below are some of the strange sounds that came back, including whales calls, which are made by a mix of baleen and toothed (odontocete) whales:
The first thing you'll notice is that, for somewhere with 16,000 pounds per square inch (PSI) of pressure crushing down from above, and where the Sun never shines, the deepest point on Earth is a lot noisier than you'd expect.
That's because sound waves travel an incredibly long way in water, turning Challenger Deep into something of an echo chamber for sounds from miles around.
In one of the recordings you can clearly hear the propellor of a boat travelling across the surface 10.9 km (6.7 miles) away, and another day the researchers captured the distinctive rustling of a category four typhoon raging overhead.
Not to mention the frequent rumbling of earthquakes.
"I was surprised by just how cleanly we can record whales, ships, and all sorts of activity taking place at the surface," Dziak told Maddie Stone over at Gizmodo.
Here's what it sounds like when a boat passes 10.9 km (6.7 miles) over your head:
And here's a magnitude 5 earthquake rumbling near Guam on 16 July 2015:
This is a baleen whale's calls right before and after the same quake:
The hydrophone was able to survive at those depths and continue recording for more than three weeks thanks to clever engineering.
"The pressure at that depth is incredible," said Haru Matsumoto, an engineer from Oregon State University who worked on the hydrophone.
"We had to drop the hydrophone mooring down through the water column at no more than five metres per second to be sure the hydrophone, which is made of ceramic, would survive the rapid pressure change."
But although the soundbites give us fascinating insight into the Mariana Trench, that wasn't the sole purpose of the mission - the NOAA is hoping to use the recordings to establish a baseline for ambient noise in the deepest part of the Pacific Ocean.
That way they can determine in future if human-created noise in the ocean is getting louder, and begin to assess how that might affect marine animals that use sound to communicate, navigate and feed, such as whales and dolphins.
Dziak is now hoping to go back to the Mariana Trench soon to do more recording, and would also love to explore the deep areas of the Arctic Ocean that are beginning to become accessible as the polar ice caps shrink.
"It is akin to sending a deep-space probe to the outer Solar System," Dziak told Gizmodo. "We’re sending out a deep-ocean probe to the unknown reaches of inner space."
Contemplate that while you listen to the call of baleen whale, possibly a humpback or blue whale, echoing in the deepest place on Earth:
China has placed runways and radar facilities on new islets in the South China Sea, built by piling huge amounts of sand onto reefs.
The construction is straining already taut geopolitical tensions.
The speed and scale of China’s
island-building spree in the South China Sea last year alarmed other
countries with interests in the region. After announcing
in June that the process of building seven new islands by moving
sediment from the seafloor to reefs was almost done, China has focused
its efforts on building ports, three airstrips, radar facilities
and other military buildings on the islands. The installations bolster
China’s foothold in the Spratly Islands, a disputed scattering of reefs
and islands in the South China Sea more than 500 miles from the Chinese
mainland. China’s
activity in the Spratlys is a major point of contention between China
and the United States, and has prompted the White House to send Navy destroyers to patrol near the islands twice in recent months.
Sources: C.I.A., NASA, China Maritime Safety Administration
The new islands allow China to harness a portion of the sea for its own use that had been relatively out of reach. Although there are significant fisheries and possible large oil and gas reserves in the South China Sea, China’s efforts serve more to fortify its territorial claims than to help it extract natural resources, said Mira Rapp-Hooper, formerly the director of the Asia Maritime Transparency Initiative at the Center for Strategic and International Studies, a Washington research group. Though they are too small to support large military units, the islands will also enable sustained air and sea patrols, strengthening China’s influence in the area.
Image by DigitalGlobe, via CSIS Asia Maritime Transparency Initiative
Several reefs have been destroyed outright to
serve as a foundation for the new islands, and the process also causes
extensive damage to the surrounding marine ecosystem. Frank
Muller-Karger, professor of biological oceanography at the University of
South Florida, said sediment “can wash back into the sea, forming
plumes that can smother marine life and could be laced with heavy
metals, oil and other chemicals from the ships and shore facilities
being built.” Such plumes threaten the biologically diverse reefs
throughout the Spratlys, which Dr. Muller-Karger said may have trouble
surviving in sediment-laden water.
Although China was a relative latecomer
to construction in the Spratly archipelago, its island building is much
more extensive than similar efforts by other countries in the area. The
recent activity has unsettled the United States, which has about $1.2 trillion in bilateral trade go through the South China Sea every year.Washington does not recognize China’s ownership of the islands, and in February President Obama reiterated
the government's position that “the United States will continue to fly,
sail and operate wherever international law allows.” To reinforce the
message, the United States Navy sent missile destroyers in October and January within 12 nautical miles of the islands, the conventional limit for territorial waters. According to statements from David Shear,
the top Pentagon official in charge of Asia and the Pacific, the last
time before October that the United States had sent ships or aircraft
that close to the islands was in 2012.
Fiery Cross Reef (Yongshu Jiao) with the GeoGarage platform (NGA chart)
Buildings under construction at Fiery Cross Reef, September 2015.
Fiery Cross detailed
What is on the islands
China has built airstrips, ports, radar
facilities, solar arrays, lighthouses and support buildings on the
islands. The airstrips and ports lengthen the reach of Chinese ships and
planes, while the radar facilities allow the country to keep a closer
eye on what is happening nearby. Imagery from January compiled for a recent report by the C.S.I.S. suggests that
China may be constructing a longer-range high-frequency radar
installation on Cuarteron Reef that would help the country monitor air
and ship traffic in the south, farther from the Chinese mainland.
Cuarteron Reef (Huayang Jiao) with the GeoGarage platform (NGA chart)
Fiery Cross Reef is one of China’s most
strategically important new islands, with an airstrip that is long
enough to allow the country to land any plane, from fighter jets to
large transport aircraft.
Two additional airstrips on Mischief Reef and Subi
Reef that China has been building since mid-2015 are nearing
completion, bringing China’s total to three airstrips in the region.
Subi reef (Chu-Pi Chiao) with the GeoGarage plateform (NGA chart)
Though China’s airstrips expand the country’s
ability to operate in the South China Sea, they are not the first in the
region — every other country that occupies the Spratlys already
operates an airstrip as well.
Islands and reefs that have undergone recent construction are shown with a white ring.
Colored rings show whether the feature is occupied by China, the Philippines, Malaysia, Vietnam or Taiwan.
Sources: C.I.A., NASA, China Maritime Safety Administration
Vietnam, Malaysia, the Philippines and Taiwan have
also expanded islands in the Spratlys, but at a much smaller scale than
China’s efforts.
China’s reefs hosted smaller structures for years
before the current surge in construction.
By preserving these initially
isolated buildings, China can claim that it is merely expanding existing facilities, similar to what other countries have done elsewhere in the region.
Image by DigitalGlobe, via CSIS Asia Maritime Transparency Initiative
U.S. Chart No. 1 Over 100 pages of valuable information on nautical chart symbols U.S. Chart No. 1 describes the symbols, abbreviations and terms used on
As a responsible boater, you examine your nautical chart before
sailing, determined to avoid problems during a nice trip along the
coast.
Charts are packed with symbols and abbreviations, so you might
refer to the free copy of U.S. Chart No. 1,
which lists all of the symbols used on NOAA nautical charts.
It is an
excellent quick reference for identifying unfamiliar symbols.
However, sometimes mariners need a deeper understanding…
Coast Survey is now providing additional information about complex or
particularly confusing chart symbols to augment what is available in
U.S. Chart No. 1.
The first two tip sheets are available now.
Coast
Survey will add more chart symbology tip sheets to the U.S. Chart No. 1 webpage as the need arises.
Fish havens: The typical U.S. Chart No. 1 entry, such as this one for fish haven, lists only the name and the symbols.
The tip sheet
explains what fish havens are, what they look like in context with
other charted features, and what restrictions may apply to them.
Anchorages and harbors of refuge:
The anchor symbol has been used for decades to represent an anchorage
on U.S. nautical charts, but the specific meaning of the symbol has
evolved over the years.
The tip sheet explains what the symbol means now – and, perhaps more importantly, what it doesn’t mean.
Endeavour challenged for the 1934 America's Cup and raced New York Yacht Club defender Rainbow. However, the campaign was blighted by a strike of Sopwith's professional crew prior to departing for America. Forced to rely mainly on keen amateurs, who lacked the necessary experience, the campaign failed.
Rainbow won with 4–2. This was one of the most contentious of the America's Cup battles and prompted the headline "Britannia rules the waves and America waives the rules." The mighty J-class is still being sailed today and can be seen in a
classic regatta which will be held along with America's Cup in Bermuda
2017.