Saturday, April 20, 2024

These photos show AI used to reinterpret centuries-old graffiti


Reinterpretations of the etchings
Matthew Attard and Galleria Michela Rizzo


From NewScientist by Christian House

Artist Matthew Attard turned to eye-tracking technology to generate a fresh take on images of ships carved by seafarers on chapels in Malta hundreds of years ago

At the 60th Venice Biennale, Maltese artist Matthew Attard addresses his country’s maritime heritage, along with notions of faith and progress, through the prism of AI-driven technology.
His work focuses on images of ships that were graffitied by seafarers on the stone facades of chapels in Malta between the 16th and 19th centuries, one of which is pictured below.


Ship graffito at Our Lady of the Visitation Chapel, Wied Qirda – Żebbuġ, Malta
Elyse Tonna


Attard, pictured below, retraced the incised lines of the hulls, rigging and billowing sails using his gaze, in a process facilitated by an eye-tracking device and generative algorithms. 
“This gaze was translated into data points by the technology, which were then further interpreted to generate lines or drawings,” he says.

A database of digital images generated from the data points captured the engravings from various perspectives, from which artworks such as 3D scans and video pieces were created.


Matthew Attard with an eye-tracking device.
Elyse Tonna


The maritime graffiti resonates with cultures whose relationship with the sea has been – and still is – crucial, where the ship remains a metaphor for hope and survival.
Similarly, Maltese chapels have long been places of sanctuary.
Attard says he wanted to explore “parallels with our current ‘blind faith’ in digital technology”.

His reinterpretations of the etchings are ghostlike, skeletal impressions, as shown in the main image. “One could argue that even the most traditional mediums, such as a pencil or a piece of charcoal, can be considered a form of drawing technology,” he notes.
His show is at the Malta Pavilion at the Venice Biennale, Italy, commissioned by Arts Council Malta, until 24 November.

Friday, April 19, 2024

What are China’s long- term Antarctic ambitions?

Russia and China repeatedly rejected new marine protection areas in Antarctica
Main image courtesy of Unsplash user Derek Oyen.

From The Interpreter by Benjamin J. Sacks & Peter Dortmans

The recent opening of China’s Qinling base, its third permanent Antarctic station, has worried some Australian and American observers.
Their concerns suggest it may be time for Australia to delineate China’s Antarctic ambitions more clearly and better organise its response.

Qinling station
Image Credit : China News Service - CC BY 3.0
 
Qinling is China’s first base located adjacent to the Ross Sea, south of Australia and New Zealand and near the US McMurdo base.
Its satellite monitoring facility has raised Western apprehensions.
Qinling could become another node in China’s People’s Liberation Army-affiliated BeiDou navigation network and be used to monitor Australian and New Zealand communications.
Antarctica’s sheer remoteness and extreme climate limit its potential for Chinese military activities, at least with existing technology.

Some of Beijing’s own statements have supported these concerns, with China’s National Defense University’s Science of Military Strategy (2020) stating that “the polar regions have become an important direction for our country’s interests to expand overseas and far frontiers, and it has also proposed new issues and tasks for the use of our country’s military power”.
Elizabeth Buchanan notes that the Chinese government’s civil-military fusion law requires “all civilian research activities…to have military application or utility for China.
This extends to China’s Antarctic footprint”.

Qinling is China’s newest station to begin operations in Antarctica.
Concerns raised about China’s new research station in Antarctica : 
Qinling research station in Antarctica could intercept signals from Australia 
(ABC News: Erwin Renaldi)

While experts should be concerned, they might be worried for the wrong reasons.
Claire Young has stressed that Antarctica’s sheer remoteness and extreme climate limit its potential for Chinese military activities, at least with existing technology.
She argues that Qinling is simply too distant from Australia and New Zealand to effectively monitor their communications.
China could more easily monitor from neighbouring states or its disputed South China Sea artificial islands.

A 2023 RAND study, while acknowledging the potential military risks posed by China’s Antarctic activities, added that Chinese officials have affirmed their respect for the 1959 Antarctic Treaty and subsequent protocols, collectively known as the Antarctic Treaty System.
The Madrid Protocol, for instance, banned Antarctic mining.
China is a signatory.
 
 
The Ross Sea Marine Protected Area includes a (1) General Protection Zone; (2) Special Research Zone; and (3) Krill Research Zone (Wikimedia Commons)

What, then, are China’s long-term ambitions? Buchanan has argued that, in the Antarctic semi-regulated global commons, “presence equals power”.
RAND, through an examination of both English- and Chinese-language sources, concluded that Beijing seeks a “right to speak” in Antarctic regional affairs and that this could be part of China’s efforts to shift the balance of Antarctic influence in its favour ahead of any future Antarctic Territory renegotiation.

These efforts appear to be driven primarily by economics, especially in regard to krill fishing and mining, both of which fall under China’s vague goal of Antarctic “utilisation”.
Along with Russia, China’s long-distance fishing fleet – the world’s largest – is rapidly expanding its krill industry, deploying super trawlers in the name of scientific research (in krill research zones) that will eventually collect more krill than is allowed under the Antarctic Territory System.

Both Russia and China have repeatedly rejected new marine protection areas and are likely to continue growing their lucrative fishing industries.
China has so far resisted other signatories’ efforts to rein in its fishing ambitions.
While other signatories are willing to abide by the limits imposed by the Antarctic Territory System, China and Russia appear to want to ignore them.
Australia and its allies and partners should publicly “name-and-shame” China’s activities when and if they violate the Antarctic Territory System.
 
People attend the launch ceremony of China's first domestically built polar icebreaker, Xuelong 2, or Snow Dragon 2, at a shipyard in Shanghai, Sept. 10, 2018.

Similarly, China is eager to undertake onshore and offshore mineral extraction in Antarctica, despite being a signatory to the 1991 Madrid Protocol, which bans such activities.
Some experts posit that in the future, China may be able to develop advanced mining technologies in anticipation of the Protocol’s potential 2048 renegotiation where it may seek to legalise some forms of mining.
As the Antarctic Territory System currently has no enforcement mechanism, RAND added that Chinese Antarctic mining activities could consequently open “the floodgates for similar activities”.

Given that any signatory can call for the Antarctic Treaty’s renegotiation at any time – a privilege China has yet to invoke – it appears Beijing is biding its time while diversifying its Antarctic presence.
Under this reasoning, China’s recent actions, including the opening of Qinling base, constitute long-term shaping activities to place itself in the strongest position possible ahead of any changes to the Treaty.

How should Australia and its allies and partners respond? Some observers have highlighted the Antarctic Territory System’s provision for unannounced inspections as key to mitigating Chinese ambitions.
However, Russia has demonstrated that it can block inspections by making “station runways inaccessible” and switching off station radios “to block parties landing”.

Nengye Liu has suggested that Australia update its 2009 Australia–China Joint Statement to explicitly ensure the peaceful stability of bilateral Antarctic relations, given China’s significant Australian Antarctic Territory presence.
Australia and its allies and partners should publicly “name-and-shame” China’s activities when and if they violate the Antarctic Territory System.
Australia should consider sanctions against relevant Chinese individuals, state-owned enterprises, and the Polar Research Institute of China.

Given the uncertainties of Antarctica’s geopolitical future, as evidenced by growing concerns over China’s regional activities and ambitions, it may be time for the Australian Department of Foreign Affairs and Trade to establish its own Antarctic Affairs office.
Such an office could be charged with establishing Australia’s future strategy and contingencies, working across government to implement its official position, and negotiating and building an international consensus with allies and partners.

Links :

Thursday, April 18, 2024

NASA’s PACE data on Ocean, Atmosphere, Climate now available


NASA’s PACE satellite’s Ocean Color Instrument (OCI) detects light across a hyperspectral range, which gives scientists new information to differentiate communities of phytoplankton – a unique ability of NASA’s newest Earth-observing satellite.
This first image released from OCI identifies two different communities of these microscopic marine organisms in the ocean off the coast of South Africa on Feb. 28, 2024.
The central panel of this image shows Synechococcus in pink and picoeukaryotes in green.
The left panel of this image shows a natural color view of the ocean, and the right panel displays the concentration of chlorophyll-a, a photosynthetic pigment used to identify the presence of phytoplankton.
Credit: NASA 

From NASA by Erica McNamee

NASA is now publicly distributing science-quality data from its newest Earth-observing satellite, providing first-of-their-kind measurements of ocean health, air quality, and the effects of a changing climate.

 
The data from PACE (Plankton, Aerosol, Cloud, ocean Ecosystem) will help us better understand how the ocean and atmosphere exchange carbon dioxide. In addition, it will reveal how aerosols might fuel phytoplankton growth in the surface ocean. Novel uses of PACE data will benefit our economy and society. For example, it will help identify the extent and duration of harmful algal blooms. PACE will extend and expand NASA's long-term observations of our living planet. By doing so, it will take Earth's pulse in new ways for decades to come.
 
The Plankton, Aerosol, Cloud, ocean Ecosystem (PACE) satellite was launched on Feb. 8, and has been put through several weeks of in-orbit testing of the spacecraft and instruments to ensure proper functioning and data quality.
The mission is gathering data that the public now can access at
 https://pace.oceansciences.org/access_pace_data.htm.

PACE data will allow researchers to study microscopic life in the ocean and particles in the air, advancing the understanding of issues including fisheries health, harmful algal blooms, air pollution, and wildfire smoke.
With PACE, scientists also can investigate how the ocean and atmosphere interact with each other and are affected by a changing climate.

“These stunning images are furthering NASA’s commitment to protect our home planet,” said NASA Administrator Bill Nelson.
“PACE’s observations will give us a better understanding of how our oceans and waterways, and the tiny organisms that call them home, impact Earth.
From coastal communities to fisheries, NASA is gathering critical climate data for all people.”

“First light from the PACE mission is a major milestone in our ongoing efforts to better understand our changing planet.
Earth is a water planet, and yet we know more about the surface of the moon than we do our own oceans.
PACE is one of several key missions – including SWOT and our upcoming NISAR mission – that are opening a new age of Earth science,” said Karen St. Germain, NASA Earth Science Division director.


PACE’s OCI instrument also collects data that can be used to study atmospheric conditions.
The top three panels of this OCI image depicting dust from Northern Africa carried into the Mediterranean Sea, show data that scientists have been able to collect in the past using satellite instruments – true color images, aerosol optical depth, and the UV aerosol index.
The bottom two images visualize novel pieces of data that will help scientists create more accurate climate models.
Single-Scattering Albedo (SSA) tells the fraction of light scattered or absorbed, which will be used to improve climate models.
Aerosol Layer Height tells how low to the ground or high in the atmosphere aerosols are, which aids in understanding air quality.
Credit: NASA/UMBC


The satellite’s Ocean Color Instrument, which was built and managed by NASA’s Goddard Space Flight Center in Greenbelt, Maryland, observes the ocean, land, and atmosphere across a spectrum of ultraviolet, visible, and near infrared light.
While previous ocean color satellites could only detect a handful of wavelengths, PACE is detecting more than 200 wavelengths.
With this extensive spectral range, scientists can identify specific communities of phytoplankton.
Different species play different roles in the ecosystem and carbon cycle — most are benign, but some are harmful to human health — so distinguishing phytoplankton communities is a key mission of the satellite.

PACE’s two multi-angle polarimeters, HARP2 and SPEXone, measure polarized light that has reflected off clouds and tiny particles in the atmosphere.
These particles, known as aerosols, can range from dust to smoke to sea spray and more.
The two polarimeters are complementary in their capabilities.
SPEXone, built at the Netherlands Institute for Space Research (SRON) and Airbus Netherlands B.V., will view Earth in hyperspectral resolution – detecting all the colors of the rainbow – at five different viewing angles.
HARP2, built at the University of Maryland, Baltimore County (UMBC), will observe four wavelengths of light, with 60 different viewing angles.


Early data from the SPEXone polarimeter instrument aboard PACE show aerosols in a diagonal swath over Japan on Mar. 16, 2024, and Ethiopia on Mar. 6, 2024.
In the top two panels, lighter colors represent a higher fraction of polarized light.
In the bottom panels, SPEXone data has been used to differentiate between fine aerosols, like smoke, and coarse aerosols, like dust and sea spray.
SPEXone data can also measure how much aerosols are absorbing light from the Sun.
Above Ethiopia, the data show mostly fine particles absorbing sunlight, which is typical for smoke from biomass burning.
In Japan, there are also fine aerosols, but without the same absorption.
This indicates urban pollution from Tokyo, blown toward the ocean and mixed with sea salt.
The SPEXone polarization observations are displayed on a background true color image from another of PACE’s instruments, OCI.
Credit: SRON


With these data, scientists will be able to measure cloud properties — which are important for understanding climate — and monitor, analyze, and identify atmospheric aerosols to better inform the public about air quality.
Scientists will also be able to learn how aerosols interact with clouds and influence cloud formation, which is essential to creating accurate climate models.


Early images from PACE’s HARP2 polarimeter captured data on clouds over the west coast of South America on Mar. 11, 2024.
The polarimetry data can be used to determine information about the cloud droplets that make up the cloudbow – a rainbow produced by sunlight reflected by cloud droplets instead of rain droplets.
Scientists can learn how the clouds respond to man-made pollution and other aerosols and can measure the size of the cloud droplets with this polarimetry data.
Credit: UMBC


“We’ve been dreaming of PACE-like imagery for over two decades.
It’s surreal to finally see the real thing,” said Jeremy Werdell, PACE project scientist at NASA Goddard.
“The data from all three instruments are of such high quality that we can start distributing it publicly two months from launch, and I’m proud of our team for making that happen.
These data will not only positively impact our everyday lives by informing on air quality and the health of aquatic ecosystems, but also change how we view our home planet over time.”

The PACE mission is managed by NASA Goddard, which also built and tested the spacecraft and the ocean color instrument.
The Hyper-Angular Rainbow Polarimeter #2 (HARP2) was designed and built by the University of Maryland, Baltimore County, and the Spectro-polarimeter for Planetary Exploration (SPEXone) was developed and built by a Dutch consortium led by Netherlands Institute for Space Research, Airbus Defence, and Space Netherlands.
 
Links :

Wednesday, April 17, 2024

How NASA spotted El Niño changing the saltiness of coastal waters


Rivers can flush rainwater over hundreds of miles to the sea, changing the makeup of coastal waters in ways that scientists are still discovering.
In this satellite image from December 2023, a large, sediment-rich plume from the Mississippi River spreads down the Gulf Coast of Louisiana and Texas following winter rains.
NASA/OB.DAAC 

From NASA by Sally Younger

New findings have revealed a coastal realm highly sensitive to changes in runoff and rainfall on land.

After helping stoke record heat in 2023 and drenching major swaths of the United States this winter, the current El Niño is losing steam this spring.
Scientists have observed another way that the climate phenomenon can leave its mark on the planet: altering the chemistry of coastal waters.

A team at NASA’s Jet Propulsion Laboratory in Southern California used satellite observations to track the dissolved salt content, or salinity, of the global ocean surface for a decade, from 2011 to 2022.
At the sea surface, salinity patterns can tell us a lot about how freshwater falls, flows, and evaporates between the land, ocean, and atmosphere – a process known as the water cycle.

The JPL team showed that year-to-year-variations in salinity near coastlines strongly correlate with El Niño Southern Oscillation (ENSO), the collective term for El Niño and its counterpart, La Niña.
ENSO affects weather around the world in contrasting ways.
El Niño, linked to warmer-than-average ocean temperatures in the equatorial Pacific, can lead to more rain and snowfall than normal in the southwestern U.S., as well as drought in Indonesia.
These patterns are somewhat reversed during La Niña.

During the exceptional El Niño event of 2015, for example, the scientists traced a particularly distinct global water cycle effect: Less precipitation over land led to a decrease in river discharge on average, which in turn led to notably higher salinity levels in areas as far as 125 miles (200 kilometers) from shore.

At other times, the opposite was found: Areas with higher-than-normal rainfall over land saw increased river discharge, reducing salinity near those coasts.
“We’re able to show coastal salinity responding to ENSO on a global scale,” said lead author Severine Fournier, an ocean physicist at JPL.

The team found that salinity is at least 30 times more variable in these dynamic zones near coasts than in the open ocean.
The link between rain, rivers, and salt is especially pronounced at the mouths of large river systems such as the Mississippi and Amazon, where freshwater plumes can be mapped from space as they gush into the ocean. 

Salt as Signal

With global warming, researchers have been observing changes in the water cycle, including increases in extreme precipitation events and runoff.
At the intersection of land and sea, coastal waters may be where the impacts are most detectable.

“Given the sensitivity to rainfall and runoff, coastal salinity could serve as a kind of bellwether, indicating other changes unfolding in the water cycle,” Fournier said.

She noted that some of the world’s coastal waters are not well studied, despite the fact that about 40% of the human population lives within about 60 miles (100 kilometers) of a coastline.
One reason is that river gauges and other on-sitemonitors can be costly to maintain and cannot provide coverage of the whole planet, especially in more remote regions.

That’s where satellite instruments come in. Launched in 2011, the Aquarius mission made some of the first space-based global observations of sea surface salinity using extremely sensitive radiometers to detect subtle changes in the ocean’s microwave radiation emissions.
Aquarius was a collaboration between NASA and Argentina’s space agency, CONAE (Comisión Nacional de Actividades Espaciales).

Today, two higher-resolution tools – the ESA (European Space Agency) Soil Moisture and Ocean Salinity (SMOS) mission and NASA’s Soil Moisture Active Passive (SMAP) mission – allow scientists to zoom to within 25 miles (40 kilometers) of coastlines.

Using data from all three missions, the researchers found that surface salinity in coastal waters reached a maximum global average (34.50 practical salinity units, or PSU) each March and fell to a minimum global average (34.34 PSU) around September.
(PSU is roughly equal to parts per thousand grams of water.) River discharge, especially from the Amazon, drives this timing.

In the open ocean, the cycle is different, with surface salinity reaching a global average minimum (34.95 PSU) from February to April and a global average maximum (34.97 PSU) from July to October. The open ocean does not show as much variability between seasons or years because it contains a significantly larger volume of water and is less sensitive to river discharge and ENSO.
Instead, changes are governed by planet-scale precipitation minus total global evaporation, plus other factors like large-scale ocean circulation. 
 
Links : 

Tuesday, April 16, 2024

Rogue waves in the ocean are much more common than anyone suspected, says new study


From The Conversation by Alessandro Toffoli


We used three-dimensional imaging of ocean waves to capture freakish seas that produce a notorious phenomenon known as rogue waves.
Our results are now published in Physical Review Letters*.

Rogue waves are giant colossi of the sea – twice as high as neighbouring waves – that appear seemingly out of nowhere.
Stories of unimaginable mountains of water as tall as ten-storey buildings have populated maritime folklore and literature for centuries.

Recent technology has allowed scientists to spot rogue waves out at sea, making legend become reality.
The first and most famous measurement was of the Draupner wave, a 25.6-metre monster recorded in the North Sea on January 1 1995.

Despite observations, we still don’t know how often rogue waves occur, or if we can predict them.
A record of a rogue wave doesn’t include specific features that distinguish the sea around it, so we can’t make comparisons or predict the conditions needed.

Our team set sail on the South African icebreaker S.A. Agulhas-II to chase rogue waves across the Southern Ocean, where mighty winds shape Earth’s fiercest waves.


Ocean surface during a storm somewhere in the Southern Ocean.
Alessandro Toffoli

What creates rogue waves?


In the random environment of ocean waves, several mechanisms give rise to rogue ones.
One primary source involves the overlap of multiple waves at the same location and time.
This results in concentrated energy, leading to tall waves.

Under consistent ocean conditions, rogue waves generated this way may occur once every two days at a set location.
But the ocean is dynamic, so conditions are rarely consistent for long – making it less likely for rogue waves to occur.
The overlap of waves may be minimal or non-existent even during prolonged and intense storms.

Numerical and laboratory studies suggest strong winds also contribute to the development of rogue waves, because they push harder on some already tall wave forms.
But wind has seldom been considered in rogue wave analysis.
 

A simplified anatomy of ocean waves.

Wind prompts ocean waves to grow progressively higher, longer and faster.
During this stage, waves are “young” and hungry for wind input.
When waves go faster than wind, they stop being accelerated by it and reach a “mature” stage of full development.

Through this process, the wind creates a chaotic situation where waves of different dimensions and directions coexist.

Our recent observations show that unique sea conditions with rogue waves can arise during the “young” stage – when waves are particularly responsive to the wind.
This suggests wind parameters could be the missing link.
However, there’s even more to consider.
 
Powerful waves amplify each other

Ocean waves are one of the most powerful natural forces on Earth and could become even more powerful in the future due to climate change.
If the wave field possesses an extreme amount of energy – when waves are steep and most of them have a similar amplitude, length and direction – another mechanism can trigger the formation of rogue waves.

This mechanism involves an exchange of energy between waves that produces a “self-amplification”, where one wave grows disproportionately at the expense of its neighbours.
Theoretically, studies show this could increase the likelihood of rogue waves ten-fold.

While self-amplification manifests as whitecaps – frothy, aerated crests of choppy waves – until now there has been no evidence it can make rogue waves more likely in the ocean.

Recent experiments suggest wind can make extreme events like rogue waves more common.
But this aspect has not been thoroughly explored.

The most extreme 'rogue wave' on record has just been confirmed in the North Pacific Ocean. 
Picture: AP
 
 What did we find in the Southern Ocean?

We used a new three-dimensional imaging method for scanning the ocean surface throughout the expedition.
It mimics human vision: closely located sensors record sequences of simultaneous images.
Computer algorithms then match pairs of them to reconstruct the three-dimensional depths – the wavy surface.

Example of the three-dimensional ocean surface reconstructed from synchronised images.
Hans Clarke

As our ship passed through several storms, the sensors captured data during various phases of wave growth – from the early stages of young waves fuelled by the wind, to mature waves that aren’t influenced by it.

Our results show young waves display signs of self-amplification and an increased likelihood of rogue waves.
We recorded waves twice as high as their neighbours once every six hours.

This mirrors what lab models have reported: sea conditions theoretically more prone to self-amplification would produce more rogue waves.

In contrast, mature seas don’t show an increased probability of rogue waves.
We detected none under those conditions.

Our findings challenge previous thinking: that self-amplification doesn’t change the likelihood of rogue waves in the ocean.
We have also shown that when developing tools for predicting rogue waves, we need to take wind into thorough consideration.
After all, it’s a natural feature of the open sea.
 
Links :

Monday, April 15, 2024

Illuminating the 'Shadows of the Sea' - How Theia exposes Russian maneuvers amidst global sanctions

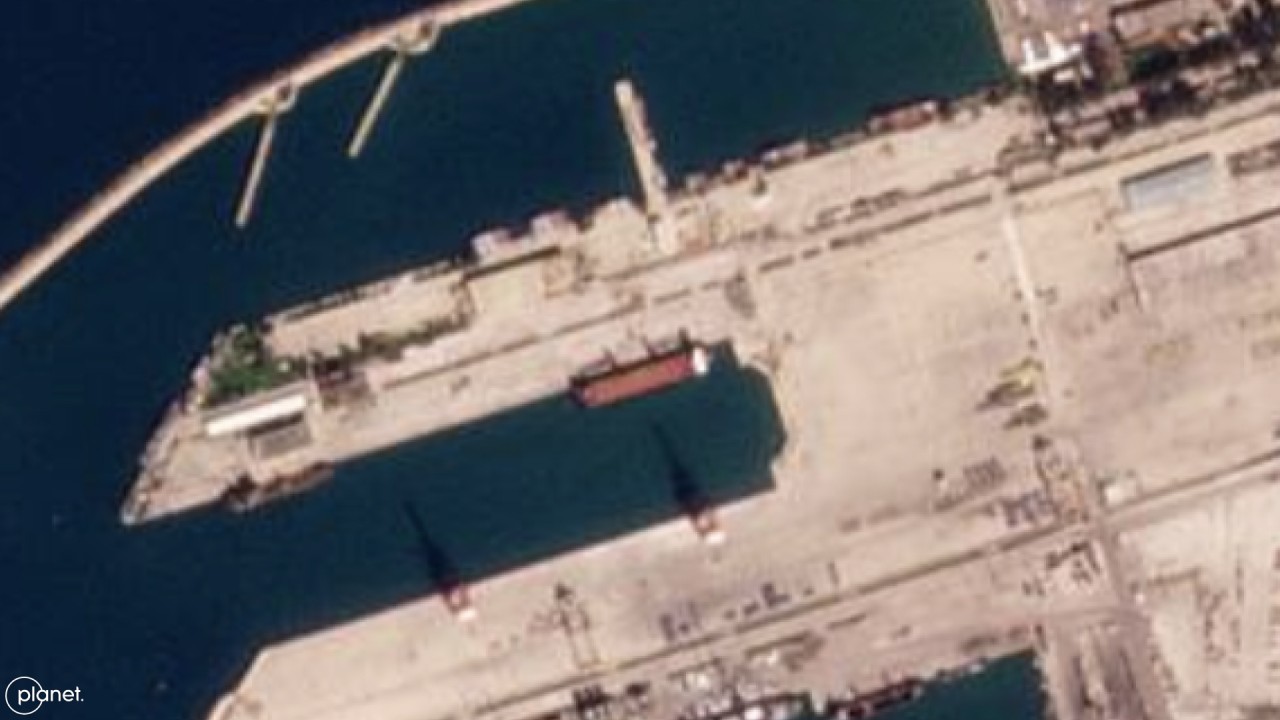
URSA MAJOR (IMO 9538892) at Tartus Port, Syria.

From Pulse by SynMax
 
SynMax will use its artificial intelligence technology combined with Planet’s satellite data to support maritime tracking of illegal fishing, illicit ship-to-ship transfers, and vessel spoofing via a new vessel tracking product called Project Theia.
 
Since November 2023, SynMax’s maritime domain awareness platform, Theia, has detected, attributed, and tracked the locations of three Russian-flagged vessels: the general cargo ships URSA MAJOR (IMO 9538892) and SPARTA IV (IMO 9743033) and the oil/ chemical tanker YAZ (IMO 9735323).
The SPARTA IV is owned by SC South LLC, a Russian Ministry of Defense shipping company subsidiary.
The UK, Ukraine, and the US have sanctioned the vessels for “delivering maritime goods on behalf of the Russian Ministry of Defence.”

As a result of Russia’s involvement in the Syrian civil war, a significant quantity of Russian heavy military equipment is located in Syria.
As the Ukrainian war drags on, Russia’s equipment shortfalls have necessitated the mass transportation of military equipment from Syria to Sevastopol, Crimea, which is the closest port to the frontlines under Russian control.

Unfortunately for Russia, at the request of Ukraine, Turkey exercised the 1936 Montreux Convention on the 28th of February, 2022, banning Russian warships from entering the Black Sea via the Bosphorus and Dardanelles straits.
This was later revised to allow Russian warships access if they were returning to a home port in the Black Sea, but it left a significant shortfall between Russia’s transport capabilities and its requirements.

As a result, Russia has utilized vessels in its civilian fleet to transport military equipment, including the URSA MAJOR, SPARTA IV, and YAZ.
A Royal United Services Institute (RUSI Europe) report has claimed that the SPARTA IV “serves as an auxiliary vessel for the Russian military.” As such, it could be argued that Russia is acting in contravention of the Montreux Convention.
Ukraine is confident that the SPARTA IV is a Russian military transport, so much so that they unsuccessfully attempted to attack the ship with an uncrewed surface vessel (USV) on the 4th of August, 2023.

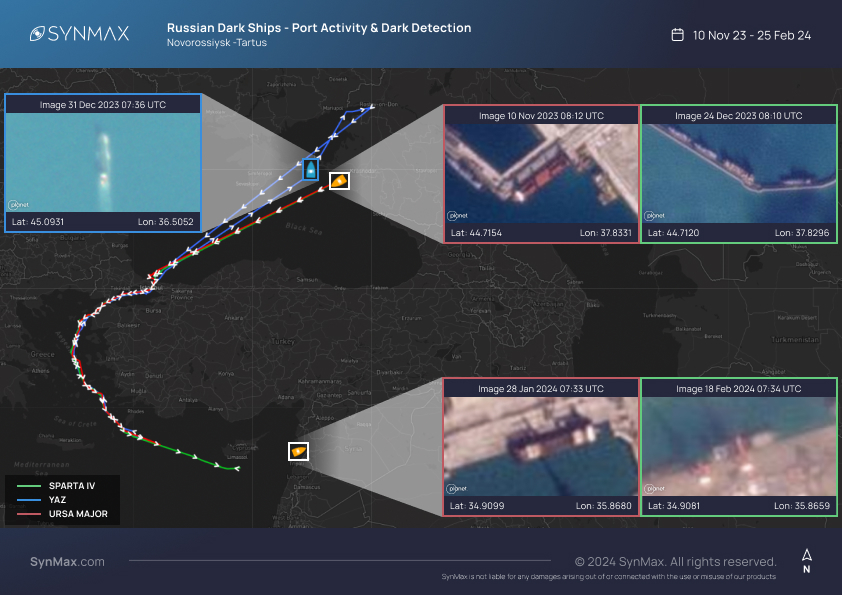
Theia collected imagery of the vessels transiting from Novorossiysk Port, Russia, to Tartus military port, Syria, through the Bosphorus and Dardanelles straits.

Theia detected and attributed the URSA MAJOR AIS dark at a military berth in Novorossiysk Port on the 10th of November, 2023.
The URSA MAJOR remained dark, transiting across the Black Sea until the 3rd of December 2023, when she began emitting AIS transmissions at the mouth of the Bosphorus Strait.
The URSA MAJOR continued to transmit while transiting through the Bosphorus and Dardanelles Straits, turning off her AIS before entering the Mediterranean.
She remained AIS dark for a further three months.


The SPARTA IV was sighted at the same military berth at Novorossiysk Port on the 24th of December, 2023, before she carried out the same AIS dark journey across the Black Sea to reappear at the mouth of the Bosphorus Strait on the 28th of December, 2023.
It is assessed that the vessels turned off their AIS to avoid the Ukrainian drone threat faced by Russian ships in the Black Sea, and again in the Mediterranean to hide their destination- Tartus Port.
Theia observed the URSA MAJOR and SPARTA IV AIS dark, transferring cargo in Tartus Port.

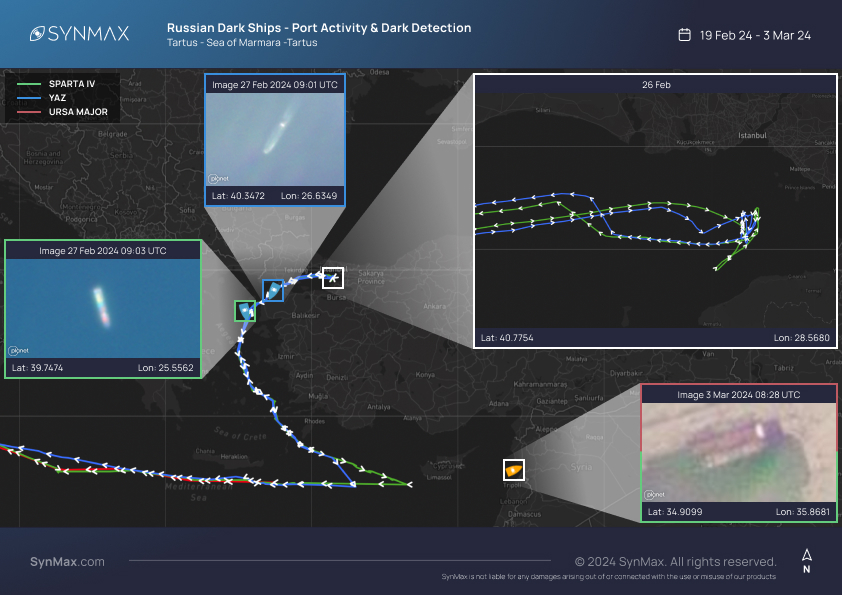
On the 24th of February, 2024, the YAZ and the SPARTA IV transited north with AIS on for what appeared to be the return journey to Novorossiysk.
On the 26th of February, both vessels approached the entrance to the Bosphorus Strait, pausing for 13 hours before unexpectedly returning south.
It has been suggested that the vessels were deterred by the threat of Ukrainian USVs, which have been responsible for the destruction of multiple Russian warships, including the SERGEY KOTOV on the 4th of March, and resulted in the dismissal of Adm Nikolai Yevmenov, ex-Commander of the Russian Navy.


On the 3rd of March, the AIS dark URSA MAJOR and SPARTA IV were detected at Tartus Port, imaged alongside one another.
The URSA MAJOR was assessed to have concluded her cargo transfer.
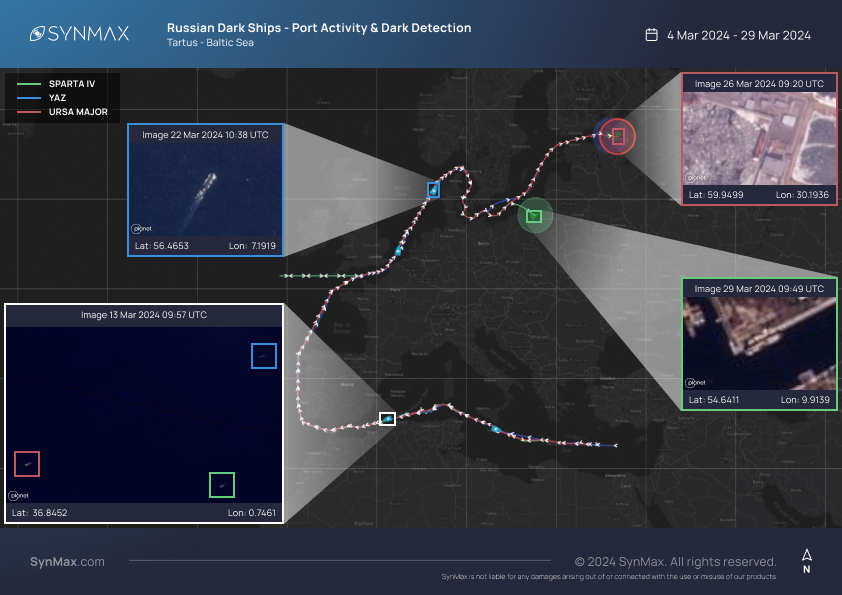
On the 5th of March, the URSA MAJOR, SPARTA IV, and YAZ resumed AIS transmissions, making their way across the Mediterranean, transiting through the Strait of Gibraltar before continuing through the English Channel, North Sea, and Baltic Sea.


The SPARTA IV arrived in Baltiysk, Russia, on the 22nd of March.
At 19:50 UTC, she came alongside a civilian cargo berth before turning off her AIS at 21:30 UTC.
Despite this being the apparent conclusion to her journey, Theia detected the SPARTA IV engaging in loading/ unloading activity at a military berth on the 29th of March.

The URSA MAJOR arrived at an anchorage 50km from St Petersburg, Russia, on the 23rd of March before transiting to Mpp Bol’shoy customs port, St Petersburg, where she remains.
The YAZ arrived at the same anchorage as the URSA MAJOR, 50km from St Petersburg, on the 27th of March at 10:28 before turning off her AIS at 15:46 UTC.

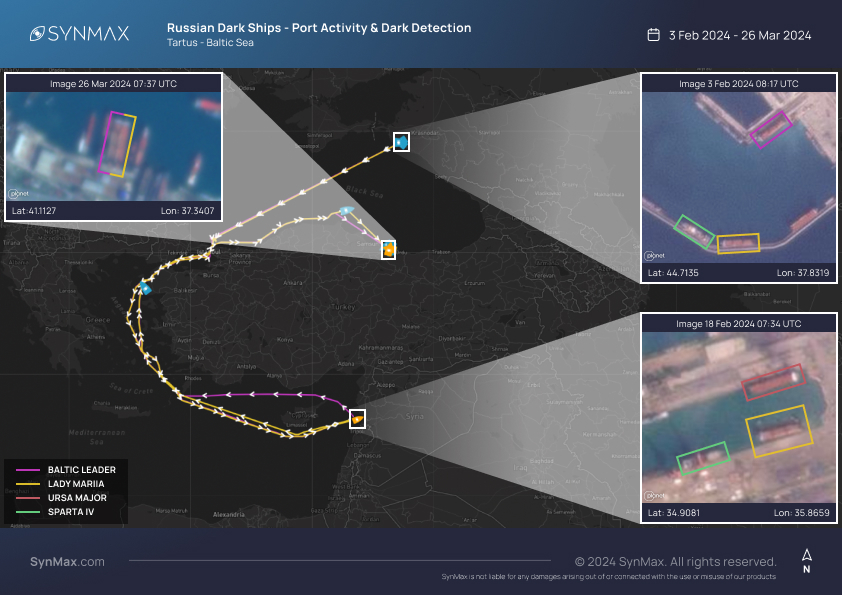
During the same reporting period, Theia identified two other vessels engaging in similar activity.
Russian flagged Ro-Ro vessels, the BALTIC LEADER (IMO: 9220639) and the LADY MARIIA (IMO: 9220641), were captured at Novorossiysk alongside the SPARTA IV on the 3rd of February 2024.
The LADY MARIIA was detected again as she came alongside the URSA MAJOR and SPARTA IV at Tartus military port on 18th February.
The LADY MARIIA was AIS dark at the time of detection, although she didn’t adopt the same AIS tactics as the URSA MAJOR and SPARTA IV during their voyages to Tartus.


Unlike the URSA MAJOR and SPARTA IV, both vessels sailed to Unye Port, Turkey, where they remain.

Theia specializes in data fusion.
Ingesting Automatic Identification System (AIS) data and 20,000,000 km2 of electro-optical imagery daily, Theia’s proprietary AI extracts actionable intelligence from the terabytes of data, producing genuinely scalable, automatic maritime surveillance.

Theia’s extensive imagery archives mean that regardless of when a vessel raises red flags or suspicions, its past activity can be proven conclusively.
Imagery ties a ship to a specific time and a place with a certainty that synthetic dots on a map cannot replicate.

Without AI analysis of millions of square kilometers of satellite imagery, these detections would not have been possible without a significant expenditure of person-hours.
Instead, SynMax's analysts spend minutes verifying.
Data fusion is the key to understanding big intelligence problems.
AI is a powerful tool for investigators to make sense of big data, significantly scaling up analysts' reach and understanding.

Links :

Sunday, April 14, 2024

Illuminating the seafloor


Teamwork between a deep-sea robot and a human occupied submarine recently led to the discovery of five new hydrothermal vents on the seafloor of the eastern Tropical Pacific Ocean.
Scientists mapped the area at night using the undersea robot Sentry, an autonomous underwater vehicle (AUV) operated by WHOI and the National Deep Submergence Facility (NDSF) and funded by NSF.
After Sentry was recovered each morning, high-resolution maps from the vehicle’s sensors were then used to plan the day’s dive by the human-occupied vehicle Alvin also operated by WHOI-NDSF, which enables scientists to view firsthand the complex and constantly changing environment of a place like the East Pacific Rise.
Footage description: HOV Alvin navigates the around hydrothermal vents at the YBW-Sentry Field during a recent expedition to the eastern Tropical Pacific Ocean.
HOV Alvin lands on seafloor lava flows in the eastern Tropical Pacific Ocean, prepared for imaging and sample collection.
Shots of the hydrothermal vent field, Biovent, including Riftia pachyptila - giant tubeworms.
Towering colonies of these giant tubeworms grow adjacent to where hot, mineral-laden water jets out of hydrothermal vents the deep seafloor.
Also present are Cyanagraea crabs, a dominant predator in this ecosystem.
They can only be found on hydrothermal vents.
Footage of tubeworms, muscles, and a zoarcid fish that call this field of hydrothermal vents home.
A downward look at the hydrothermal vent field, Biovent.
A look at hydrothermal vent chimneys in the YBW-Sentry Vent Field.
The white areas are microbial mats.
A panorama of the YBW-Sentry Vent Field, including large anemones.
Hydrothermal chimneys in the YBW-Sentry Vent Field.
A vulcan - or vent - octopus thriving in the ecosystem created by hydrothermal vents.
A lone stalked crinoid sways in the current.
Crinoids are marine invertebrates.
Crinoids that are attached to the sea bottom by a stalk in their juvenile form are commonly called sea lilies.
HOV Alvin approaches a hydrothermal vent.
Its manipulator arm can be seen taking a sample of the hydrothermal fluids and gasses for scientists to analyze.
A WHOI-MISO self-recording high-temperature logger has been inserted into one of the active vent chimneys.
It records temperatures inside the vent orifice every 10 minutes, providing researchers with invaluable data about hydrothermal system behavior and activity over 1-2 years between the site visits to the study area.
The next time the researchers will go back to this site is in about 12-18 months.
A close-up of one of the newly discovered chimneys.
This one is roughly 9-10 meters tall.
This is a curtain folded whorl of lava, quickly frozen into the beautiful shape within minutes after it erupted.
The wrap around feature gives scientists information about how fluid the lava was when it erupted and the rate at which the lava flowed over the seafloor.