 Josh Haner / The New York Times / Redux
From The Atlantic by Robinson MeyerIt was once the pinnacle of humanity’s climate ambitions. A
new UN-led climate report essentially concedes that it’s out of reach.
The world’s most ambitious climate goal—to keep the planet’s average temperature from rising more than 1.5 degrees Celsius above its preindustrial level—is still technically feasible.
Technically.
There is not yet so much greenhouse-gas pollution in the atmosphere that avoiding 1.5 degrees Celsius of warming has become impossible, on paper.
But it is now, in practice, probably impossible to achieve.
On Monday, the
Intergovernmental Panel on Climate Change, the United Nations–led panel of scientists and scholars charged with summarizing the world’s understanding of global warming, released its newest report.
Unlike its previous reports, which focused on the physical and social consequences of climate change, this missive looks at how humanity can reduce its carbon pollution and avert climate collapse.
If most IPCC reports present a warning, this week’s is more of a “how to avoid the apocalypse” guide.
It is also the final report in the IPCC’s current eight-year cycle of consensus reports.
After this report (and a final “synthesis” report due later this year), the IPCC will not publish a major new document for years.
This is the last report before the 1.5-degree-Celsius scenario becomes completely impossible.
So it’s worth looking at that goal—and how it attained significance.
In 2015, as part of negotiations over the Paris Agreement, the world’s countries
set a new goal of holding global warming to “well below 2 degrees Celsius” and preferably aiming for 1.5 degrees Celsius.
(These translate to 3.6 degrees Fahrenheit and 2.7 degrees Fahrenheit, respectively.) The agreement also asked the IPCC to write a new report on the benefits of the 1.5-degree goal.
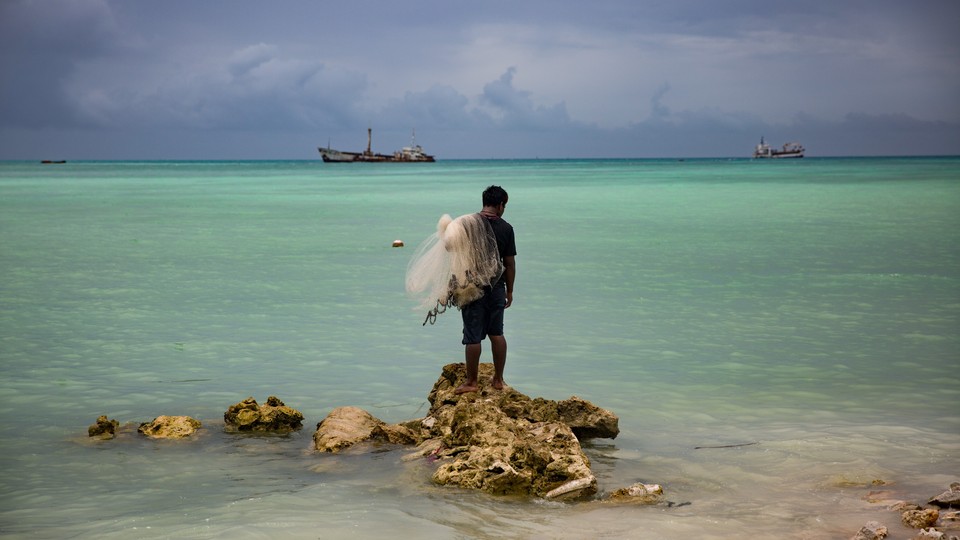
Just by itself, enshrining the 1.5-degree goal in international law represented a victory for the
small island nations, such as Kiribati and the Solomon Islands, which have historically called for the most aggressive climate policy because rising sea levels could wipe them off the map.
But the political potency of the goal exceeded even their dreams.
When the IPCC published
its 1.5-degree report three years later, it detailed the dire famines, droughts, and disasters that would accompany even that level of warming.
It inspired a new round of global climate concern.
The aggressive climate action of the past few years—Greta Thunberg’s protests, Wall Street’s calls for corporate sustainability, even Europe’s Green Deal—would have been unimaginable without the 1.5-degree report.
So it is charged, to say the least, to suggest that such a goal may now be impossible.
That’s partly because achieving 1.5 degrees has never seemed particularly likely: The 2018 report shocked readers to some extent because it recognized that, in order to avoid climate catastrophe, the world needed to replace its energy system at an unprecedented pace.
Decarbonization, too, has always required looking to the fantastic, the miraculous: Phasing out fossil fuels is both so difficult and so non-optional that any savvy realism must more closely resemble Marquez than Mearsheimer.
But while the eyes search for divine assistance, the feet must stay on solid earth.
And allowing a fantasy of 1.5 degrees to outlast its feasibility could curdle hope into bad assumptions, foolish thinking, or worse.
“It’s still technically possible to meet the 1.5-degree limit,”
Peter Erickson, the climate-policy program director at the Stockholm Environment Institute, told me, but “the window even for technical feasibility is rapidly shrinking.”
Since the initial report was published in 2018, global emissions have continued to rise, so it will be harder to achieve 1.5 degrees now than it was even when that report was written.
“Even of the scenarios they evaluate, only a third of them are able to limit warming to 1.5 degrees Celsius with any confidence,” he said.
Oliver Geden, a senior fellow at the German Institute for International and Security Affairs and one of the lead authors of the new IPCC report, agreed.
“I would say it’s plausible to talk about it. I think it’s not plausible to say that, given what we know right now, we won’t [exceed] it,” he told me.
Even though the goal remains possible, the report makes clear that enough fossil-fuel infrastructure to blow past the goal has already been built.
The world can emit as much carbon dioxide as it produced during the 2010s—about 400 gigatons—before it uses up the rest of its 1.5-degree budget, the new report finds.
But the world’s existing fossil-fuel infrastructure, as already built and financed, would generate another 660 to 850 gigatons of emissions.
Meeting the goal will require taking coal, oil, and natural-gas capacity offline before it was designed to shut down.
The question that really matters, both Erickson and Geden said, is not technical feasibility but political will and institutional capacity.
So although the new IPCC report repeatedly finds that the 1.5-degree goal is technically feasible, it also establishes that the pace of institutional change required to achieve such a technical transition would have no historical precedent.
Only a few countries have successfully moved away from a single fossil fuel in a single economic sector at the pace with which the entire world would need to eliminate all fossil fuels in all sectors, Erickson said.
And even these examples are not necessarily encouraging.
During the 1970s oil crisis, the United States accomplished one of the fastest energy transitions in history when it stopped burning petroleum to generate electricity.
But it replaced that oil
with domestically mined coal, a far dirtier fuel.
More recently, the U.S. rapidly phased out its coal capacity, but it replaced that fuel not with zero-carbon energy, but with climate-polluting natural gas.
The report praises a few examples of successful transitions, citing 24 countries that have successfully reduced their greenhouse-gas pollution for more than 10 years.
But they’re almost all wealthy industrialized countries, including the U.S., some Northern European nations, and former Soviet states.
“The former Soviet bloc is no model for decarbonization by any stretch,” Erickson said, because the lower emissions of those states accompanied a collapse in economic productivity.
To its credit, the original 1.5-degree report recognized that humanity was unlikely to keep global temperatures below 1.5 degrees Celsius for the entire century.
Instead, most of its scenarios envisioned that the world’s temperature would overshoot that goal, and then humanity would bring the temperature back in line by removing massive amounts of carbon dioxide from the atmosphere after 2050.
To attempt anything more ambitious than that baseline, carbon-removal scenario, the countries of the world would have to marshal real political momentum for emissions reduction.
“I don’t see political momentum” for that kind of change, Geden said.
But as humanity keeps putting off the task of reducing its emissions, the amount of carbon that needs to be removed keeps growing.
That could produce its own political issues, Geden said.
The contours of UN climate talks “will change dramatically if you start assuming net negative [emissions] are possible.
You could open up a new round of entirely magical thinking,” he said.
India, for instance, has already reasonably insisted that the world’s most developed countries go carbon-negative before other countries do.
But if you assume truly massive amounts of carbon removal are possible, then countries could simply assume that greater and greater amounts of carbon-dioxide removal will kick in as the century progresses.

At the same time, the structure of international politics has changed since the 1.5-degree report first came out.
Russia’s invasion of Ukraine has fractured international economic cooperation in a way that was not expected in 2018, and both the war and the Western response seem likely to
alter the fossil-fuel system.
The IPCC has modeled dozens of different scenarios of future emissions, Erickson noted, but none that assumes the creation of a new major geopolitical rivalry foresees a path to the 1.5-degree goal.
All of this has made Geden wonder if a more measured goal makes more sense.
“Is it 1.5 at any cost?” he asked.
“Or do we want to do 1.6? Is that a new aim because it’s also ‘well below 2 degrees Celsius’?”
Erickson said that advocates and politicians should keep the new goal in mind, but not base their entire strategy on it.
“‘1.5 or Bust’ is not a recipe for success, or equity, or for frankly reducing the worst impacts of climate change.
And maybe that’s a straw man, but you know, there are groups that are building their campaign strategies around that goal,” he said.
“It’s a painful conversation. It still seems like we should do everything we can. But to the extent that we foreclose backup strategies in the singular pursuit of 1.5 degrees Celsius, that could be problematic.”
Links :


 Experimental “mesocosms” created by the researcher Luisa Galgani and her team on the Greek island of Crete, to mimic and observe marine snow.


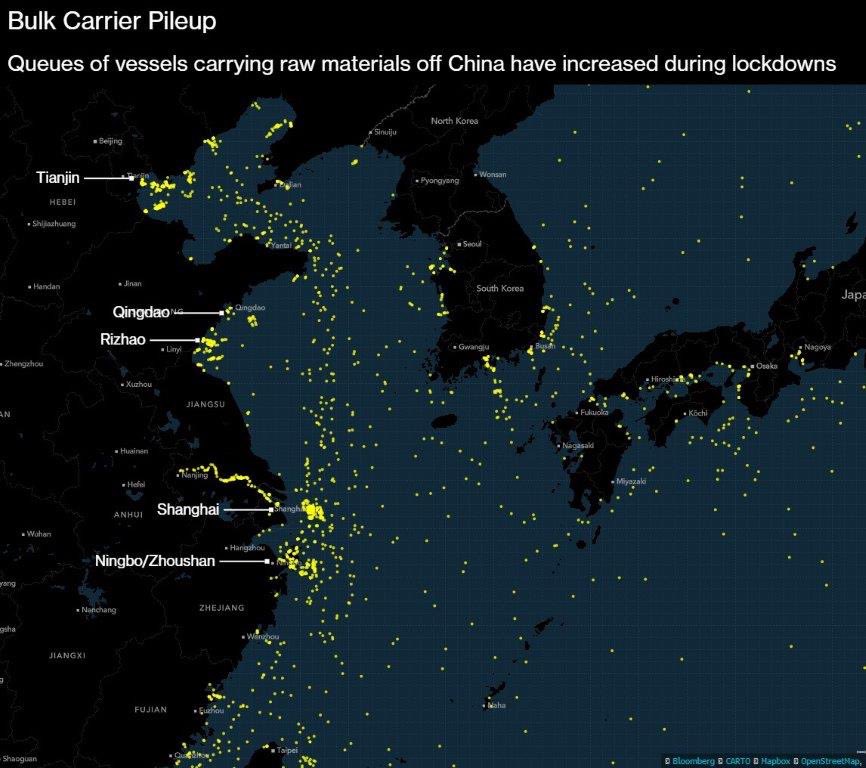
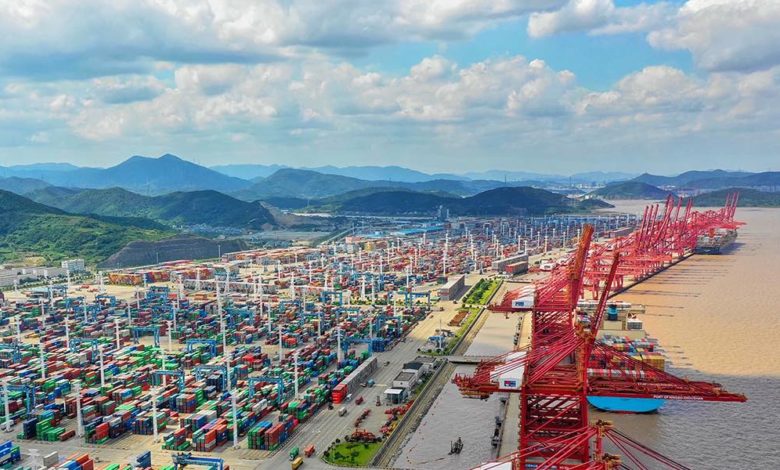 Ningbo Zhoushan Port