Saturday, August 8, 2015

NOAA WeatherView


NOAA weatherView is a new tool designed by the NOAA Visualization Lab to provide an interactive experience with NOAA weather models : lets you display wind, temperature, precipitation and other models to see weather patterns around the globe.

 The NOAA gives us the example of Typhoon Soudelor, which passed over Taiwan yesterday.

All of these data are also available from the NOAA Operational Model Archive and Distribution System built by NOAA National Centers for Environmental Information - Climate.
http://go.usa.gov/3sKWz

 Example of  3-D animated image of downscaled Global Forecast System (GFS) model data showing Hurricane Katrina making landfall on August 29, 2005.
This image was generated with the Visualization and Analysis Platform for Ocean, Atmosphere, and Solar Researchers (VAPOR) tool and ImageMagick.

Links :

Friday, August 7, 2015

Image of the week : the dark side and the bright side of the moon


From NASA

A NASA camera aboard the Deep Space Climate Observatory (DSCOVR) has captured a unique view of the Moon as it passed between the spacecraft and Earth.
A series of test images shows the fully illuminated “dark side” of the Moon that is not visible from Earth.


The images were acquired by NASA’s Earth Polychromatic Imaging Camera (EPIC), a four megapixel CCD camera and telescope on the DSCOVR satellite, which orbits about 1.6 million kilometers (1 million miles) from Earth.
EPIC maintains a constant view of the fully illuminated Earth as it rotates, providing daily scientific observations of ozone, vegetation, cloud height, and airborne aerosols.
About twice a year the camera will capture images of the Moon and Earth together as the orbit of DSCOVR crosses the orbital plane of the Moon.
The images shown above and in the movie below were taken over the course of five hours on July 16, 2015.
The North Pole is toward the upper left, reflecting the orbital tilt of Earth from the vantage point of the spacecraft.


The far side of the Moon was first observed in 1959, when the Soviet Luna 3 spacecraft returned the first images.
Since then, several missions by NASA and other space agencies have imaged the lunar far side.
(For instance, NASA’s Deep Impact spacecraft captured a similar view of Earth and the Moon from a distance of 31 million miles in 2008.)
The same side of the Moon always faces an earthbound observer because the Moon’s orbital period is the same as its rotation around its axis.
EPIC’s natural-color images of Earth are generated by combining three separate monochrome exposures taken by the camera in quick succession.
EPIC takes a series of 10 images using different spectral filters—from ultraviolet to near infrared—to produce a variety of science products.
The red, green, and blue channel images are used in these color images.
But combining three images that are taken about 30 seconds apart produces a slight but noticeable camera artifact on the edges of the Moon.
Because the Moon moved in relation to Earth between the time the first (red) and last (green) exposures were made, a thin green offset (about 7–8 pixels) appears on the right side when the three exposures are combined.
This movement also produces a slight red and blue offset on the left side of the unaltered images.

The lunar far side lacks the large, dark, basaltic plains, or maria, that are so prominent on the Earth-facing side.
The largest far side features are Mare Moscoviense (Sea of Moscow) in the upper left and Tsiolkovskiy crater in the lower left.
Situated at a stable orbit between the Sun and Earth, DSCOVR’s primary mission is to monitor the solar wind for space weather forecasters at the National Oceanic and Atmospheric Administration (NOAA).
Its secondary mission is to provide daily color views of our planet as it rotates through the day.

Thursday, August 6, 2015

Egypt shows off $8billion Suez Canal expansion that the world may not need

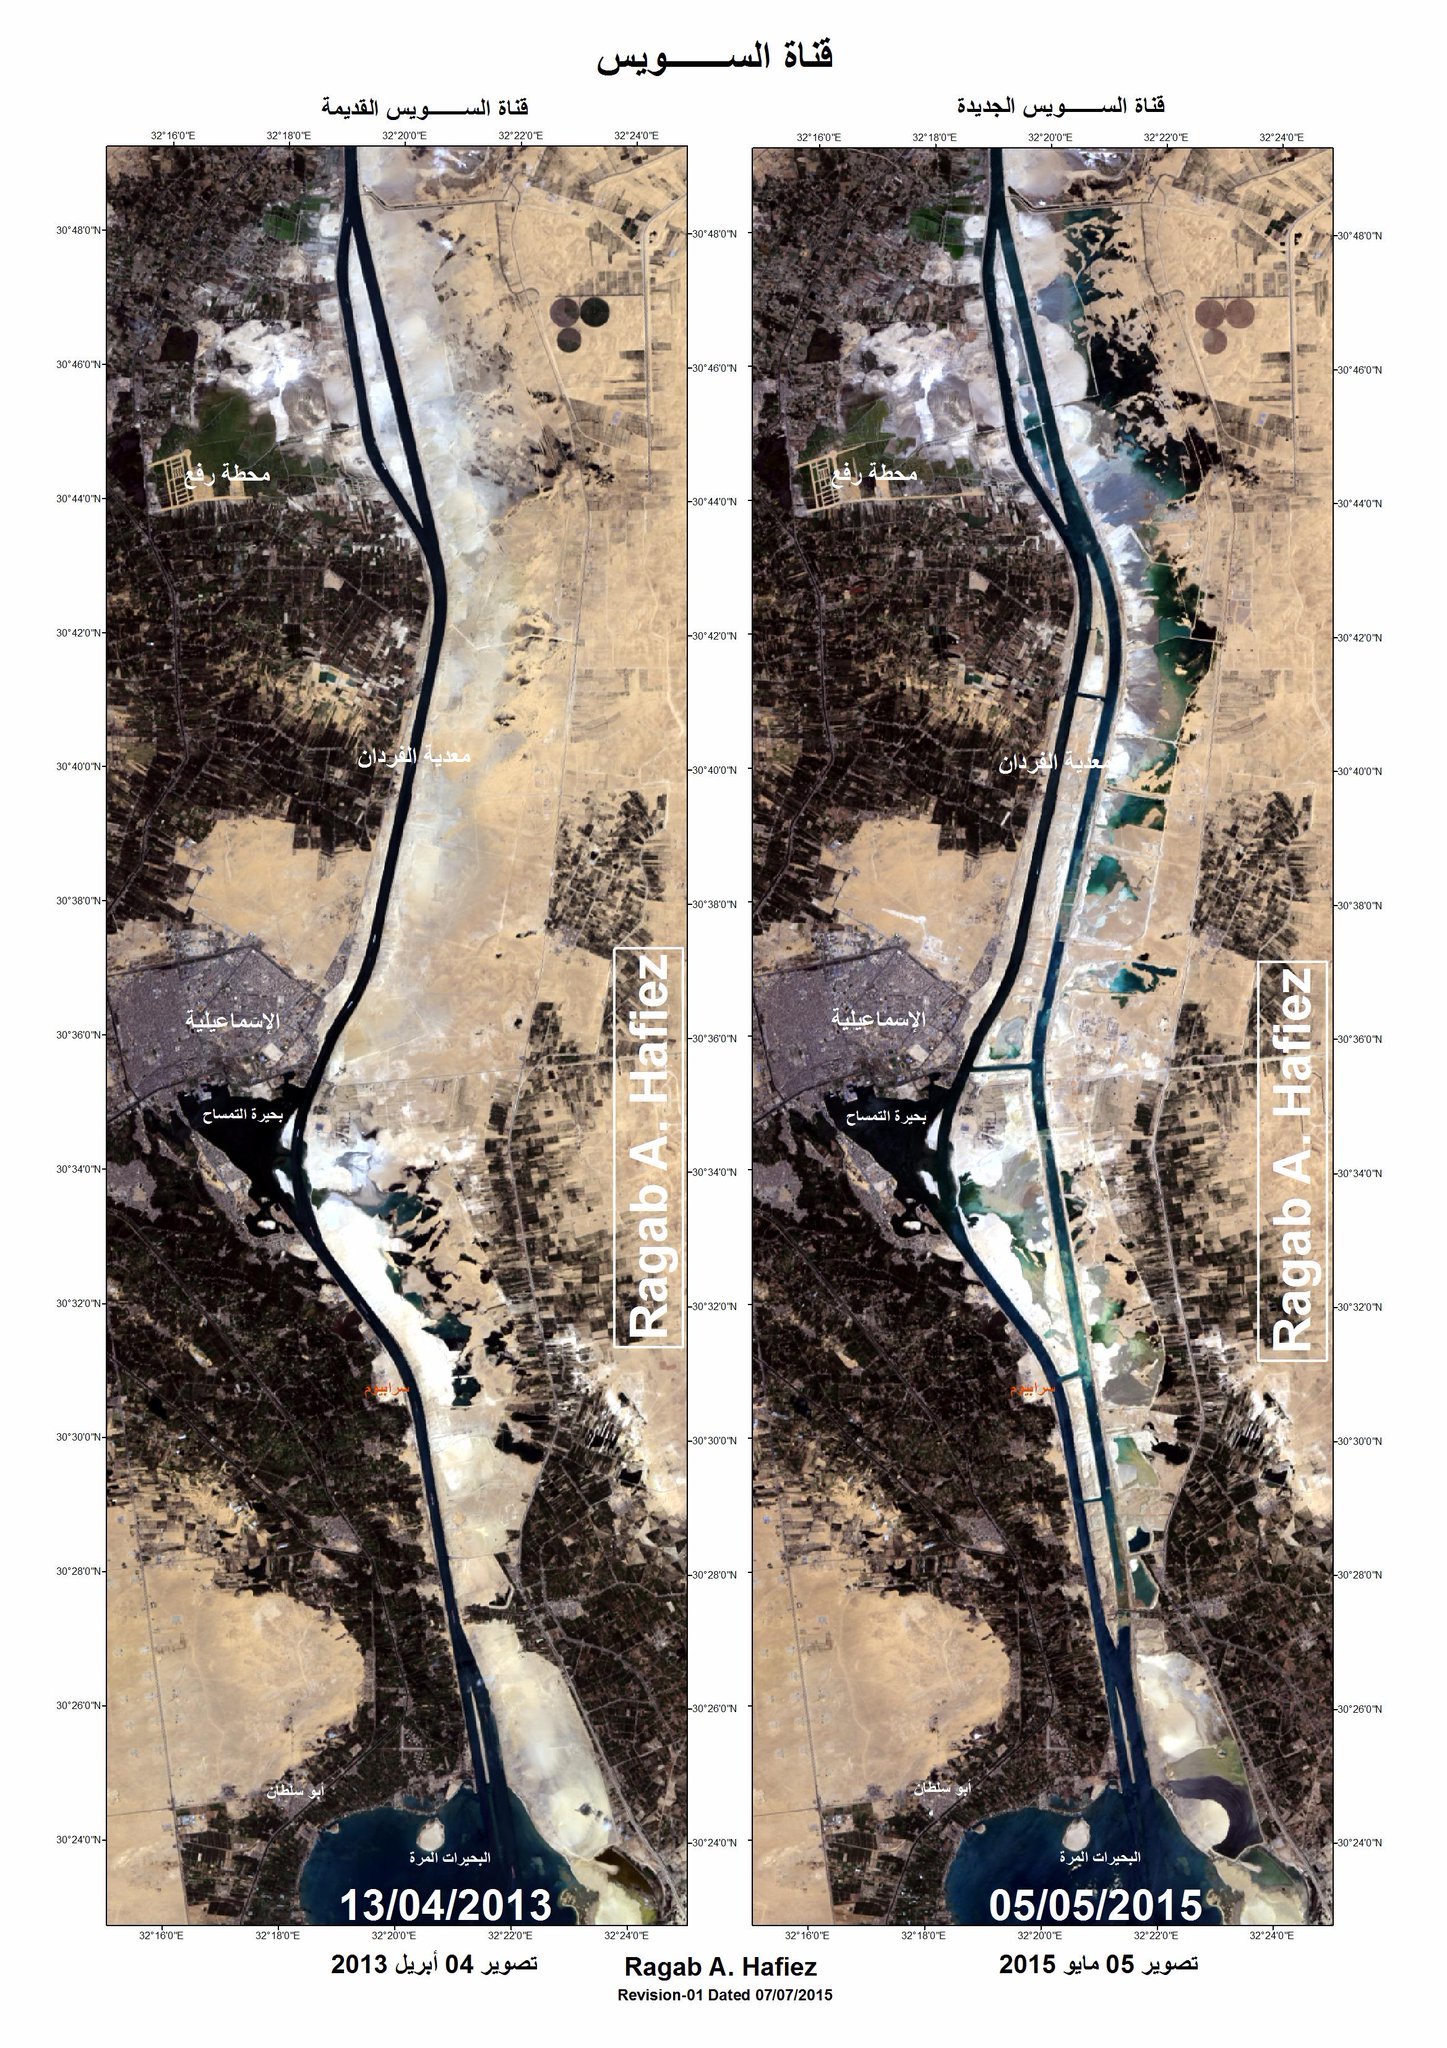
 Map of the New Suez Canal compared with the Old Canal

It will save time for ships & Yachts in transit through Suez canal up to 10 hours in addition will allow ships with 66 feet draft to transit and up to 97 ships per day transit from both ways Suez and port said the total Suez canal length is 193 KM , the main entrance of Suez canal from Mediterranean sea is port said and from Red sea is port tawfik in the city of Suez .

From Bloomberg by Ahmed Feteha

The Suez Canal took 10 years to build and cost thousands of workers their lives.
When planners suggested three years for a second one, Egypt’s president balked.
“Not three years, just one,” he ordered.
Twelve months later, Abdel-Fattah El-Sisi is hosting a party to celebrate the biggest expansion of the canal since it first opened in 1869.
For the former army chief seeking to bolster his rule, the symbolism is impossible to miss.
Less clear are the economic benefits of what billboards in Cairo and New York’s Times Square dub “Egypt’s gift to the world,” which will raise capacity and shorten the time it takes to sail the 193-kilometer (120-mile) link between the Red Sea and the Mediterranean.
Thursday’s ceremony, to be attended by dignitaries from French President Francois Hollande to North Korea’s deputy leader Kim Yong Nam, comes amid sluggish global trade growth to which the canal’s fortunes are linked.
“From a shipping industry point of view, this initiative to expand the Suez canal was a bit of a surprise,” said Ralph Leszczynski, Singapore-based head of research at Genoese shipbroker Banchero Costa & Co.
“There was no pressing need or requests for this as far as I’m aware.”
Suez has yet to fully recover since the global financial crisis caused shipping to plummet in 2009. Though total tonnage has increased, the number of vessels using the canal remains 20 percent below its 2008 level and just 2 percent higher than a decade ago, data compiled by Bloomberg show.
Rather than a bottleneck, analysts say those statistics reflect slower global trade growth, which the International Monetary Fund expects to average 3.4 percent in the period 2007-2016, compared with 7 percent over the previous decade.
The Baltic Dry Index, which measures rates for shipping iron ore, coal and grain and is viewed as a bellwether for the global economy, slumped to a record low 509 points in February.
It remains about 90 percent below its all-time high of 11,793 reached in 2008.

The iconic project in Egypt is almost coming to an end.
On Saturday, the very first three vessels sailed through the new Suez Canal.
In the first week of August the new canal will be officially inaugurated.
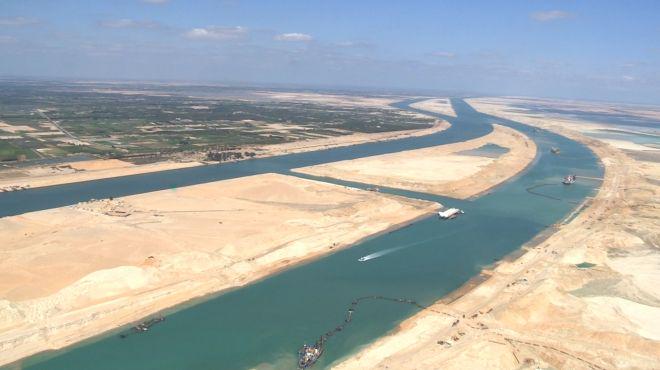
A total of 200 million m³ was dredged in less than one year, which makes this iconic work the largest cutter project eve.

Lacking Details

“At the moment, speed is not a key factor for container shipping, the shipping sector which most utilizes the canal,” said Michelle Berman, the head of operational risk at BMI Research, a unit of Fitch Group.
A bigger issue is a “surplus of ships” relative to demand, with ever-larger vessels built for the Asia-Europe route compounding the problem, she said.
The government hasn’t made public viability studies to show how it will gain a return on its 64 billion Egyptian pound ($8.2 billion) investment.
The expansion will meet future demand, with traffic expected to double to 97 vessels a day by 2023, said Mohab Mameesh, head of the Suez Canal Authority.
“By creating a second lane of the canal we are able to reduce waiting times, which reduces fuel expenditures and costs, with no increase in our toll fees,” he said in an e-mailed response to questions.
Global trade volume would need to rise by around 9 percent a year for Suez to reach its traffic goal, Capital Economics said in a report on Monday, describing the target as “unlikely to say the least.”

New Suez Canal had a trial run today.
Vessels sailing the new canal are nicely visible on MarineTraffic.

Note: Google Maps imagery (last update 22/09/2014)
and nautical charts (UKHO) need to be updated
 as this is already done in OpenStreetMap

http://www.openstreetmap.org/#map=11/30.5779/32.3204

Canal Distraction

That hasn’t stopped El-Sisi and his government from talking up the new canal amid political challenges to its rule.
Hundreds of Egyptians, most of them supporters of the deposed Muslim Brotherhood, have been killed and thousands imprisoned since El-Sisi, as army chief, pushed his Islamist predecessor from office in 2013 after mass protests.
El-Sisi was elected president last year.
The political turmoil has polarized Egyptians
El-Sisi supporters say it saved the country from the deadly strife affecting much of the Middle East, while opponents criticize the government’s human rights record and what they regard as brutality used to restore stability.

 A 1921 map of the Suez Canal, running South from Port Saïd on the Mediterranean, through Ismailia and the Great Bitter Lake, to the Gulf of Suez on the Red Sea

Suez Canal 1:250,000 Series 3753, Great Britain War Office, 1941  (Lib. Univ. Texas)

French Connection

Thursday’s party, with an estimated price tag of $30 million, is a chance for the government to send a more positive message by harking back to the events marking the canal’s 1869 completion.
French empress Eugenie attended -- her husband Napoleon III was deposed a year later -- and a performance of Giuseppe Verdi’s ’Rigoletto’ opened Cairo’s new opera house.
The canal has since transformed global trade.
About 8 percent of the world’s cargo now passes through the canal, according to the Suez Canal Authority. Traveling from Singapore to New York through Suez reduces the distance by 19 percent compared with the route via the Pacific and the Panama Canal.
From the Persian Gulf to Rotterdam, Suez saves 42 percent by removing the detour around the Cape of Good Hope.
“Even without any improvements, the canal would always be attractive,” said Neil Atkinson, head of analysis at Lloyd’s List Intelligence.

The finish of the Suez Canal project is in sight.
The dredging of more than a million cubic meters of sand a day is unprecedented.
And this assignment has also pushed back the boundaries in terms of speed, and the deployment of equipment and manpower.

Wider, Deeper

The second canal -- actually a new 35-kilometer channel and 37 kilometers of widening and deepening of the original -- allows two-way traffic and reduces transit time to 11 hours from 18, according to the canal operator.
The expansion won’t allow larger vessels to use the route.
New ports and logistical services are expected to follow, and the project includes six tunnels under the canal.
The authority expects revenue to grow to more than $13 billion by 2023, up from $5.5 billion in 2014.
“‘Build it and they will come’ is not enough,” said Simon Kitchen, a strategist with Cairo-Based investment bank EFG-Hermes, adding that companies will require incentives to build factories and other facilities.
“The government needs to give ships a reason to sail through the canal,” he said.
Others are more positive.
Egypt’s economy grew at over four percent in the nine months to March for the first time since 2010, mainly due to infrastructure spending related to the canal upgrade, according to investment bank Pharos Holding for Financial Investments.

 Actual dredged quantities according to progress of works : 258.8 million cubic meters
Duration of execution : 12 months, including mobilization of dredgers
Consortium's first dredger to be employed in the project : Dredger "Al-Marifaa" on Nov. 5th,2014
Quantities of Dry excavation works : 250 million cubic meters
Highest daily rate of dredged quantities was achieved by dredger "Ibn Batouta" on April 6th,2015    230,000 cubic meters
Highest daily output of dredged quantities was achieved on May 31th ,2015 : 1.73 million cubic meters
Number of dredgers employed in the project : 45 dredgers
Number of sedimentation basins : 20 basins


SC1, Suez Canal, (Edition 1, dated 15th July 2015)

SC2, Suez Canal, (Edition 1, dated 15th July 2015)
Following the establishment of the New Suez Canal, the Suez Canal Authority along with Egyptian Navy Hydrographic Department have produced two charts to help mariners sail safely in the New Suez Canal.
Accordingly, sailing in the Suez Canal and vessel inspection will be performed only through charts SC1 and SC2 and no vessel will pass Suez Canal without the above charts being on board starting 06 August 2015.

Saving Money

A shorter transit may save up to 4 percent of journey costs depending on the length, the Napoli-based economic research center SRM estimates.

 Shipping times : Northeast passage vs Suez Canal
 Arctic shipping routes unlikely to be 'Suez of the north'
The North Sea route has become free of ice, but the navigation season is still just two-four months 

The project “was a necessity to maintain the attractiveness of the Suez Canal,” said Michael Storgaard, a spokesman for Maersk Line, the world’s biggest container shipping company.
Even so, it’s too early to say whether Maersk will route more vessels through Suez, he said.
Still, any future economic payoff is trumped by the political implications for the government from building confidence in El-Sisi’s leadership, according to Amr Adly, a scholar with the Carnegie Middle East Center in Beirut.
“El-Sisi is trying to gain legitimacy through his government’s achievements,” Adly said.
His thinking is that Suez “shows the government can deliver, it can commit to something and get it done,” he said.

Links :

Wednesday, August 5, 2015

Stop burning fossil fuels now: there is no CO2 'technofix', scientists warn

 No 'Plan B' for oceans, says study
 “The chemical echo of this century’s CO2 pollution will reverberate for thousands of years,” said the report’s co-author, Hans Joachim Schellnhuber
Photograph: Doug Perrine/Design Pics/Corbis

From The Guardian by Tim Radford

Researchers have demonstrated that even if a geoengineering solution to CO2 emissions could be found, it wouldn’t be enough to save the oceans

German researchers have demonstrated once again that the best way to limit climate change is to stop burning fossil fuels now.
In a “thought experiment” they tried another option: the future dramatic removal of huge volumes of carbon dioxide from the atmosphere.
This would, they concluded, return the atmosphere to the greenhouse gas concentrations that existed for most of human history – but it wouldn’t save the oceans.
That is, the oceans would stay warmer, and more acidic, for thousands of years, and the consequences for marine life could be catastrophic.
The research, published in Nature Climate Change today delivers yet another demonstration that there is so far no feasible “technofix” that would allow humans to go on mining and drilling for coal, oil and gas (known as the “business as usual” scenario), and then geoengineer a solution when climate change becomes calamitous.

 Atmospheric concentrations of important long-lived greenhouse gases over the last 2,000 years. Increases since about 1750 are attributed to human activities in the industrial era, via Co2now.org

Sabine Mathesius (of the Helmholtz Centre for Ocean Research in Kiel and the Potsdam Institute for Climate Impact Research) and colleagues decided to model what could be done with an as-yet-unproven technology called carbon dioxide removal.
One example would be to grow huge numbers of trees, burn them, trap the carbon dioxide, compress it and bury it somewhere.
Nobody knows if this can be done, but Dr Mathesius and her fellow scientists didn’t worry about that.
They calculated that it might plausibly be possible to remove carbon dioxide from the atmosphere at the rate of 90bn tons a year.
This is twice what is spilled into the air from factory chimneys and motor exhausts right now.
The scientists hypothesized a world that went on burning fossil fuels at an accelerating rate – and then adopted an as-yet-unproven high technology carbon dioxide removal technique.
“Interestingly, it turns out that after ‘business as usual’ until 2150, even taking such enormous amounts of CO2 from the atmosphere wouldn’t help the deep ocean that much - after the acidified water has been transported by large-scale ocean circulation to great depths, it is out of reach for many centuries, no matter how much CO2 is removed from the atmosphere,” said a co-author, Ken Caldeira, who is normally based at the Carnegie Institution in the US.


The oceans cover 70% of the globe.
By 2500, ocean surface temperatures would have increased by 5C and the chemistry of the ocean waters would have shifted towards levels of acidity that would make it difficult for fish and shellfish to flourish.
Warmer waters hold less dissolved oxygen.
Ocean currents, too, would probably change.

 Ocean acidification

But while change happens in the atmosphere over tens of years, change in the ocean surface takes centuries, and in the deep oceans, millennia.
So even if atmospheric temperatures were restored to pre-Industrial Revolution levels, the oceans would continue to experience climatic catastrophe.
“In the deep ocean, the chemical echo of this century’s CO2 pollution will reverberate for thousands of years,” said co-author Hans Joachim Schellnhuber, who directs the Potsdam Institute.
“If we do not implement emissions reductions measures in line with the 2C target in time, we will not be able to preserve ocean life as we know it.”

Links :
  • The Carbon brief : Geoengineering is ‘no substitute’ for cutting emissions, new studies show
  • Gizmodo : This is why carbon is now called pollution

Tuesday, August 4, 2015

What China has been building in the South China Sea

 From reef to island in less of one year
(Fiery Cross Reef)
Images by DigitalGlobe, via the CSIS Asia Maritime Transparency Initiative, 
and CNES, via Airbus DS and IHS Jane’s

From NYTimes by Derek Watkins

China has been feverishly piling sand onto reefs in the South China Sea for the past year, creating seven new islets in the region.
It is straining geopolitical tensions that were already taut.  

The speed and scale of China’s island-building spree have alarmed other countries with interests in the region.
China announced in June that the creation of islands — moving sediment from the seafloor to a reef — would soon be completed.
“The announcement marks a change in diplomatic tone, and indicates that China has reached its scheduled completion on several land reclamation projects and is now moving into the construction phase,” said Mira Rapp-Hooper, director of the Asia Maritime Transparency Initiative at the Center for Strategic and International Studies, a Washington research group.
 So far China has built port facilities, military buildings and an airstrip on the islands.
The installations bolster China’s foothold in the Spratly Islands, a disputed scattering of reefs and islands in the South China Sea more than 500 miles from the Chinese mainland.

Sources: C.I.A., NASA, China Maritime Safety Administration

The new islands allow China to harness a portion of the sea for its own use that has been relatively out of reach until now.
Although there are significant fisheries and possible large oil and gas reserves in the South China Sea, China’s efforts serve more to fortify its territorial claims than to help it extract natural resources, Dr. Rapp-Hooper said. 
The islands are too small to support large military units but will enable sustained Chinese air and sea patrols of the area.
The United States has reported spotting Chinese mobile artillery vehicles in the region, and the islands could allow China to exercise more control over fishing in the region. 


The Chinese were relative latecomers to island building in the Spratly archipelago, and “strategically speaking, China is feeling left out,” said Sean O’Connor, principal imagery analyst for IHS Jane’s.
Still, China’s island building has far outpaced similar efforts in the area, unsettling the United States, which sees about $1.2 trillion in annual bilateral trade go through the South China Sea.
At the end of May, Defense Secretary Ashton B. Carter criticized China’s actions in the region.  


Several reefs have been destroyed outright to serve as a foundation for new islands, and the process also causes extensive damage to the surrounding marine ecosystem.
Frank Muller-Karger, professor of biological oceanography at the University of South Florida, said sediment “can wash back into the sea, forming plumes that can smother marine life and could be laced with heavy metals, oil and other chemicals from the ships and shore facilities being built.”
Such plumes threaten the biologically diverse reefs throughout the Spratlys, which Dr. Muller-Karger said may have trouble surviving in sediment-laden water.  

 Image by DigitalGlobe, via CSIS Asia Maritime Transparency Initiative


What Is on the Islands?

South China Sea in the GeoGarage platform (NGA chart)

Vietnam, Malaysia, the Philippines and Taiwan have all expanded islands in the Spratlys as well, but at nowhere near the same scale as China. 

 Image by DigitalGlobe, via CSIS Asia Maritime Transparency Initiative

For China, the Fiery Cross Reef is the most strategically significant new island, with a nearly completed airstrip that will be large enough to allow China to land any plane, from fighter jets to large transport aircraft.
But China’s airfield is not the first in the region — every other country that occupies the Spratlys already operates one as well. 

 Image by CNES distributed by Airbus DS, via IHS Jane’s

China’s reefs hosted smaller structures for years before the surge in construction.
By preserving these initially isolated buildings, China can claim that it is merely expanding its earlier facilities, similar to what other countries have done elsewhere in the region. 


Image by DigitalGlobe, via CSIS Asia Maritime Transparency Initiative

China continues to expand islands at two locations, Mischief Reef and Subi Reef.
It is unclear what structures will be built on the islands, though each will have straight portions long enough for airfields. 


Image by DigitalGlobe, via CSIS Asia Maritime Transparency Initiative

Links :
  • The Economist : Is China making the same mistakes as Japan did before the second world war?  
  • WashingtonPost : What happens to a coral reef when an island is built on top?
  • The Guardian : Preventing Ecocide in South China Sea 
  • CSIS : Airpower in the South China Sea

Monday, August 3, 2015

What does the age of the survey mean for nautical charts?

 What are the differences between data collected in 1900, 1940, or 1960?
Let’s take a look at a…

From NOAA

Alaska’s nautical charts need to be updated — we all know that.
The diagram below shows the vintage of survey data currently used for today’s charts in Alaska.
The graphic includes all surveys done by NOAA’s Office of Coast Survey (and its predecessors), and some limited data acquired by other agencies, i.e., the U.S. Coast Guard.
Areas that are not colored in have never been surveyed or have data acquired by another source — from Russia or Japan, for instance — before the U.S. was responsible for charting in that area.

Brief Historical Sketch of Survey Technologies

Nautical charts have a lot of information, but mariners especially are concerned with two major components: water depths (known as “soundings”) and obstructions (like underwater seamounts or wrecks).
Different eras used different technologies to find, measure, and determine the position of the two components.
Note that adoption of new systems does not happen abruptly; rather, new technologies are phased in as techniques and equipment improves.

Measuring Water Depth (Soundings)

3.7 million years ago to present day: sounding pole
It isn’t inconceivable that the earliest humanoid, Australopithecus afarensis, used sticks to gauge water depths before crossing streams and rivers.
People still do it today.

 Note the ancient Egyptian on the far right, using a sounding pole.
~ 2000 B.C. to 1930s: lead line

As good as they were for their eras, 19th and 20th century surveyors faced technological challenges. The first challenge was accounting for gaps between depth measurements.
The second was the inability to be totally accurate in noting the position of the measurement.
(In other words, a specific location out in the ocean may be 50 feet deep, but a surveyor must also accurately note the position of that specific location.)

 This surveyor is casting a lead line.

Early Coast Survey hydrographers measured depths by lead lines — ropes with lead on one end — that were lowered into the water and read manually.
Even though soundings were generally accurate, coverage between single soundings was lacking. And we need to remember that this was before the age of GPS.
While sextants gave accurate positions when a hydrographer could fix on a shoreline feature, the further offshore the survey, the less accurate the position.
(Interesting fact: Hydrographers still use lead lines occasionally, in some circumstances — but not for a complete survey.)
There have been variations on lead lines through the centuries.
From 1492 to the late 1870s, for instance, mariners used hemp rope for deep-sea soundings.
(Interesting fact: Christopher Columbus and Ferdinand Magellan each tried to measure mid-ocean depths with about 1,200 feet of hemp rope. Neither one of them found the sea bottom.)
In 1872, the hemp was replaced by small diameter piano wire (again, primarily for deep-sea work), and the weight of the lead was increased.
Later, hydrographers added a motorized drum to wind and unwind the line, with a dial to record the length of the line.
(Interesting fact: In 1950, the British ship Challenger used piano wire in the first sounding that established Mariana Trench as the deepest place on earth.)

 20th century to the present: echo sounders

 Compare the bottom coverage achieved by the different survey methods.

1918 to 1990s: single beam echo sounder

Sonar came into its own in 1913.
The first echo sounders (also known as “fathometers”) had single beams that measured the distance of the sea floor directly below a vessel.
The echo sounders were able to take many more depth measurements than was possible with the lead line, but the technique still resulted in gaps between the lines where the beam measured the water depth.
The U.S. Coast and Geodetic Survey (a NOAA predecessor agency) adopted this acoustic sounding technique in 1923, installing it on USCGS Ship Guide.
But full-fledged change didn’t happen right away.
These early sounding systems were too large to install on survey launches used in harbor and inshore work, so from 1924 until the early 1940s many surveys were still conducted with a lead line, and many were totally acoustic — and some were hybrid, using soundings from both methods, depending on coverage area and seafloor configuration.
→ 1940: U.S. Coast and Geodetic Survey fully adopts single beam echo sounding technology
The development of smaller “portable” fathometers for shallow waters, about 1940, was a primary impetus in the obsolescence of lead line as survey technology and the adoption of acoustic systems.
The development of World War II electronic navigation systems for bombing purposes led to the development in 1945 of the first survey-quality electronic navigation systems, which allowed for more accuracy in positioning.

1964 to current day: multibeam echo sounder

By mid-century, scientists were increasing the beams projected by the echo sounder, to get a broader swath of measurements.
The multibeam echo sounder was developed for the Navy in 1964, but it remained secret until the late 1970s when commercially available systems were developed.
Coast Survey first used a MBES technique, called the “Bathymetric Swath Survey System,” in 1977 on NOAA Ship Davidson, for depths ranging from 160 to 2,000 feet.
In 1980, NOAA Ship Surveyor installed a deep-water MBES system called “Sea Beam,” for depths from 1,600 to 33,000 feet.
About 1986, Coast Survey began using GPS to calibrate medium-frequency navigation systems while operating in the far reaches of the United States Exclusive Economic Zone.
By the mid-1990s, GPS was the primary control for accurate positioning.
→ 2000: Coast Survey fully adopts multibeam surveying
By 2000, Coast Survey was performing full-coverage multibeam hydrographic surveys for charting purposes.
NOAA survey ships now use multibeam echo sounders that measure navigable coastal depths from 45 to 1,000 feet.
For shallower and more constricted waters, the ships deploy hydrographic survey launches with multibeam echo sounders that efficiently and safely survey areas from 12 to 200 feet deep.
These systems make it possible to acquire 100% sea floor coverage in the survey grounds (excluding ultra-shallow, near-shore, or obstruction areas).

Finding Underwater Obstructions

1880s to early 1990s: wire drag

Surveyors used wire drag, not as a sounding system but as a way to look between the sounding lines to find obstructions to navigation and establish safe navigational channels.
The first documented wire drag was conducted in the 1880s, in French Indochina, Gulf of Tonkin area, attaching the wire to buoys at each end and letting it drift with tidal currents.
Around 1900, the U. S. Lake Survey developed the technique of using a ¼-mile wire drag between two boats.
In 1903, Coast Survey began using the technique, and within a few years was using it extensively in Alaskan waters as they looked for pinnacle rocks.
Coast Survey’s Alaska wire drags were up to 3.5 miles long.
(Initially, “least depths” over discovered obstructions were determined by lead line, then acoustic means and, ultimately, by divers with depth/pressure gauges.)

 Survey vessels conduct wire drag operations.

1960 to present day: side scan sonar

Side scan sonar is essentially the sonar equivalent of an aerial photograph.
It improves the ability to identify submerged wrecks and obstructions.
Evolving from submarine detection sonars of World War I and World War II, side scan sonar was fairly well developed by 1960, when the United Kingdom Hydrographic Office started using it regularly with their surveys.
→ 1990: Coast Survey fully adopts side scan sonar for East Coast and Gulf Coast surveys
NOAA Ship Whiting used the technology in 1984-1985 for approaches to New York. U.S. Coast Survey fully adopted side scan sonar (in place of wire drag) in the early 1990s.

 Side scan sonar operations use “towfish” like this one, lowered into the water and towed from the back of the vessel.

 Side scan sonar captures images of objects, which improves the ability to identify submerged objects.

Today’s Charts Reflect Different Tech Eras

Each of NOAA’s 1000-plus nautical charts, even today, can contain information collected by any or all of these sounding and positioning techniques.
Most nautical charts are an amalgamation of geospatial information collected using different techniques at different times.
For example, one area of a specific current-day nautical chart might be based on a lead line and sextant survey conducted in 1910, and another area on the same chart might be based on a multibeam and GPS survey conducted in 2010.
If we dig deep enough, we will probably find a sounding or two from the 18th century British explorer, Captain James Cook.
NOAA cartographers mold this disparate information so that it fits together as a coherent representation of the geographic area.
So when was the data acquired for the chart you’re using?
NOAA cartographers add a “source diagram” to large-scale charts.
(See the diagram on the current chart 16240, pictured below.)
Check yours.
That will give you the years of the surveys… and now you have a better idea on the technology used by the surveyor.

 This is the source diagram on nautical chart 16240.

 16240 chart in the GeoGarage platform

The search for Malaysia Airlines Flight 370 : debris discovery 'consistent with ocean currents from search area'


Possible MH370 clue rode ocean currents
Here's how wreckage from Malaysia Airlines Flight 370 could have floated thousands of miles away from the search area off the coast of Australia

 From Reuters by Lincoln Feast and Jeffrey Dastin

Vast, rotating currents sweeping the southern Indian Ocean could have deposited wreckage from a missing Malaysia Airlines passenger jet near Africa, thousands of kilometres from where it is thought to have crashed, oceanographers said on Thursday.

French authorities are studying a piece of plane debris found on Reunion Island, off the east coast of Madagascar, to determine whether it came from Flight MH370, which disappeared without a trace 16 months ago with 239 passengers and crew on board.

If confirmed to be part of the missing Boeing 777, experts will try to model its drift to retrace where the debris could have come from, although they cautioned it was unlikely to help in narrowing down the plane's final resting place beyond the vast swathe of ocean off Australia that has been the focus of the search for months.

"This wreckage has been in the water, if it is MH370, for well over a year so it could have moved so far that its not going to be that helpful in pinpointing precisely where the aircraft is," Australian Deputy Prime Minister Warren Truss told reporters.
"It certainly would suggest the search area is roughly in the right place."

Australia has been leading a search for the plane since analysis of a series of faint satellite "pings" from the aircraft led investigators to conclude that it crashed in the stormy southern Indian Ocean about 2,000 km southwest of Perth.

Ocean current models

Models of ocean currents were consistent with the potential discovery of debris in the tropics, roughly 3,700 km to the northwest, oceanographic experts said.

A huge, counter-clockwise current, called a gyre, covers much of the southern part of the 70.5 million sq km (27.2 million sq miles) Indian Ocean, running east along the Southern Ocean near Antarctica, up the west Australian coast and westward below the equator towards Reunion and Madagascar, before turning south.

 Marked by the green circle, Reunion Island is visible in this map highlighting the complexity of eddies and gyres in the Indian Ocean.
Embedded in overall broad ocean currents are small eddies that create turbulence and make it complicated to track the flow of potential debris.
source : earth.nullschool.net
 
On the basis of the aircraft debris that was found on 29 July on the island of Réunion, hydrodynamic experts of Deltares produced a simulation model that indicates that the northern part of the search is now a more likely source of the debris.


Debris tracking flight MH370 based on ocean currents

Deltares experts Maarten van Ormondt and Fedor Baart used a particle tracking routine to compute the movement of debris from different locations in the search area.
The calculation was made using surface currents (assuming that they are the most relevant for the floating debris) from the global HYCOM model.
The results show how debris moves with the counter-clockwise gyre in the Southern Indian Ocean and quickly disperses over large areas.
Particles released in the northern section of the search area arrive at the African coast first within a year of the release time.
Those released in the southern section do not travel as far and do not make it to Africa within the simulation period.

 Average surface currents since the disappearance of MH370. Colors have been Zissoufied and indicate current speed. Arrows show current direction and larger arrows = faster currents.
source : Dr Martini

 Ocean currents in the search area : shows the east to west flow of the Indian Ocean gyre, one of five such major surface currents on Earth. 

Maarten van Ormondt (a Deltares hydrodynamic expert): ‘The model shows us that the ocean currents are able to carry the debris from the search area west of Australia to Réunion. It also suggests that it is more likely that the debris originates from the northern section of the search area than from the southern part.”

Erik van Sebille, an oceanographer at Imperial College London, said that, if the debris on Reunion was indeed from MH370, his modelling suggested the aircraft went down in the north of the search zone.
"This westward drift from near Australia all the way across the Indian Ocean can really only happen if the plane went into the water relatively close to the equator," he said.
Finding more debris would help triangulate where MH370 may have hit the water, he added.

 Another computer model developed by Erik van Sebille, an oceanographer at the Imperial College in London, uses historical ocean currents data to predict the probable paths that objects could take drifting through the ocean over the course of several months.
This map shows the model's predictions for an object washing up on the island of Réunion.

Pattiaratchi's modelling shows debris could also drift also as far east as Tasmania or beyond.
"Our model results that we did last year predicted that within 18-24 months after the crash, it was a possibility that it would have ended up within that region," said Charitha Pattiaratchi, Professor of Coastal Oceanography at the University of Western Australia.
The point of origin "will definitely be in the Southern Hemisphere, it would be to the east, it would cover definitely the area of the physical search at the moment", he added.
That physical search, now halfway to being completed, covers 120,000 sq km of sea bed.

 Oceanographers created this chart one year ago showing the potential drift of MH370, starting from the Indian Ocean search zone.
Scientists at The University of Western Australia say there is a consistency between the current search area at Reunion Island and where debris from missing Malaysian Airlines flight MH370 could have drifted to, based on their research.
source : UWA 
Barnacle clues

Dave Gallo, who co-led the search for Air France Flight 447 that crashed in the Atlantic Ocean in 2009, warned that retracing the debris' drift through sea-current models could lead investigators astray.
"Retro-drifting" from wreckage found just five days after the Air France crash led to no breakthrough, he said.
"We spent two months in that area and found absolutely nothing. That brought mistrust from the industry," said Gallo, director of special projects at the Woods Hole Oceanographic Institution. "Looking at something that is 500 days old is going to be tough."

France's BEA crash investigation agency raised questions in 2012 over the reliability of such "reverse drift" calculations after conducting tests during the search for AF447.
It had asked the French Navy to drop nine buoys at a single spot in the Atlantic, only to find they scattered hundreds of miles apart, highlighting the "great difficulty" of predicting drift.
Experts say such divergences can increase over time.

Still, further clues might yet come from the debris.
Experts can age the barnacles that attach themselves to flotsam, which would give an idea of how long it had been in the water.
They may even be able to tell which part of the ocean it has come from by the species of barnacles attached.
"There's different barnacles in different parts of the ocean, so you might expect some CSI scenario where just by looking at the barnacles, you can pinpoint where it came from," van Sebille said.
 

Sunday, August 2, 2015

Rolling the Deep - Papua New Guinea


Eastern Papua New Guinea is one of the last unspoiled diving destinations in the world.
The diversity of life in this region is staggering.


This episode of the Rolling the Deep series focuses on the small critters of the area.
The colors and textures of these animals is an amazing and beautiful sight.
Enjoy! 


Nudibranchs are generally small, a bit like a traditional slug.
But these slugs are much more interesting that the ones we find in the garden.
The different shapes, colors, and sizes make each species of nudibranchs unique.
Hopefully with this video that is up close and personal with the nudi's, you gain the appreciation for their beauty.