We have a morbid curiosity about nautical disaster stories.
The Irish "Wreck Viewer" offers a window into centuries of marine misfortune.
After more than a century in cold and dark Antarctic waters, a legendary ship was rediscovered last month. Ten thousand feet below the frozen surface of the Weddell Sea, an underwater drone lit up the wreck of the three-master that had brought Sir Ernest Shackleton to the South Pole.
Trapped and crushed
Shackleton had wanted his Imperial Trans-Antarctic Expedition (1914-17) to be the first to cross the icy continent over land. Instead, his ship got trapped and then crushed by pack ice.
Because of their undaunted perseverance, Shackleton’s expedition is considered the last of the “heroic” explorations of the South Pole — a quality quite literally highlighted by the search team’s sub as it illuminated the ship’s name, still perfectly legible on its stern: ENDURANCE.
Shipwrecks are stories without happy endings.
They tell tales of suffering and loss.
They are memorials to the twin cruelties of nature and fate, even deadlier and more destructive when combined.
How could we not be fascinated by this nautical subgenre of the disaster story?
The question is rhetorical, unless you need reminding that Titanic was the first movie ever to gross more than $1 billion worldwide.
Three million shipwrecks
The seven seas are strewn with shipwrecks — some three million, according to one estimate, of which barely 1% have been explored.
Some of the more famous ones show up, rather disconcertingly, on in-flight maps (see Strange Maps #1115).
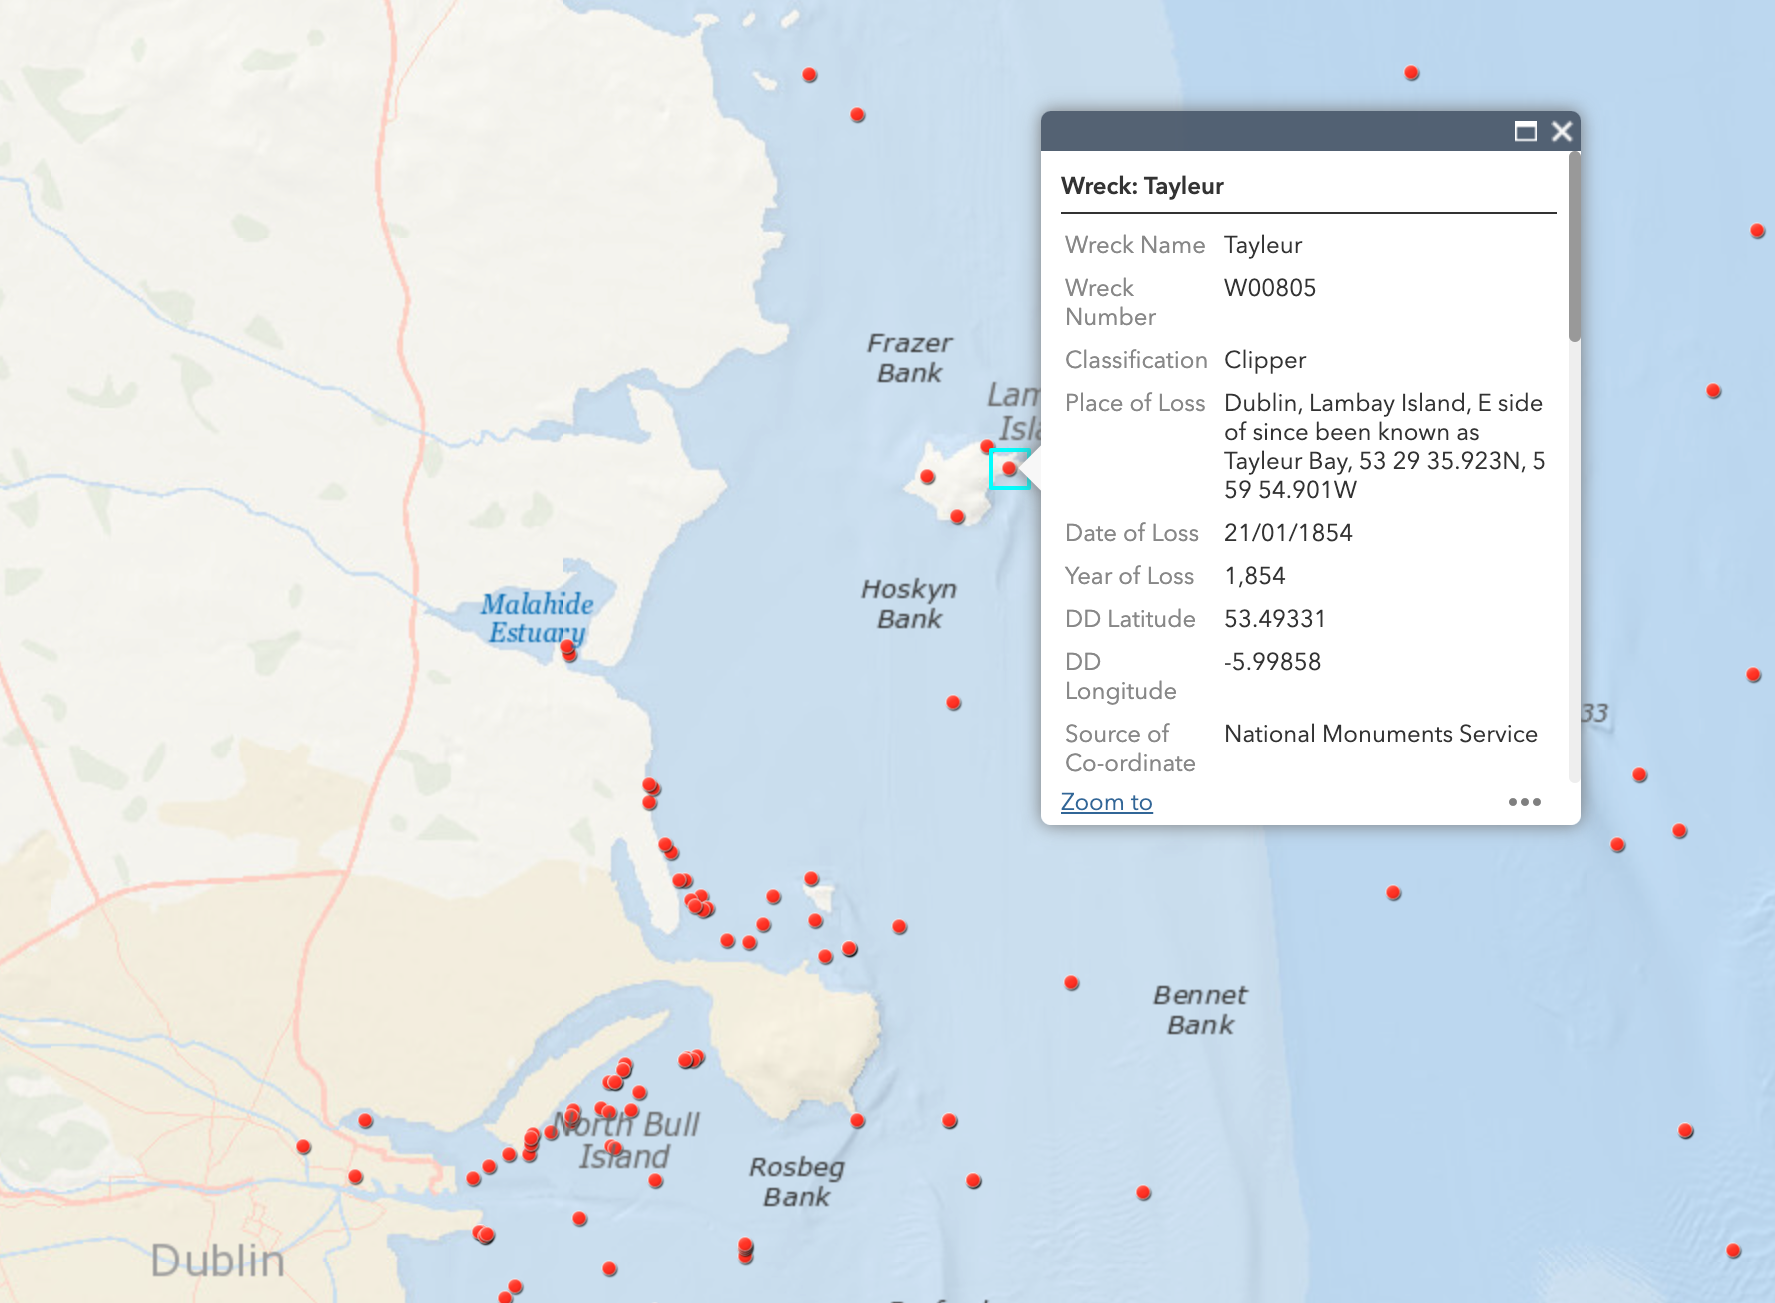
HMS Tayleur, on its maiden voyage out of Liverpool to Australia, sank off Lambay Island in 1854. (Credit: National Monuments Service (Ireland), Wreck Viewer)
Ireland, however, has chosen a more comprehensive approach.
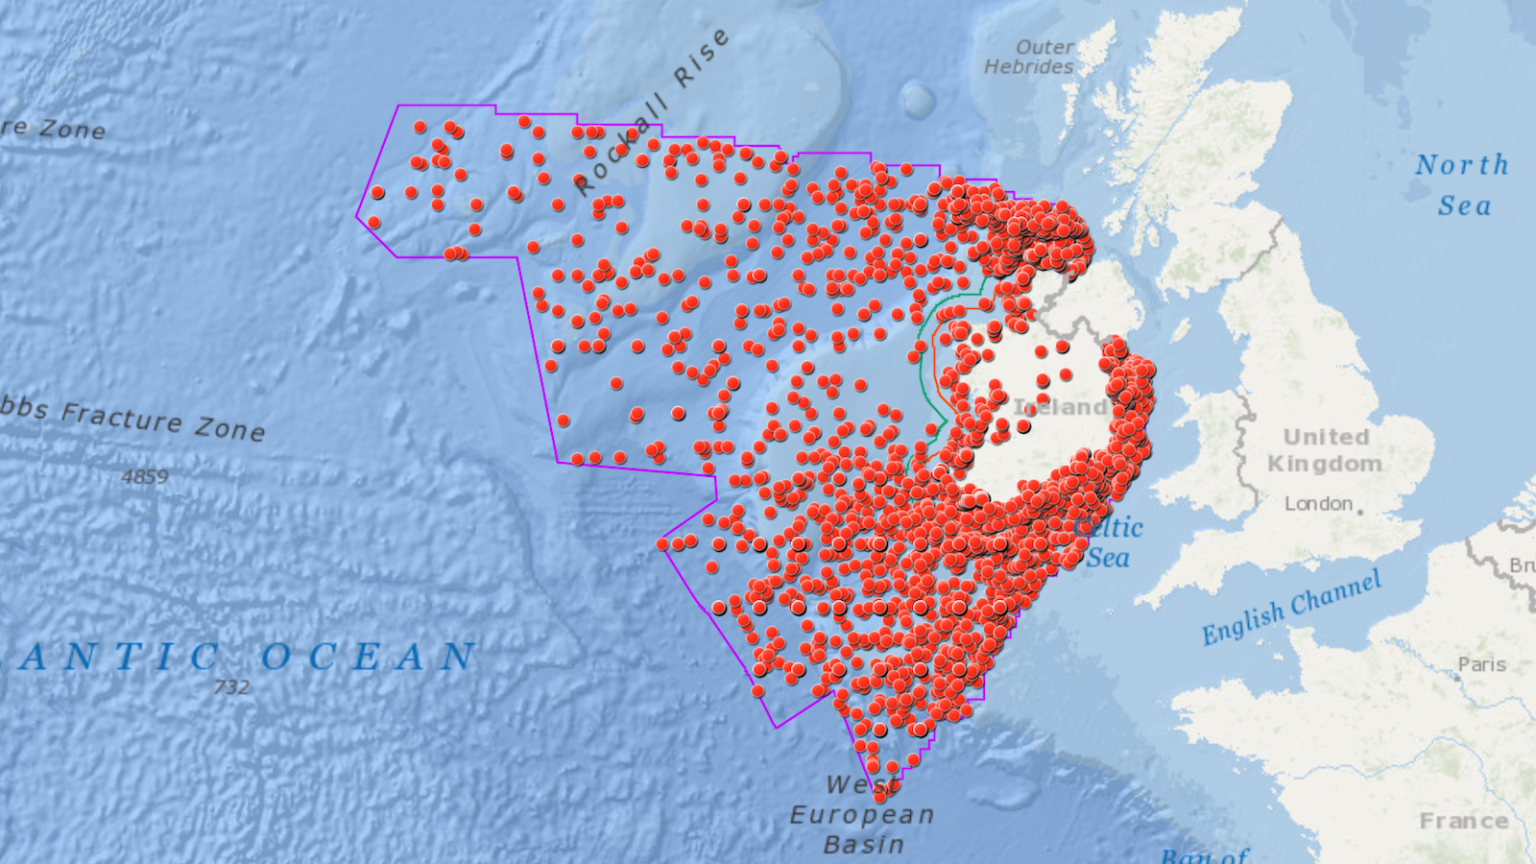
In April 2018, the country’s National Monuments Service (NMS) launched a Wreck Viewer: an interactive online map that provides information on thousands of vessels lost in Irish territorial waters, which cover 355,000 square miles (919,500 km2) of the North Atlantic.
In total, the NMS’s underwater archaeological unit has documented almost 18,000 wrecks — and not just ships, nor only at sea.
The entries include many “non-regular” vessels, such as 30 lifeboats, 192 submarines, and even 10 airplanes, as well as boats sunk in Ireland’s inland lakes and waterways, including an 11,000-year-old logboat, the oldest entry in the database.
Ireland’s shipwreck register spans the entire maritime history of Ireland, from the aforementioned prehistoric logboat and medieval trading vessels to warships, ocean liners, and even humble fishing boats, such as the one that went down in January 2017 — fortunately without loss of life.
Armada adventure ends in Ireland
Where possible, the Wreck Viewer gives information on ships’ names, date of loss, cargo, passengers, history, voyages, and location.
However, the location of almost 14,000 shipwrecks in the database is entirely unknown or cannot be fully confirmed.
So the map shows only about 4,500 of the shipwrecks in the NMS database whose precise location is known.
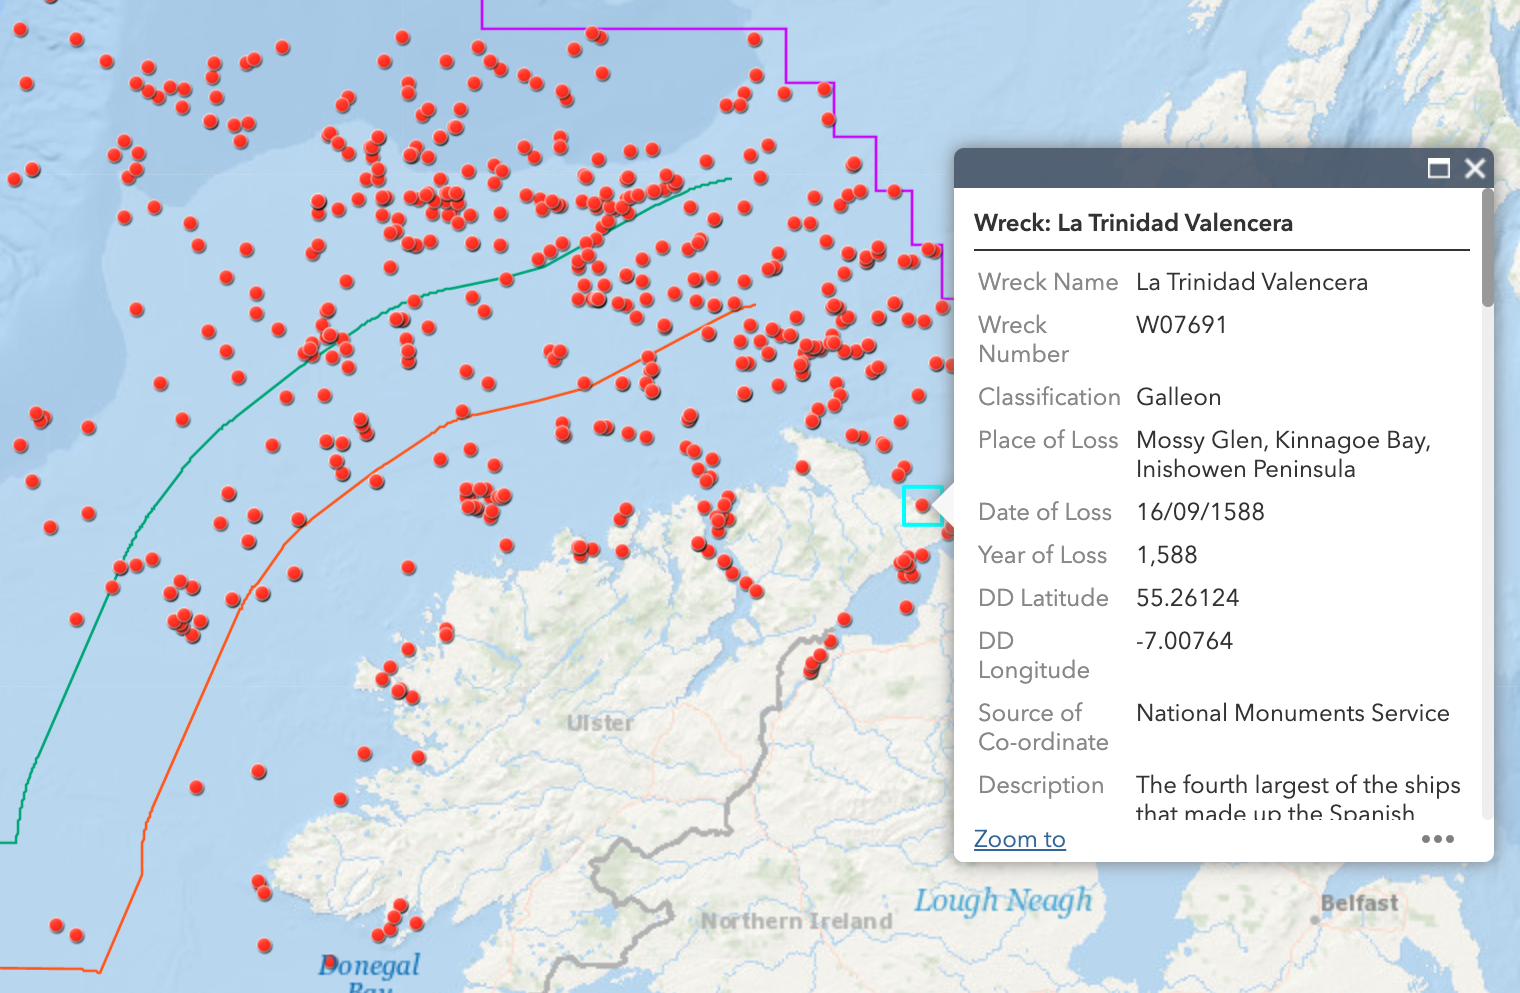
La Trinidad Valencera: once a Venetian merchantman, then a Spanish warship; now an Irish shipwreck. (Credit: National Monuments Service (Ireland), Wreck Viewer)
As the map shows, a remarkable portion of those wrecks is unknown — that is, the NMS knows of the wreck but knows little or nothing about it.
Among the oldest named wrecks logged in the database are six ships from the Spanish Armada, which in 1588 attempted to invade England.
The attempt failed, and the fleet was scattered all the way to Ireland, where several vessels sank.
These include La Trinidad Valencera (a requisitioned Venetian merchantman that was the fourth-largest ship in the Armada, sunk in Kinnego Bay, Donegal); La Juliana, Lavia, and Santa Maria de Vison (sunk near Streedagh in Sligo); the Santa Maria de la Rosa (sunk in Blasket Sound, Kerry); and the Girona (sunk off Antrim).
Another invasion force, this time destined for Ireland itself, arrived during the winter of 1796.
The French had sent a fleet of 48 ships, carrying 15,000 troops, to drive the British out of Ireland. The attempt came to nothing, mainly due to heavy weather.
Not a single Frenchman landed on Ireland, except as a prisoner of war.
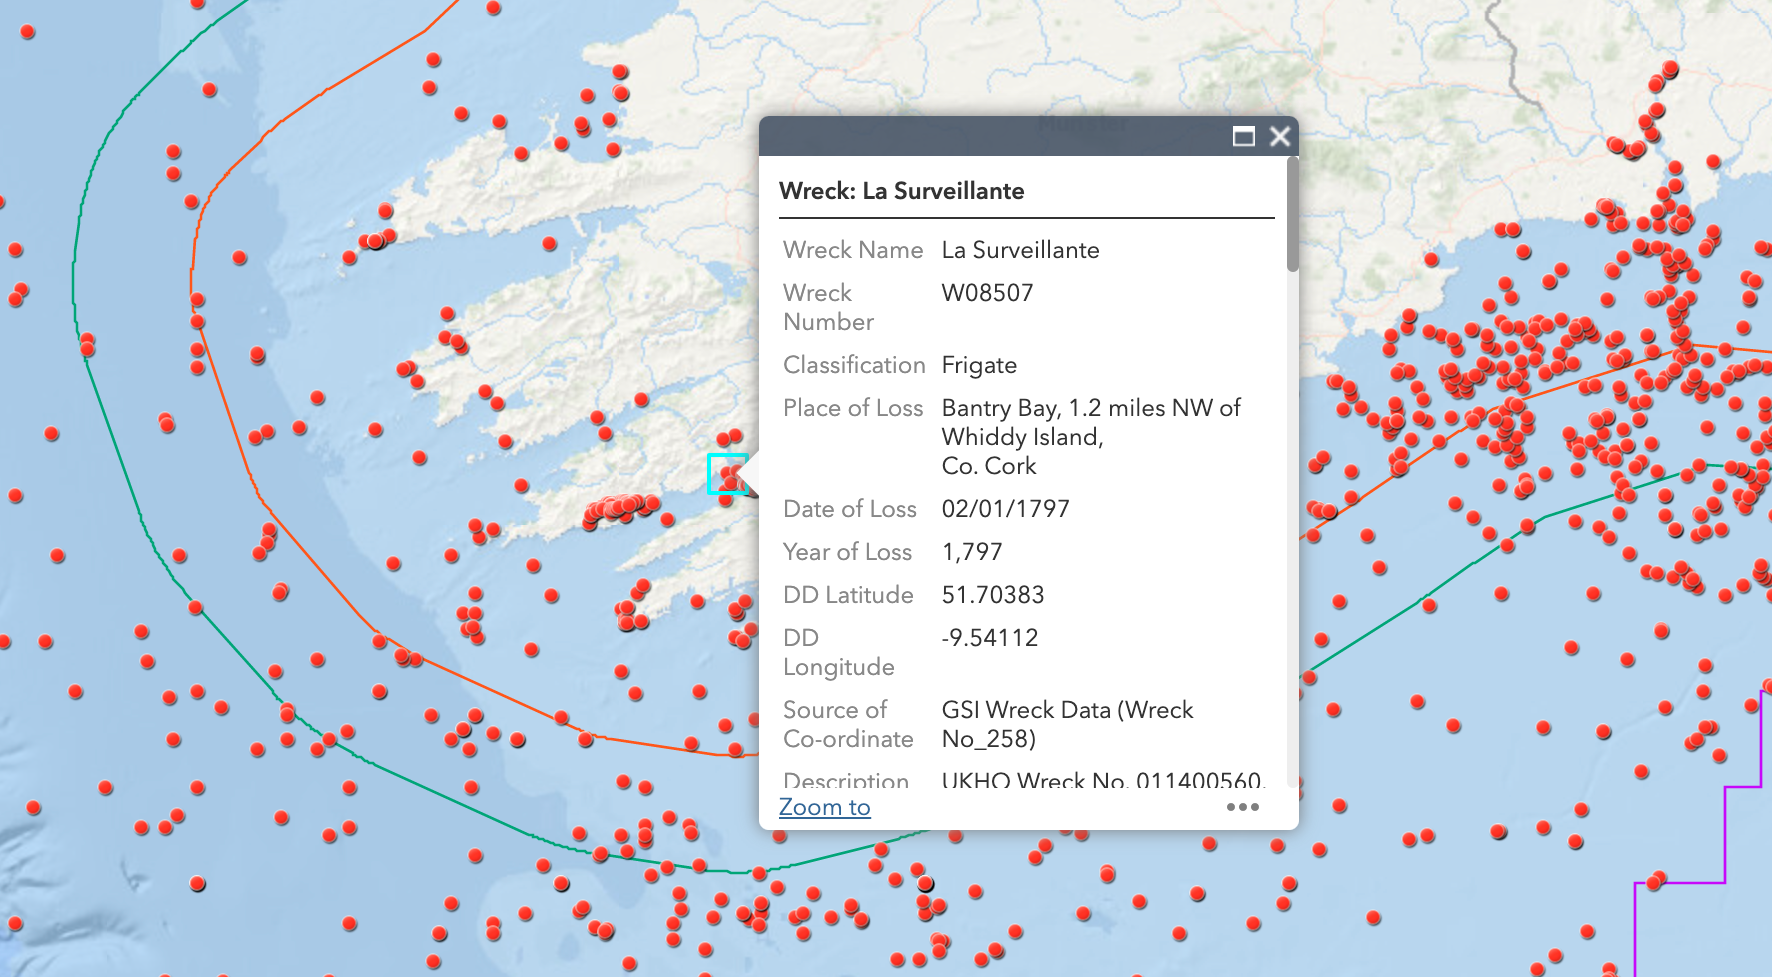
One of the invasion ships, La Surveillante, was scuttled in Bantry Bay in January 1797.
Different invasion, different bay, same result: the shipwreck of La Surveillante.
(Credit: National Monuments Service (Ireland), Wreck Viewer)
Throughout history, sea travel in the name of exploration, trade, and research has provided a watery road to modern globalism. We have always wondered at the waves, finding ways to wade deeper and wander further: The world’s oldest known boat, the Pesse canoe, dates to around 8000 BCE; there is evidence Egyptians began sailing around 4000 BCE; and the Phoenicians are credited with ship-building expertise that allowed them to circumnavigate Africa in 600 BCE. Here are 11 incredible sea voyages and voyagers that helped advance our understanding of the world.
1. Leif Erikson’s Voyage to North America // c. 1000
Born in 970, Norse explorer Leif Erikson was the second son of Erik the Red, a native of Iceland who colonized Greenland around 980. According to Viking sagas written a few centuries after the events, Erikson heard about an unfamiliar land to the west of Greenland and went to investigate it, eventually landing with a small crew on the northern peninsula of Newfoundland. Though the settlement didn't last long, archaeological evidence and the sagas suggest that Erikson’s Vikings were the first Europeans to set foot in North America.
Beginning life as Ma Sanbao in 1371, Zheng He grew up in a prosperous Muslim family in China. When he was about 10, he was captured during Emperor Hong Wu’s attack on his city and made to serve as a court eunuch. He eventually rose up the ranks, becoming a valued diplomat and commander of the Ming Dynasty’s navy. He embarked on his first voyage in 1405, commanding the emperor’s enormous fleet of “treasure ships.” Some of the hundreds of vessels were 400 feet in length, and the whole armada was crewed by 28,000 sailors. During his seven expeditions to lands surrounding the South China Sea and Indian Ocean, Zheng He helped spread China’s culture and political influence. Chinese emigration increased, as did tributes to Chinese leaders. Upon Zheng He’s death in 1433, and the establishment of a new emperor, the expeditions’ ships and logs were destroyed. This ended the “golden era” of Chinese sea exploration, making room for Europeans.
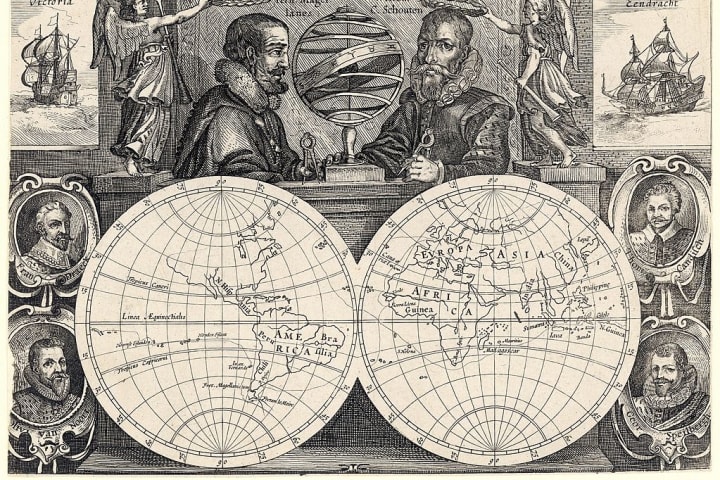
3. Ferdinand Magellan’s Circumnavigation of the Globe // 1519-1522
"The two sides of the globe." Ferdinand Magellan and Willem C. Schouten are both holding protractors above the maps.
Imagno/Getty Images
Portuguese sailor Ferdinand Magellan’s voyage is credited with being first to circumnavigate the globe. In 1519, approximately 260 men and five shipsset sail from Spain, searching for a western route to the Spice Islands (in modern-day Indonesia). Magellan named the Pacific Ocean (Pacific means “peaceful”) and discovered the Strait of Magellan at the bottom of South America by accident (it's still used to this day for navigation between the Atlantic and Pacific). While Magellan deserves his due for masterminding the voyage, a poison arrow ended him in 1521 upon his arrival in the Philippines. According to some historians, Enrique, an enslaved Malay man in Magellan’s crew, completed the circumnavigation first, albeit over more than one voyage, before Magellan’s remaining 18 crewmembers made it back to Spain in 1522.
4. “Pirate Queen” Grace O’Malley’s Defense of Ireland // c. 1546-1586
Irish seafarer Gráinne Ní Mháille, a.k.a. Grace O’Malley, a.k.a. Ireland’s pirate queen, is considered one of the last Irish clan rulers to fight against English domination in Ireland. Born in 1530, Grace began her high-stakes, high seas career at age 11, when Ireland was ruled by about 40 Gaelic clans (the O’Malley clan motto was “powerful by land and by sea”). When her father died, it was Grace and not her elder brother who became clan leader, managing two galleys, 20 ships, and more than 200 men to plunder coastal strongholds and defend against English encroachment. When Grace negotiated the release of prisoners and seized land with Queen Elizabeth I, she demanded an audience as an equal. A respected matriarch in her time, she was omitted from history for centuries. Today, she is celebrated for her leadership at sea.
5. The Sea Venture’s Adventure // 1609-1610
The Sea Venture has been dubbed “the shipwreck that saved Jamestown” and inspired William Shakespeare while he wrote The Tempest. The ship, part of a convoy sent from England in 1609, was supposed to resupply the desperate Virginia colony. But when it sailed straight into a hurricane and rammed a reef around then-uninhabited Bermuda, the Sea Venture’s adventure appeared to be over. However, all 150 souls aboard survived by swimming to shore and set about building two new ships to take them the rest of the way. The castaways arrived in Jamestown about 10 months later. Their story of survival not only restored England’s desire to make its American colony a success; it also led to the second English colonyestablished in the Americas—not in New England, but in Bermuda.
6. The Mayflower’s Arrival in North America // 1620
"Pilgrim Fathers boarding the Mayflower for their voyage to America," after a painting by Bernard Gribble (1872 - 1962) / Ann Ronan Pictures/Print Collector/Getty Images
The Mayflower, a second-hand merchant ship carrying 102 passengers, left Plymouth, England, for North America in 1620. Forty of the passengers were Protestant separatists (later known as Pilgrims) who sought to establish a colony in America where they could practice their religion freely. They had permission to settle anywhere on the coast between the Chesapeake Bay and New York Harbor. But two miserable months after launch, the Mayflower landed in New England, about one degree of latitude north of where it was meant to be. The colonists named the new settlement Plymouth, drafted a document to set guidelines for self-governance, and launched a historic experiment in democracy and religious freedom.
7. The Three Voyages of James Cook // 1768-1780
James Cook vowed to sail “as far as I think it possible for man to go” and ended up mapping more territory than any other mariner of his era. He joined the British Royal Navy in his twenties, and in 1767 produced a chart of Newfoundland that was so accurate it was still being used in the 20th century. Cook led his first exploratory expedition in 1768, destined for the South Pacific to observe the transit of Venus and to chart New Zealand, Tasmania, and parts of Australia. He came quite close to spotting Antarctica during a second circumnavigation to explore and map several South Pacific islands. In 1776, on his third and last epic voyage, Cook came within 50 miles of the western entrance to the Northwest Passage in the Bering Strait. He was the first European commander to visit Hawaii, where friction increased between his crew and the local people; Cook was killed by Native Hawaiians in 1779 and the expedition concluded without him the following year. Among his countless observations and discoveries, Cook found that fresh fruits seemed to prevent scurvy, without knowing just how the remedy worked.
8. The Wreck of the Whaler Essex // 1820
Another voyage serving up literary inspiration is the tale of the Essex. An 87-foot whaling ship, the Essex was built of incredibly strong white oak and fitted for a 2.5-year voyage. It left Nantucket in 1819, made its way around Cape Horn, and headed into the South Pacific. On November 20, 1820, an 85-foot sperm whale rammed the ship twice and caused it to sink, serving some small measure of justice on behalf of his species (numbering 300,000 today from an estimated 1.1 million prior to whaling). While the 20 crewmembers initially survived, they drifted in boats across the open ocean for three months and eventually resorted to cannibalism. Only eight made it home. Herman Melville based the climactic scene in Moby-Dick on the Essex tragedy.
9. Charles Darwin’s Voyage on the HMS Beagle // 1831-1836
HMS 'Beagle' laid ashore, Rio Santa Cruz, Patagonia, South America, 1834 (1839). / The Print Collector/Getty Images
Charles Darwin said his education “really began aboard the Beagle.” A fresh university graduate at age 22, Darwin paused his planned career as a clergyman and joined the Beagle as its naturalist. Setting sail in 1831, the ship’s mission was to journey around the world, surveying the South American coast and conducting chronometric studies. Time spent in the Galápagos truly informed Darwin’s theories on evolution, providing an opportunity to observe species development in an isolated environment. Darwin also considered coral, recording geological observations about islands and coastlines. And the Beagle, commanded by Lieutenant Robert FitzRoy, achieved its goal of accurately charting the coast of South America, including the Strait of Magellan's dangerous shoals.
10. Ernest Shackleton’s Miraculous Endurance // 1914-1916
Anglo-Irish mariner Ernest Shackleton first sailed to Antarctica in 1901 on a mission to reach the South Pole, which ended with a bad case of scurvy. He would come within 97 nautical miles of the pole on his second expedition. But it was his third venture aboard the Endurance for which he is most famous. In 1914, he led a crew of 28 men intending to be the first to cross Antarctica by land, but the ship became trapped in pack ice for 10 months and sank on November 21, 1915. The crew set up camp on ice floes, drifted on treacherous seas, and washed up on an uninhabited polar island. Shackleton and five men then sailed 800 miles across the planet’s most rambunctious seas for rescue. All hands succeeded in their revised mission: survival. Shackleton’s story serves as a lesson in leadership against all odds and overcoming outrageous obstacles.
11. Thor Heyerdahl’s Maritime Experiment in the Kon-Tiki and More // 1947-1978
Thor Heyerdahl, a Norwegian ethnologist, mounted several transoceanic scientific expeditions. His expeditions on the Kon-Tiki, a balsa-wood raft launched in 1947, and Ra, a copy of an Egyptian reed boat crewed in 1969, proved the possibility of ancient contact between distant civilizations. Leaving from Peru, Kon-Tiki reached the South Pacific three and a half months later, lending evidence to the theory that pre-Columbian sailors could have navigated across the Pacific. Ra sailed from Morocco to within 600 miles of Central America and hinted at the possibility that Egyptian mariners could have influenced pre-contact cultures. And in 1977-1978, sailing a reed boat named the Tigris, Heyerdahl suggested that ancient Sumerians could well have reached southwest Asia. His thought-provoking theories are still being debated.
Ahead of Columbus Day, findings pose further questions of what the explorer really expected to find on his voyage.
New analysis of ancient writings suggests that sailors from the Italian hometown of Christopher Columbus knew of America 150 years before its renowned ‘discovery.’
Transcribing and detailing a, circa, 1345 document by a Milanese friar, Galvaneus Flamma, Medieval Latin literature expert Professor Paolo Chiesa has made an “astonishing” discovery of an “exceptional” passage referring to an area we know today as North America.
According to Chiesa, the ancient essay – first discovered in 2013 – suggests that sailors from Genoa were already aware of this land, recognizable as ‘Markland’/ ‘Marckalada’ – mentioned by some Icelandic sources and identified by scholars as part of the Atlantic coast of North America (usually assumed to be Labrador or Newfoundland).
Supposed portrait of Christopher Columbus, by Sebastiano del Piombo, 1519.
Published in the peer-reviewed journal Terrae Incognitae, the discovery comes ahead of Columbus Day 2021, alternatively celebrated as Indigenous Peoples’ Day across many states in the US.
The findings add more fuel to the fire for the continuing question of ‘what, exactly, did Columbus expect to find when he set out across the ocean?’ and come following a period in which his statues have been beheaded, covered with red paint, lassoed around the head and pulled down, set on fire and thrown into a lake.
“We are in the presence of the first reference to the American continent, albeit in an embryonic form, in the Mediterranean area,” states Professor Chiesa, from the Department of Literary Studies, Philology and Linguistics at the University of Milan.
Galvaneus was a Dominican friar who lived in Milan and was connected to a family which held at the lordship of the city.
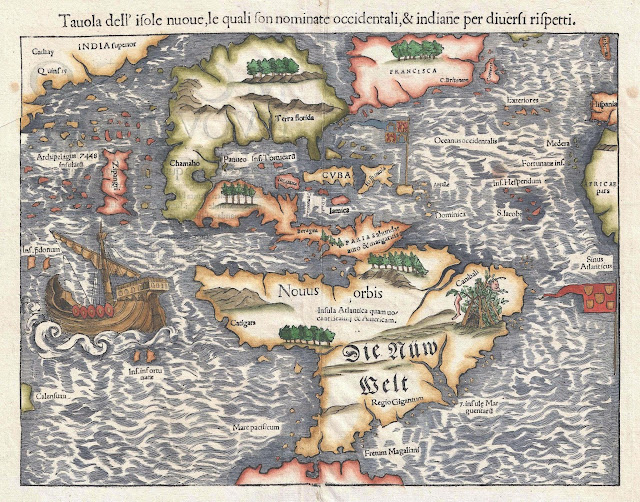
This 1558 map by Sebastian Münster shows what most of the world knew of the Americas by then.
This map was made just some 50 years after Columbus’ last voyage in 1502-1504, and some 200 years after Galvaneus Flamma’s accounts.
(Geographicus/Wikimedia Commons)
He wrote several literary works in Latin, mainly on historical subjects.
His testimony is valuable for information on Milanese contemporary facts, about which he has first-hand knowledge.
Cronica universalis, which is analyzed here by Chiesa, is thought to be one of his later works – perhaps the last one – and was left unfinished and unperfected.It aims to detail the history of the whole world, from ‘Creation’ to when it was published.
In translating and analyzing the document, Professor Chiesa demonstrates how Genoa would have been a “gateway” for news, and how Galvaneus appears to hear, informally, of seafarers’ rumors about lands to the extreme north-west for eventual commercial benefit – as well as information about Greenland, which he details accurately (for knowledge of the time). “These rumors were too vague to find consistency in cartographic or scholarly representations,” the professor states, as he explains why Marckalada wasn’t classified as a new land at the time.
Regardless though, Chiesa states, Cronica universalis “brings unprecedented evidence to the speculation that news about the American continent, derived from Nordic sources, circulated in Italy one and half centuries before Columbus.”
He adds: “What makes the passage (about Marckalada) exceptional is its geographical provenance: not the Nordic area, as in the case of the other mentions, but northern Italy. “The Marckalada described by Galvaneus is ‘rich in trees’, not unlike the wooded Markland of the Grœnlendinga Saga, and animals live there. “These details could be standard, as distinctive of any good land; but they are not trivial, because the common feature of northern regions is to be bleak and barren, as actually Greenland is in Galvaneus’s account, or as Iceland is described by Adam of Bremen.”
Overall, Professor Chiesa says, we should “trust” Cronica universalis as throughout the document Galvaneus declares where he has heard of oral stories, and backs his claims with elements drawn from accounts (legendary or real) belonging to previous traditions on different lands, blended together and reassigned to a specific place.
Planisphere made by Rumold Mercator, 1587.
“I do not see any reason to disbelieve him,” states Professor Chiesa, who adds, “it has long been noticed that the fourteenth-century portolan (nautical) charts drawn in Genoa and in Catalonia offer a more advanced geographical representation of the north, which could be achieved through direct contacts with those regions.
“These notions about the north-west are likely to have come to Genoa through the shipping routes to the British Isles and to the continental coasts of the North Sea.
“We have no evidence that Italian or Catalan seafarers ever reached Iceland or Greenland at that time, but they were certainly able to acquire from northern European merchant goods of that origin to be transported to the Mediterranean area.
“The marinarii mentioned by Galvaneus can fit into this dynamic: the Genoese might have brought back to their city scattered news about these lands, some real and some fanciful, that they heard in the northern harbors from Scottish, British, Danish, Norwegian sailors with whom they were trading.”
Cronica universalis, written in Latin, is still unpublished; however, an edition is planned, in the context of a scholarly and educational program promoted by the University of Milan.
On March 9th, 2020, ICEYE is publishing the first in-orbit demonstration of synthetic-aperture radar (SAR) videos, acquired with ICEYE SAR satellites. In these scenes, you can detect and analyse movement in a new way, giving insights into what is happening on the ground during a single SAR satellite pass over the location.
The adoption of Earth Observation satellite technologies is accelerating. More and more companies and institutions are using satellite imagery to better understand the world and more closely observe relevant changes. However, those actors are also coming to the realization that optical satellite systems have their limitations. The biggest barriers to the use of satellite imagery are cloud cover and limited usability of the data at night—of course, earthquakes or floods can happen at any time, regardless of the weather or time of the day. Fortunately, optical images are not the only way to visualize the earth’s surface from a satellite. Synthetic Aperture Radar, or SAR, is a completely different way of generating a picture, actively ‘illuminating’ the ground rather than utilizing the light from the sun (as with optical images). SAR satellites beam radar waves to the surface of the earth and map the reflected signal. The system can penetrate clouds, see beneath tree canopies, and work in all weather conditions.
Satellite image in Luhansk and Donetsk (credited to Copernicus Open Access Hub) Left: Nothing can be observed in Sentinel-2 optical image, date: 27/02/2022 Right: Everything is clear in Sentinel-1 SAR image, date: 28/02/2022
It is also a rapidly growing part of the New Space movement, with several startups developing SAR microsatellites and challenging the more established players in the sector.
The technology is attracting more interest—and with it, more finance.
Capella Space, a company in the United States, has raised a total of $80 million; and Spacety in China has also completed Series C financing recently.
The New Space movement is also accelerating the access and availability of SAR data and analytics that can be built on the top with companies like UP42 among others pushing the industry forward.
Comparison between Optical and SAR (credited to Ursa Space)
SAR raw data from ERS-1 satellite (credited to ESA)
If users hope to obtain detailed information from SAR data, they need professional processing tools and knowledge.
One of the limitations of working with SAR data is the tedious preprocessing, which can include: applying the orbit file, radiometric calibration, de-bursting, ‘multilooking’, speckle filtering, and terrain correction.
After a long series of mathematical calculations and processing, a final image will float up to the surface.
In contrast to a colourful optical satellite image, SAR images are always black and white. In fact, this is not the color of the object, but the strength of the backscatter signal, which is rendered as brightness. For example, water absorbs most of the energy and doesn’t reflect much back, so it looks black in the image. Objects with a high metal content—such as ships, skyscrapers, and planes—appear much brighter, because they reflect most of the energy.
Since the data is so hard to process and interpret, lots of SAR companies don’t even provide the raw data to clients.
Some of them, like ICEYE, only provide useful information from the interpreted results—flooding information, for example, as an Excel Sheet or Shapefile.
SAR market and demand
In recent years, SAR images have played an increasingly important role in international emergency events, such as the drone attacks against Saudi oil installations in 2019 and the Ever Given ship blocking the Suez Canal in 2021.
Events like these have a massive effect on the global financial market, and it is intolerable for customers if the satellite images are not instantly available due to weather.
In these cases, more and more satellite solution providers are using SAR data in addition to traditional satellite images, to provide a better service.
According to the market report from Mordor Intelligence, the Global SAR Market was valued at $3,3 billion in 2020, and it is expected to reach $6,5 billion by 2026—representing a compound annual growth rate (CAGR) of 11.6% during the period of 2021–2026.
The 11th Edition of NSR’s Satellite-Based Earth Observation reports that the sale of SAR data and derived products is going to see significant growth in annual global revenues, from $700M in 2018 to over $1.7B by 2028. Imagery sales and information products are predicted to dominate, responsible for 63% of SAR revenues in this timeframe. Very-high-resolution imagery (<0.5m) has become the fastest developing market, while high-resolution (0.5-1m) occupies the biggest part of the current market. However, not all the SAR satellites are able to follow this wave of growth. According to NSR’s report, medium resolution (1-5m) market share began to decrease after 2017. Low resolution, meanwhile, presents limited commercial value. It seems that the providers of low-resolution SAR data will need to adapt as high-resolution commercial data brings much more value to clients.
Market demand
The largest demand for SAR satellite images comes from the Military and Defense Sector.
It’s estimated that the government and military currently constitutes 70% of the market in SAR.
It’s no wonder, as there are myriad military applications for SAR, such as detecting surface features like building complexes, missile sites, and topographical features of the surrounding terrain.
The biggest individual buyer of SAR satellite image also comes from the Military and Defense Sector: the National Geospatial-Intelligence Agency (NGA).
Until 2019, the NGA had a $10 million contract with MDA for SAR satellite images.
The agency renewed that contract in 2019 and now pays four image providers a total of $85 million dollars per year.
Besides the Military and Defense Sector, the Financial and Insurance Sectors are also rapidly growing markets, with a CAGR of 14%.
It seems that enterprises in this business area are slowly starting to realize the value of SAR data (e.g., flood monitoring in insurance), but such a market requires many years to reach maturity and shift from traditional methods of doing business.
Traditionally, SAR satellite constellations are based on government programs building large, heavy, and costly satellite units and sensors, offering fairly low revisit rates and requiring significant investment—such as the Sentinel-1 mission.
But just like the optical imagery sector, startups such as ICEYE and Capella have challenged the traditional model of building microsatellite constellations.
These startups believe that the lack of available SAR satellite imagery is the only reason why SAR applications are not more widely used.
As more and more SAR satellite images become available, new applications will be explored—and will prove to deliver high-quality data at a fraction of the price.
The history and development of SAR
SAR is not a new technology; it started in the US nearly 70 years ago. However, the application of SAR has only become popular over the past decade.
So, why has the development taken such a long time?
And what are the critical acceleration factors?
1951–2000: Limited technology in Defense sector
Radar has a history stretching back nearly 100 years.
The traditional application of radar is to display the position and motion of highly reflective objects (such as aircraft or ships) by sending out a radio wave signal and then detecting the direction and delay of the reflected signal.
Imaging radar, meanwhile, attempts to form an image of such an object.
The origin of the technology dates back to 1951, when Carl Wiley from Goodyear Aircraft Company had a new idea based on the Doppler effect.
He realized that if radar pulses were coherent and consistent, users could process the pulses and create two-dimensional imagery with improved resolution.
The more observations, the better spatial resolution of the object. These assumptions were the beginning of SAR technology.
In 1960, the first SAR experiment was successfully completed in Washington, and in 1978, NASA’s Jet Propulsion Laboratory launched the first SAR satellite (SEASAT-1).
Until 1990, the research of SAR technology was concentrated in the US.
However, from 1990 to 2000, SAR technology started to come out from the laboratory, and Europe, Canada, Russia, Japan, and many other countries started to build SAR satellites.
They were quickly followed by China, South Korea and India, and other countries with developing space industries. However, the high-resolution SAR technology was still limited to the Military and Defense sectors due to its high cost.
1995–2013: Rapid development of technology and the beginning of commercial applications
For years, SAR technology has been limited to military and research domains, but the first country to commercialize SAR satellite imagery was Canada.
In 1995, RADARSAT-1 was launched, using a C-band sensor at a single microwave frequency of 5.3 GHz.
RADARSAT-1 was Canada’s very first commercial Earth observation satellite.
Although the resolution of RADARSAT-1 was far from adequate for most industrial applications, the project marked the beginning of the commercial SAR era.
The first sub-meter radar imagery for commercial applications was launched in 2007.
Both TerraSAR-X, launched by Germany, and COSMO-SkyMed, used X-band wavelengths.
However, at this point, SAR satellites were still large units.
The overall number of satellites was insufficient and the data was very expensive.
The price of an image could be three times that of optical satellite images at the same resolution.
2014–: Sentinel-1 providing free images
While the commercialization of SAR satellites developed slowly, a breakthrough occurred in 2014, when the European Space Agency launched the first of its Sentinel-1 satellites, as the first part of the Copernicus satellite constellation.
This first mission was composed of a constellation of two C-band satellites, Sentinel-1A and Sentinel-1B (the latter launched in 2016).
The ESA and European Commission’s policies make it easy to acquire Sentinel-1’s data and use it for public, scientific, or commercial purposes, for free.
At the same time, the ESA Technology Transfer and Business Incubation Office initiated its ESA Business Incubation Centres (ESA BICs) to turn space-connected business ideas into startups.
Over 700 startups have been fostered throughout Europe to date—and more than 180 new startups are taken in by the ESA BICs every year.
In addition, various startup competitions and accelerators—such as Copernicus Master and Copernicus Accelerator—also push forward the application of SAR satellite images.
With the policy of free data and support, many SAR startups grew rapidly in this period, especially those using InSAR technology.
After five years of development, almost all InSAR companies were using Sentinel-1 images.
Sentinel-1’s freely available 10m imagery, with its 6–12-day revisit, proved quite satisfactory for the existing ecosystem of SAR data users.
However, while this helped to grow the downstream application by lowering the barrier to entry, it limited the data sale opportunities and therefore piled tremendous pressure on upstream SAR satellite manufacturers.
Medium resolution (1m-5m) satellites are now gradually declining, and low-resolution SAR satellites have already lost their market.
The new era of SAR satellites
Around 2015, the new era of the space sector started to emerge with the development of microsatellite constellations.
This was triggered by the reduction in launch costs, significantly lowering the entry barrier for startups.
As the launch cost dropped—from several dozen million dollars to about $100k—the satellite startups could refocus the approach to building satellites.
Traditionally, the building costs of large satellites could easily reach hundreds of millions of dollars to ensure component stability.
The shift, enabled by Planet’s development of small, compact ‘CubeSats’, welcomed in a new paradigm.
Companies began getting space platforms ready for launch faster than ever by using commercial off-the-shelf components.
Supported by favorable policies and space agencies, the development of the sector accelerated.
In 2014, ICEYE was founded in Aalto University, Finland, and in 2018, the 70kg ICEYE-X1 was launched as the first satellite under 100 kg to carry a SAR sensor—as well as the first Finnish commercial satellite.
After eight years of development, the company became the best small satellite startup in Europe.
ICEYE has already launched 16 satellites into orbit, and they plan to launch a further 10 in 2022.
In the US, the SAR startup Capella Space was founded in 2016.
In 2018, the company launched their first commercial SAR satellite, Denali, as a test mission, and in 2020, launched the Sequoia satellite.
Capella Space has so far put 5 satellites into orbit, and the eventual plan is a 36-satellite constellation with hourly global revisits.
Applications
SAR has been used in a wide range of applications, from studying Antarctic icebergs and detecting changes in habitat, to mapping the effects of natural or human disturbance.
The applications are still being explored as the private sector and startups enter the market. ICEYE, for example, is today focusing nearly exclusively on flood monitoring, and attempting to disrupt the global insurance business.
Capella Space, meanwhile, concentrates on change detection monitoring, maritime, and disaster response applications.
The ICEYE synthetic-aperture radar (SAR) satellite constellation is already today providing data to organizations around the world.
The imaging and vessel detection data that is provided by this technology is a vital next leap in how nations can secure their maritime areas.
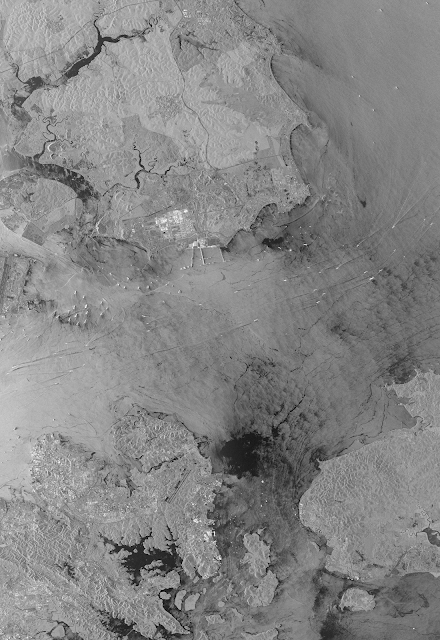
On August 5th, 2020, a large explosion occurred in the Port of Beirut, equivalent to 100 tons of TNT.
Buildings and warehouses nearby were destroyed.
The initial destruction, resumption of activity, and reconstruction of the port are all monitored by SAR-based change detection.
SAR satellites can also detect flood and wildfire emergencies.
When Hurricane Dorian struck the Bahamas in 2019, SAR imagery played an important role in revealing the extent of flooding.
2. Maritime and coastal zone monitoring:
On July 25th, 2020, a ship ran aground south of Mauritius, and spilled at least 1,000 tons of oil into the Indian Ocean.
The progress of the leak as well as the rescue operations of firefighting vessels were all recorded by the Sentinel-1 satellite.
Nowadays, detection of oil spills, shallow water bathymetric mapping, ship detection in coastal regions, forecasting sea state for offshore operations and marine engineering, and marine gravity anomaly mapping for offshore hydrocarbon exploration are some examples of Maritime and Coastal zone
Monitoring.
3. Land monitoring:
A ground deformation analysis was conducted for approximately three years (July 2018 to June 2021) in Guatemala City and its suburbs by SAR startupSynspective.
In the past, the amount of ground deformation was seldom measured, and only when a landslide or other ground disaster occurred would the counterpart agency staff go to the site in response.
Thanks to SAR technology, localized subsidence phenomena and areas that show sinkage and landslide risks can be identified by characteristic fluctuation analysis.
4. Agriculture and vegetation:
In Peru, canopy formation, density, and the growth rate of asparagus crops have been monitored by Sentinel-1 satellite since 2019.
Differences in surface ‘roughness’ are indicative of field boundaries and sizes, as well as helping to detect planting and harvest events.
The assessment of crop damage caused by a natural disaster can also be detected.
Key players
There are two groups of key players in the SAR satellite industry: Governments and startups. However, they are playing different games.
Government groups tend to focus on large satellites.
Limited by the cost and competitive advantage, none of the startups dare to enter the game of large SAR satellites, and almost all large satellites are manufactured by government or state agencies.
As a result, the competition between large SAR satellites is actually a competition between countries.
The United States, the traditional top player in the aerospace industry, had a big advantage in SAR technology—until European players joined the game.
To ensure their advantage in the military, the US for a long time declined to share SAR technology with potential rivals.
The commercial SAR satellite waves therefore mainly came from Canada and European countries (particularly Germany and Italy). In the last ten years, Japan, Argentina, China, and India have also joined the competition.
Since Sentinel-1B stopped working at the end of 2021, faith in large satellites has also been lost to an extent. Pressure is also coming from the small satellite startups—ICEYE from Finland and Capella Space from the US are becoming the main players in this game.
Japan and China also have some startups which have successfully launched small SAR satellites into orbit.
Classical satellite view with nautical chart overlay
Future trends
Compared to the wide range of uses for optical data, there are still only a few applications of SAR data in the commercial space.
Thus, there is still a lot of work to be done to encourage adoption.
However, the growth in the number of small SAR satellites is likely to at least be maintained in the next five to ten years, and more startups will be keen to get involved.
For the industry, emergency response offers big opportunities for new startups.
Climate change is causing extreme weather events to occur with an increasingly alarming frequency. This trend will only increase over the next 50 years.
The safety of infrastructure, including buildings and transportation facilities, will have to be carefully monitored by multiple stakeholders.
At the same time, the international political atmosphere hasn’t been this tense for a long time.
It is pushing governments to gather better data and information for decision-making purposes regardless of weather conditions or time of the day. SAR satellite is the only tool that has this ability, so more funding will inevitably be pumped into the SAR industry, accelerating the R&D process.
However, the opportunities for new entrants in the space are decreasing.
In-orbit verification, financial support, and customer recognition are the three big challenges for startups.
New startups will be obsolete quickly if they cannot verify in-orbit within three years.
The high risk involved in the commercial satellite industry has resulted in an extreme Matthew Effect (accumulated advantage) from venture capital.
More financial support is most likely to be provided for those startups completing in-orbit verification and building constellations progressively—while the ones that fail to verify in time will just be kicked out of the market.
One of the key barriers in working with SAR data is access to high-resolution commercial datasets as well as for analytics.
With easier access, the data analysis methods and algorithms will follow.
Today working with SAR data requires significant remote sensing experience and using complex tools.
Democratisation of SAR data access will also accelerate the ease of use and will make analytical models more available to the general public.
The key characteristics of the future development of the entire industry are as follows:
Smaller and lighter: The R&D and investment costs of large and medium-sized satellites are prohibitive for a startup. Therefore, the only opportunities left for startups are small satellites (under 200kg).
Constellations: Every startup has a plan to build a large satellite constellation. But the one who makes it will be the final winner. Talk is cheap; show me the satellite!
Easier analysis, simpler processing: Analysis of SAR data requires a lot of time, expertise, and computational tools. Industrial image organizing and processing software was originally developed for the human eye—for optical not radar—leaving SAR lagging behind and more expensive. Making analysis easier and simplifying the processing chain will attract more students and players to the SAR industry.
From upstream to downstream: Increasingly, satellite manufacturers hope to do more in downstream applications—and vice versa.
Conclusions
“A picture is worth a thousand words”, and it is certainly the case for satellite data.
However, sometimes these pictures are worth nothing at all if covered by clouds or captured at night.
These limitations pushed scientists to create a need for new types of sensor technologies like Synthetic Aperture Radar.
The SAR industry is still in the early stage of development but with increasing demand to better understand our environment and changing planet, space is wide open for more New Space companies to emerge and disrupt the sector with new applications of SAR data.
‘This event is completely unprecedented and upended our expectations about the Antarctic climate system,’ one expert said
The coldest location on the planet has experienced an episode of warm weather this week unlike any ever observed, with temperatures over the eastern Antarctic ice sheet soaring 50 to 90 degrees above normal.
The warmth has smashed records and shocked scientists.
“This event is completely unprecedented and upended our expectations about the Antarctic climate system,” said Jonathan Wille, a researcher studying polar meteorology at Université Grenoble Alpes in France, in an email. “Antarctic climatology has been rewritten,” tweeted Stefano Di Battista, a researcher who has published studies on Antarctic temperatures. He added that such temperature anomalies would have been considered “impossible” and “unthinkable” before they actually occurred.
What is considered “warm” over the frozen, barren confines of eastern Antarctica is, of course, relative. Instead of temperatures being minus-50 or minus-60 degrees (minus-45 or minus-51 Celsius), they’ve been closer to zero or 10 degrees (minus-18 Celsius or minus-12 Celsius) — but that’s a massive heat wave by Antarctic standards.
The average high temperature in Vostok — at the center of the eastern ice sheet — is around minus-63 (minus-53 Celsius) in March. But on Friday, the temperature leaped to zero (minus-17.7 Celsius), the warmest it’s been there during March since record keeping began 65 years ago. It broke the previous monthly record by a staggering 27 degrees (15 Celsius).
“In about 65 record years in Vostok, between March and October, values above -30°C were never observed,” wrote Di Battista in an email.
Vostok, a Russian meteorological observatory, is about 808 miles from the South Pole and sits 11,444 feet above sea level. It’s famous for holding the lowest temperature ever observed on Earth: minus-128.6 degrees (minus-89.2 Celsius), set on July 21, 1983.
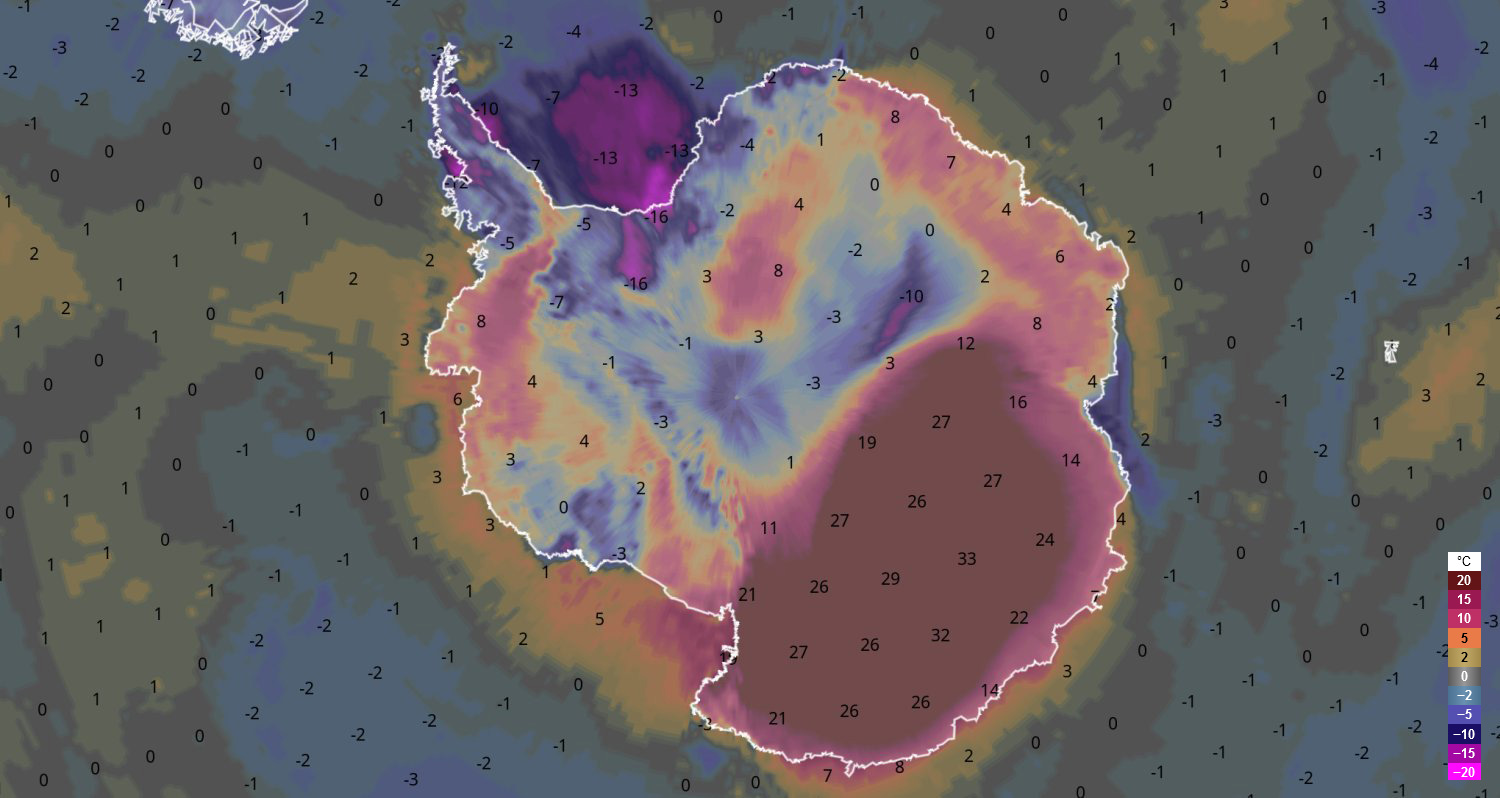
Temperatures running at least 50 degrees (32 Celsius) above normal have expanded over vast portions of eastern Antarctica from the Adélie Coast through much of the eastern ice sheet’s interior.
Some computer model simulations and observations suggest temperatures may have even climbed up to 90 degrees (50 Celsius) above normal in a few areas.
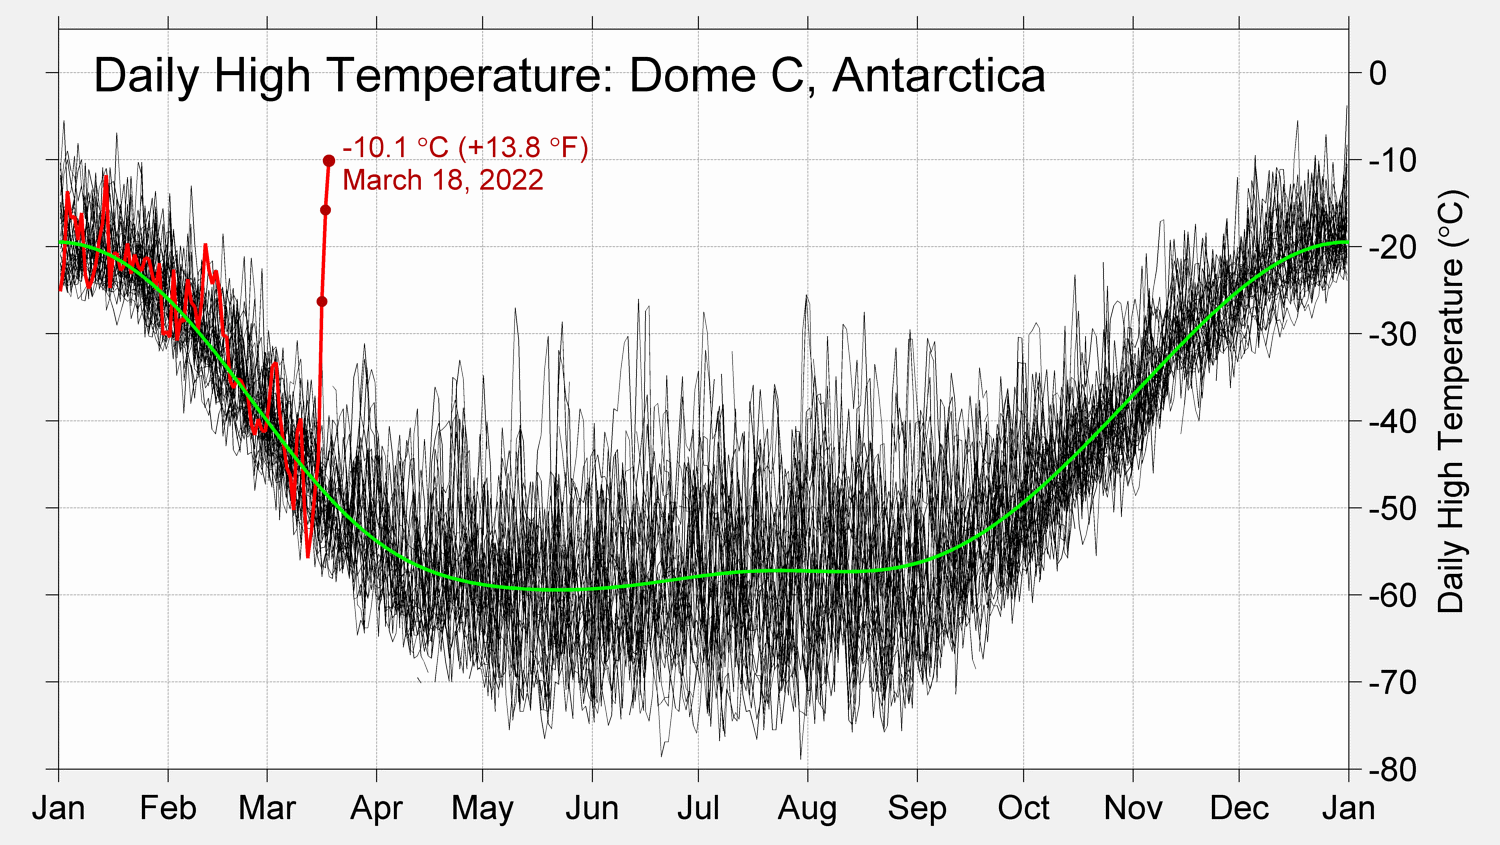
Extraordinary anomalies in #Antarctica lead to historic records today: -Vostok 3489m -17.7C,monthly record beaten by nearly 15C ! -Concordia 3234m -12.2C,highest Temp. on records and about 40C above average ! -Dome C II 3250m -10.1C -D-47 1560m -3.3C -Terra Nova Base 74S +7.0C pic.twitter.com/w6Ry4Dy4wz
— Extreme Temperatures Around The World (@extremetemps) March 18, 2022
Eastern Antarctica’s Concordia research station, operated by France and Italy and about 350 miles from Vostok, climbed to 10 degrees (minus-12.2 Celsius), its highest temperature on record for any month of the year. Average high temperatures in March are around minus-56 (minus-48.7 Celsius).
At a nearby weather station, the temperature reached 13.6 degrees (minus-10.2 Celsius) about 67 degrees (37 Celsius) above average, according to University of Wisconsin Antarctic researchers Linda Keller and Matt Lazzara.
Keller and Lazzara said in an email that such a high temperature is particularly noteworthy since March marks the beginning of autumn in Antarctica, rather than January, when there is more sunlight. At this time of year, Antarctica is losing about 25 minutes of sunlight each day.
Wille said the warm conditions over Antarctica were spurred by an extreme atmospheric river, or a narrow corridor of water vapor in the sky, on its east coast. According to computer models, the atmospheric river made landfall on Tuesday between the Dumont d’Urville and Casey Stations and dropped an intense amount of rainfall, potentially causing a significant melt event in the area.
And just to leave this satellite image from today of the atmospheric river spreading clouds over East Antarctica pic.twitter.com/OdAy1Li6sS
The moisture from the storm diffused and spread over the interior of the continent.
However, a strong blocking high pressure system or “heat dome,” moved in over east Antarctica, preventing the moisture from escaping.
The heat dome was exceptionally intense, five standard deviations above normal.
The excessive moisture from the atmospheric river was able to retain large amounts of heat, while the liquid-rich clouds radiated the heat down to the surface — known as downward long-wave radiation.
Wille explained warm air is often transported over the Antarctic interior this way but not to this extent or intensity.
“[T]his is not something we’ve seen before,” he said.
“This moisture is the reason why the temperatures have gotten just so high.”
Models show the atmospheric river will exit the continent around Saturday, but the moisture will take longer to dissipate.
Abnormally high temperatures in the region could last through the weekend.
Heat wave in Antarctica, +38 °C (+68 °F) above normal.
That's not an error, or a typo.
The remote research station at Dome C recorded a temperature nearly 40 °C above normal for this time of year, beating the previous March record by a startling 20 °C.
The abnormally high temperatures have caused some melting in the region according to models, which is unusual as this part of Antarctica doesn’t experience much melt often.
This one melt event won’t affect the stability of the glaciers in that area though.
“This event happened in a location that doesn’t often have melt. Obviously, this doesn’t mean that from now on we’re worried that melting will happen,” Wille said.
“It’s more of like, ‘Oh, that is weird, that could happen more in the future and then this could be bad.’”
Wille said it’s difficult to attribute this one event to climate change at the moment, but he does think rising temperatures helped prime conditions for such an event.
Climate change is “loading the dice” for more situations like this, he said.
Wille and his colleagues are studying how climate change will affect the circulation patterns around Antarctica and whether atmospheric rivers will become more common or more intense.
“We do believe they will become more intense because it just simple physics … but the details, we’re still trying to figure that out. It would be very difficult to say that there’s not a climate change fingerprint on an event like this,” he said.
Keller and Lazzara suggested more study is needed on the climate change connection. “[W]e can’t tell whether this is going to be a new trend or is just an oddity that occurs occasionally on a most fascinating continent,” they wrote.
Temperatures are known to vary wildly over Antarctica, and massive swings are common.
Contrasting with this warm spell over eastern Antarctica, the South Pole observed just observed its coldest April to September period on record last year, with an average temperature of minus-78 degrees (minus-61 Celsius).
Amid all of the variability in Antarctica, fingerprints of human-caused climate change are still evident. Its western ice sheet is losing mass while western parts of the continent and the peninsula are among the fastest-warming regions on Earth.
Warm ocean temperatures threaten to destabilize Antarctica’s Thwaites Glacier, a slab the size of Florida that contributes about 4 percent of annual global sea level rise.
Temperature differences from normal over the Arctic and Antarctic in recent days. (ClimateReanalyzer.org)
The historically high temperatures in Antarctica follow a pulse of exceptional warmth on the planet’s opposite end.
On Wednesday, temperatures near the North Pole catapulted 50 degrees above normal, close to the melting point.


