Singlehanded sailing along the coast of Norway, from the Lysefjord to the Lofoten,
Saturday, January 18, 2020
Friday, January 17, 2020

Google AI model outperforms traditional methods of weather prediction

Weather patterns
Top: Image showing the location of clouds as measured by geosynchronous satellites.
Bottom: Radar image showing the location of rain as measured by Doppler radar stations.
From NeoWin by Ather Fawaz
A couple of weeks back, Google AI used a machine learning model to improve the screening of breast cancer.
Now, the firm has used a convolutional neural network (CNN) in nowcasting precipitation.
In the paper titled "Machine Learning for Precipitation Nowcasting from Radar Images", researchers at Google AI have employed a CNN to give a short-term prediction for precipitation.
And the results seem promising, and according to Google, outperform traditional methods:
This precipitation nowcasting, which focuses on 0-6 hour forecasts, can generate forecasts that have a 1km resolution with a total latency of just 5-10 minutes, including data collection delays, outperforming traditional models, even at these early stages of development.
Unlike traditional methods, which incorporate a priori knowledge of how the atmosphere works, the researchers used what they are calling a 'physics-free' approach that interprets the problem of weather prediction as solely an image-to-image translation problem.
As such, the trained CNN by the team—a U-Net—only approximates atmospheric physics from the training examples provided to it.
For training the U-Net, multispectral satellite images were used.
Data collected over the continental US from the year 2017 to 2019 was used for the initial training.
Specifically, the data was split into chunks of four weeks where the last week was used as the evaluation dataset while the rest of the weeks were used for the training dataset.
In comparison to traditional, venerable nowcasting methods, which include High Resolution Rapid Refresh (HRRR) numerical forecast, an optical flow (OF) algorithm, and the persistence model, Google AI's model outperformed all three.

A visualization of predictions made over the course of roughly one day.
Left: The 1-hour HRRR prediction made at the top of each hour, the limit to how often HRRR provides predictions.
Center: The ground truth, i.e., what we are trying to predict.
Right: The predictions made by our model. Our predictions are every 2 minutes (displayed here every 15 minutes) at roughly 10 times the spatial resolution made by HRRR. Notice that we capture the general motion and general shape of the storm
As can be seen, the quality of our neural network forecast outperforms all three of these models (since the blue line is above all of the other model’s results).
It is important to note, however, that the HRRR model begins to outperform our current results when the prediction horizon reaches roughly 5 to 6 hours.

Precision and recall (PR) curves comparing our results (solid blue line) with: optical flow (OF), the persistence model, and the HRRR 1-hour prediction.
As we do not have direct access to their classifiers, we cannot provide a full PR curve for their results.
Left: Predictions for light rain.
Right: Predictions for moderate rain.
Moreover, the model provides instantaneous predictions.
This is an added advantage because the traditional methods like HRRR harbor a computational latency of 1-3 hours.
This allows the machine learning model to work on fresh data.
Having said that, the numerical model used in HRRR has not entirely been superseded by it.
In contrast, the numerical model used in HRRR can make better long term predictions, in part because it uses a full 3D physical model — cloud formation is harder to observe from 2D images, and so it is harder for ML methods to learn convective processes.
Google envisions that it might be fruitful to combine the two methods, HRRR and the machine learning model for having accurate and quick short-term as well as long-term forecasts.
According to the firm, they are also looking at applying ML directly to 3D observations in the future.
Links :
- Techxplore : Google claims its 'nowcast' short-term weather predictions are more accurate than advanced models
- ClimateChange : Machine Learning for Precipitation Nowcasting from Radar Images
- Phys : Deep learning application able to predict El Niño events up to 18 months in advance
- IBM : New IBM Weather System to Provide Vastly Improved Forecasting Around the World
- GeoGarage blog : Better weather forecasts coming to the ... / Can Artificial Intelligence help build better ... / Using deep learning to forecast ocean waves
Thursday, January 16, 2020
Ocean temperatures hit record high as rate of heating accelerates
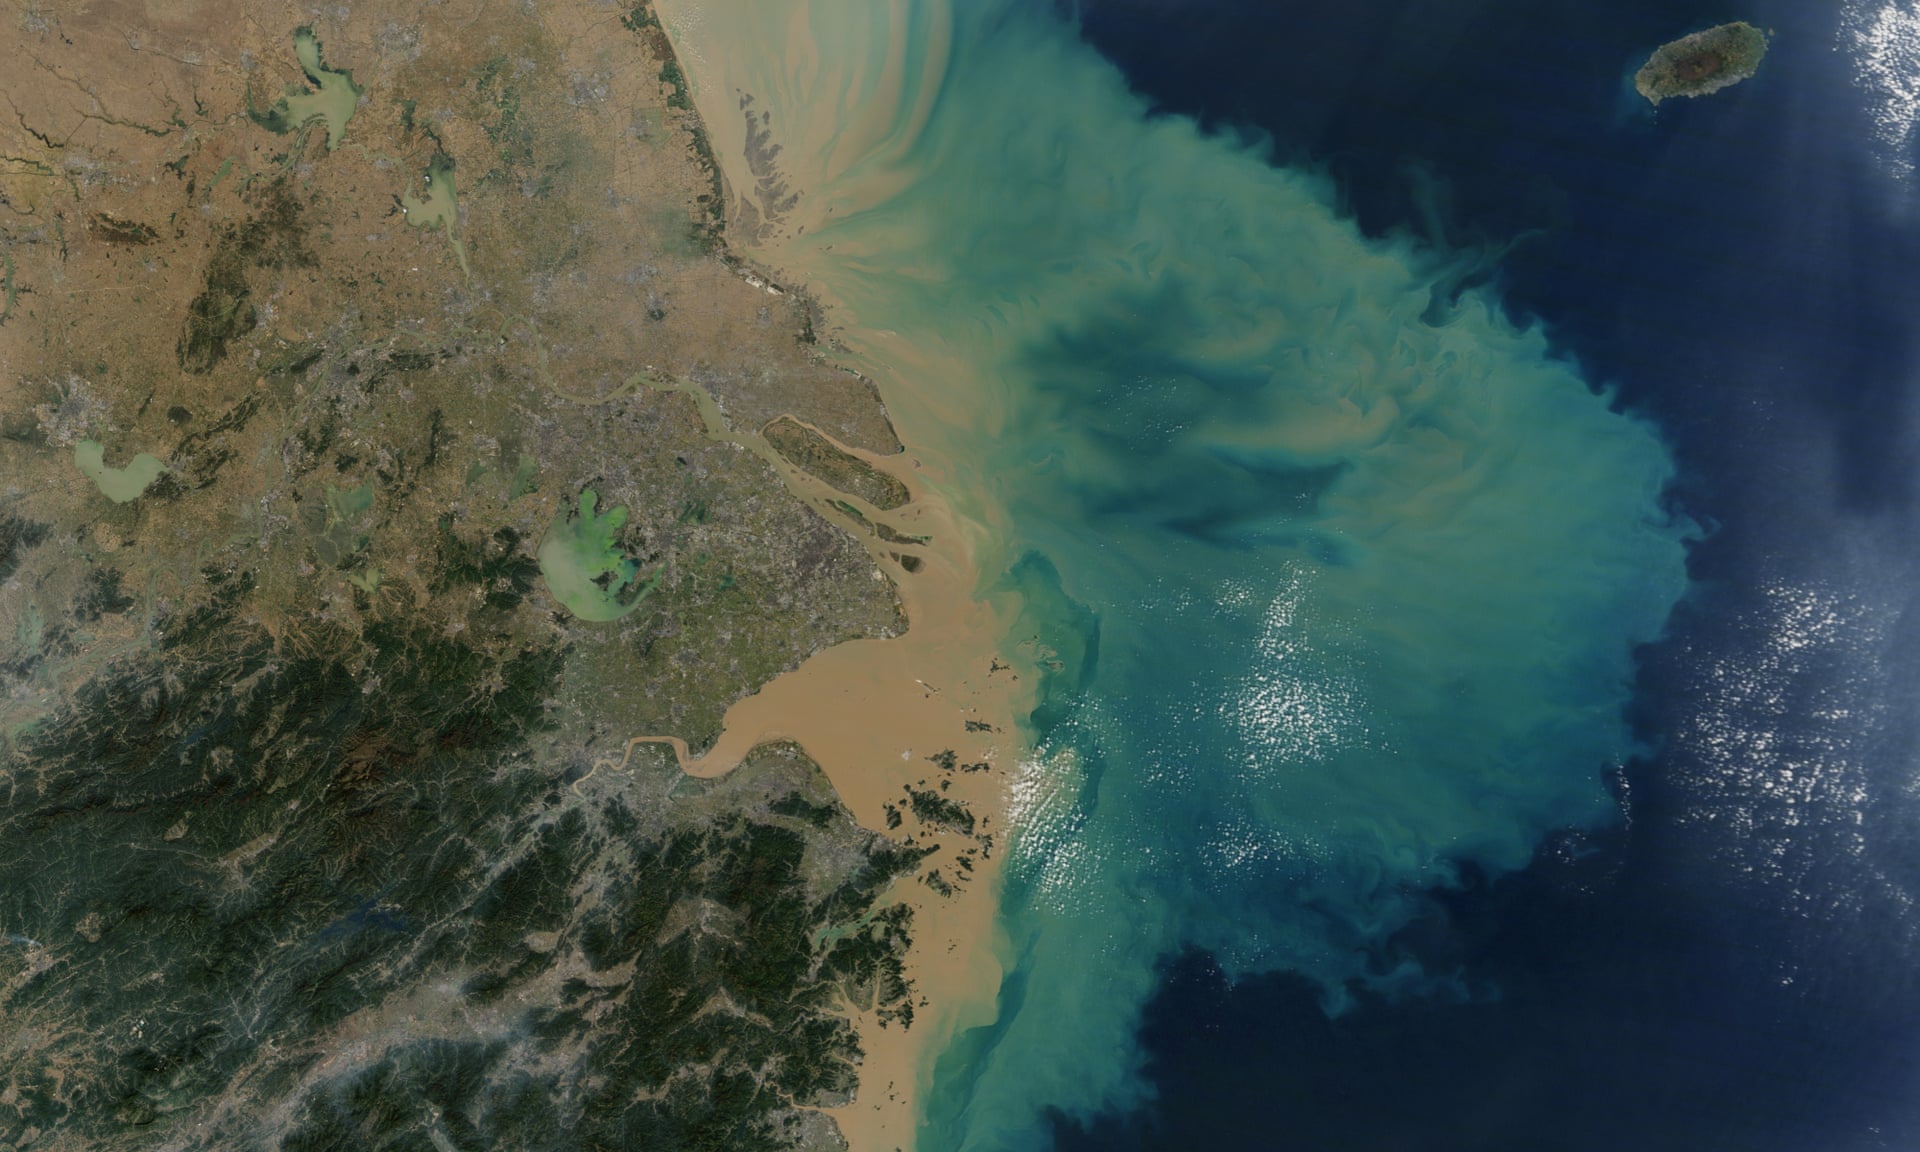
The heat in the world’s oceans reached a new record level in 2019,
showing “irrefutable and accelerating” heating of the planet.
Photograph: Modis/Terra/Nasa
From The Guardian by Damian Carrington
Oceans are clearest measure of climate crisis as they absorb 90% of heat trapped by greenhouse gases
The heat in the world’s oceans reached a new record level in 2019, showing “irrefutable and accelerating” heating of the planet.
Earth's global surface temperatures in 2019 ranked second-warmest since 1880, according to independent analyses by NASA and the National Oceanic and Atmospheric Administration (NOAA).
Global temperatures in 2019 were 2 degrees Fahrenheit (1.1 degrees Celsius) warmer than the late 19th century, according to scientists at NASA’s Goddard Institute for Space Studies (GISS) in New York.
2019's temperatures were second only to those of 2016 and continued the planet's long-term warming trend: the five warmest years on the instrumental record have been the five last years.
see NASA
The world’s oceans are the clearest measure of the climate emergency because they absorb more than 90% of the heat trapped by the greenhouse gases emitted by fossil fuel burning, forest destruction and other human activities.
The new analysis shows the past five years are the top five warmest years recorded in the ocean and the past 10 years are also the top 10 years on record.
The amount of heat being added to the oceans is equivalent to every person on the planet running 100 microwave ovens all day and all night.
Hotter oceans lead to more severe storms and disrupt the water cycle, meaning more floods, droughts and wildfires, as well as an inexorable rise in sea level.
Higher temperatures are also harming life in the seas, with the number of marine heatwaves increasing sharply.
The most common measure of global heating is the average surface air temperature, as this is where people live.
But natural climate phenomena such as El Niño events mean this can be quite variable from year to year.
“The oceans are really what tells you how fast the Earth is warming,” said Prof John Abraham at the University of St Thomas, in Minnesota, US, and one of the team behind the new analysis.
“Using the oceans, we see a continued, uninterrupted and accelerating warming rate of planet Earth.
This is dire news.”
“We found that 2019 was not only the warmest year on record, it displayed the largest single-year increase of the entire decade, a sobering reminder that human-caused heating of our planet continues unabated,” said Prof Michael Mann, at Penn State University, US, and another team member.
Oceans are getting hotter due to global heating

The analysis, published in the journal Advances In Atmospheric Sciences, uses ocean data from every available source.
Most data is from the 3,800 free-drifting Argo floats dispersed across the oceans, but also from torpedo-like bathythermographs dropped from ships in the past.
The results show heat increasing at an accelerating rate as greenhouse gases accumulate in the atmosphere.
The rate from 1987 to 2019 is four and a half times faster than that from 1955 to 1986.
The vast majority of oceans regions are showing an increase in thermal energy.
This energy drives bigger storms and more extreme weather, said Abraham: “When the world and the oceans heat up, it changes the way rain falls and evaporates.
There’s a general rule of thumb that drier areas are going to become drier and wetter areas are going to become wetter, and rainfall will happen in bigger downbursts.”
Hotter oceans also expand and melt ice, causing sea levels to rise.
The past 10 years also show the highest sea level measured in records dating back to 1900.
Scientists expect about one metre of sea level rise by the end of the century, enough to displace 150 million people worldwide.
Dan Smale, at the Marine Biological Association in the UK, and not part of the analysis team, said the methods used are state of the art and the data is the best available.
“For me, the take-home message is that the heat content of the upper layers of the global ocean, particularly to 300 metre depth, is rapidly increasing, and will continue to increase as the oceans suck up more heat from the atmosphere,” he said.
“The upper layers of the ocean are vital for marine biodiversity, as they support some of the most productive and rich ecosystems on Earth, and warming of this magnitude will dramatically impact on marine life,” Smale said.
The new analysis assesses the heat in the top 2,000m of the ocean, as that is where most of the data is collected.
It is also where the vast majority of the heat accumulates and where most marine life lives.
The analysis method was developed by researchers at the Chinese Academy of Sciences in Beijing and uses statistical methods to interpolate heat levels in the few places where there was no data, such as under the Arctic ice cap.
An independent analysis of the same data by the US National Oceanographic and Atmospheric Administration shows that same increasing heat trend.
Reliable ocean heat measurements stretch back to the middle of the 20th century.
But Abraham said: “Even before that, we know the oceans were not hotter.”
“The data we have is irrefutable, but we still have hope because humans can still take action,” he said.
“We just haven’t taken meaningful action yet.”
Links :
- The Guardian : Why do record ocean temperatures matter? / Heatwaves sweeping oceans ‘like wildfires’, scientists reveal / UN draft plan sets 2030 target to avert Earth's sixth mass extinction
- CNN : Oceans are warming at the same rate as if five Hiroshima bombs were dropped in every second
- NYTimes : 2019 Was a Record Year for Ocean Temperatures, Data Show
- Time : 2019 Was the Second-Hottest Year Globally on Record, and Ocean Temperatures Are Hotter Than Ever
- BBC : Climate change: Last decade confirmed as warmest on record
- Wired : Our Planet May Be Barreling Toward a Tipping Point
Wednesday, January 15, 2020

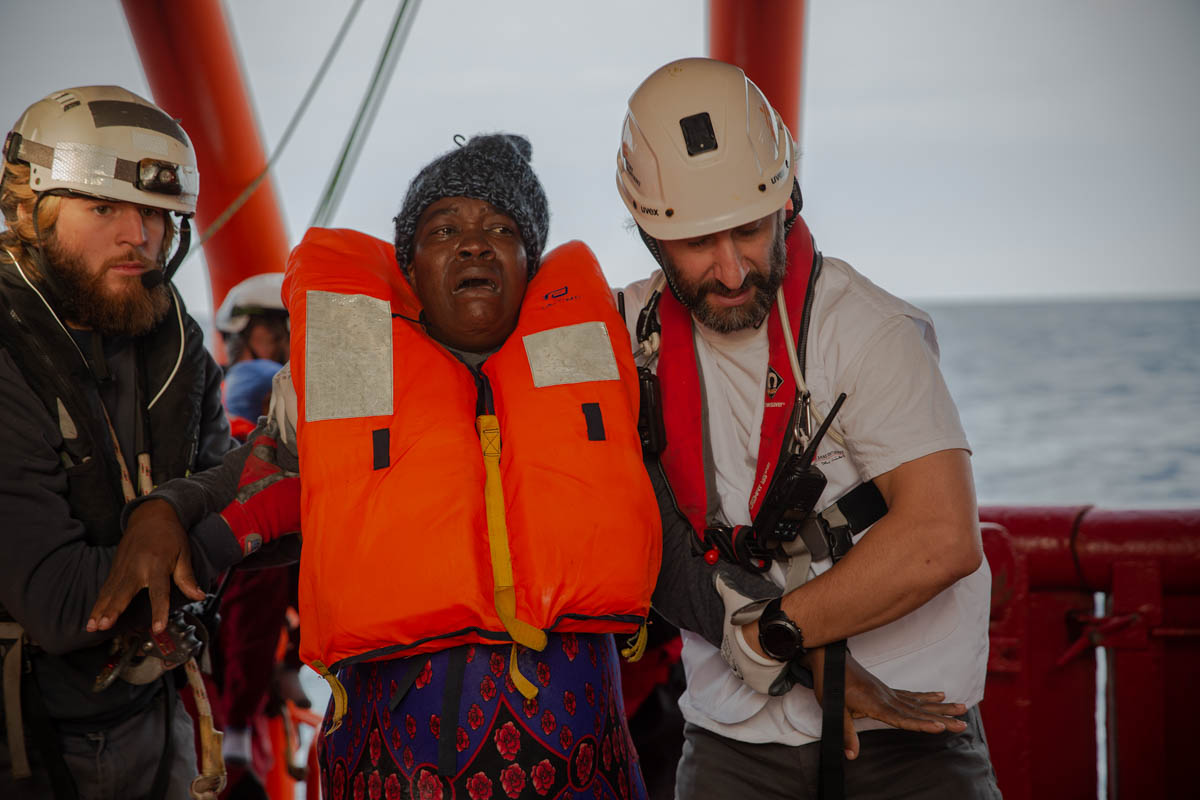
'I'll die with no regrets': risking their lives in Mediterranean
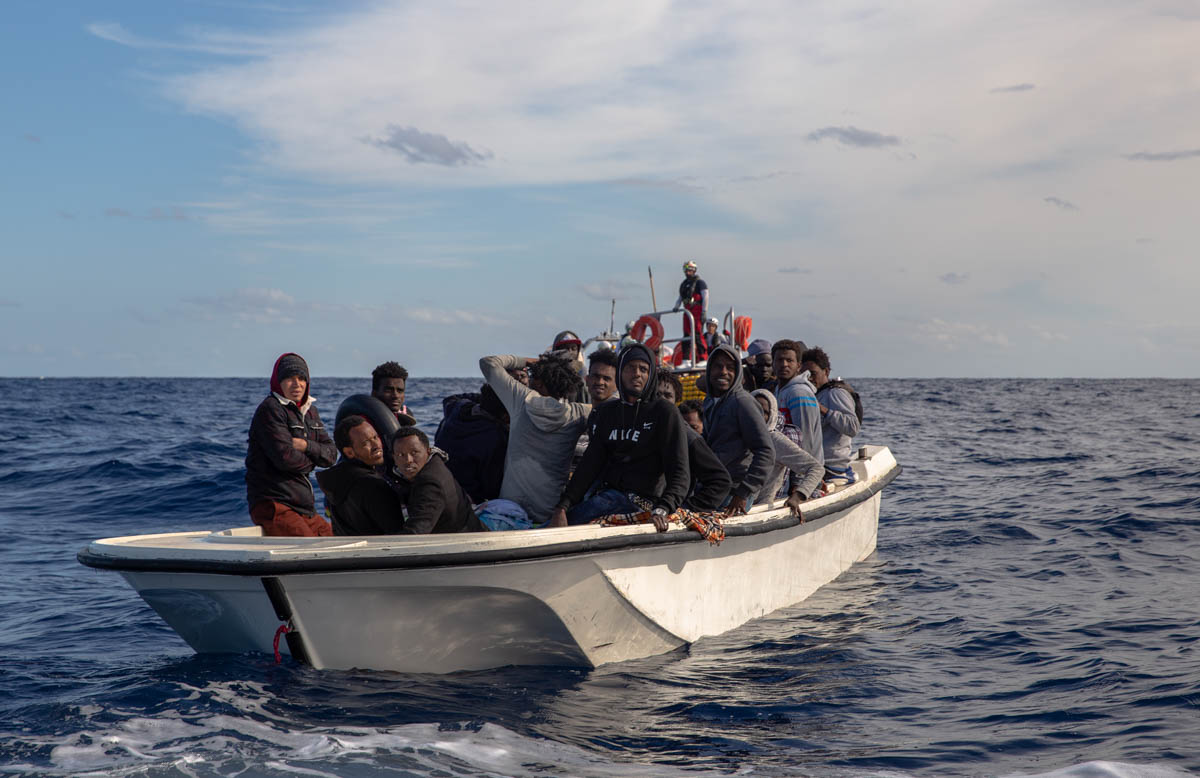
People are told to board the boats in the middle of the night. "You can't see anything. It's dark and scary. But you know you'll die in Libya if you don’t leave," Saruna, 17, said.
"You call home before you leave. You don't know if you'll survive at sea. You just pray to God and go."
From AlJazeera by Faras Ghani
Aboard the Ocean Viking in the Mediterranean Sea - Since 2016, almost 12,000 refugees and migrants have drowned in the Mediterranean while trying to reach Europe.
Libya acts as a major gateway for African refugees and migrants.
There are currently more than 636,000 refugees and migrants in Libya, mostly from neighbouring countries and sub-Saharan Africa, according to the International Organization for Migration (IOM).
These people are often fleeing poverty, conflict, forced labour and other threats to their lives and wellbeing.
Many suffer abuse and extortion en route and their arrival in Libya rarely marks the end of the dangers they face.
"You see this," Karim, a rescued migrant, told Al Jazeera while pointing to his shoulder.
He then pointed to his right leg.
"This is where I was shot while waiting for work in Tripoli. There is complete lawlessness there. Everyone has guns and knives. There are no rights for black people, even someone who has been stabbed or shot."
Florent, from Cameroon, was another migrant rescued from an overcrowded rubber boat in distress in the Mediterranean after he managed to escape Libya.
"If I die right now, I'll die with no regrets. I've managed to escape Libya. It was hell. Nothing less than hell," he said.
Names have been changed to protect identity*
"In life when you've lost everything, you're not scared of anything any
more," said Saou, sharing his reasons for getting on a boat for a
journey that could have well been his last.
In addition to the deaths,
almost 9,000 people were intercepted by the Libyan coastguard and
returned to detention centres last year.

More than 110,000 migrants and refugees arrived in Europe by sea last
year but 1,283 of those who left North Africa died in the Mediterranean
after managing to flee Libya.
"It seems there's complete disregard for
human life and people dying on the Mediterranean," said Nicholas
Romaniuk, a search and rescue coordinator on board the rescue vessel
Ocean Viking.

The UN has warned "there will be a sea of blood" without the
intervention of rescue NGOs in the Mediterranean.
Since it began its
operations in August 2019, the Ocean Viking has managed to rescue more
than 1,100 people.
But in the past, ships have been accused of
trafficking people into Europe and some rescuers faced up to 20 years'
imprisonment in Italy after they were accused by officials of assisting
traffickers and aiding illegal immigration.
Relieved migrants and refugees shared stories of abuse and extortion
in Libya, where some people Al Jazeera spoke to spent almost five
years.
Medics reported seeing cases of electrocution, wounds by knives
and machetes, gunshot wounds and people beaten with rubber and metal
pipes.
"You don't see the waves. You just see a boat. And that's your
chance to get your freedom again, far away from Libya," said Saou, from
the Central African Republic.
The IOM estimates that 10 percent of the migrants present in
Libya are women.
"Migrants smuggled into Libya reported severe human
rights violations and risks that included rape and amounted to deaths
during these journeys," the organisation told Al Jazeera.
Kelly, 32,
boarded a flimsy rubber boat to flee Libya while she was eight months
pregnant with twins.
"I didn't want to get into the water. It was too
risky. I thought the journey wouldn't finish and I'd die," she said
after being rescued in November.

There are almost 45,000 child migrants currently in Libya, more
than a quarter of whom are unaccompanied.
Some adult migrants are forced
to leave their children behind when leaving their country of origin.
Some female migrants are raped during their journeys and give birth en
route to Libya or once they arrive there.

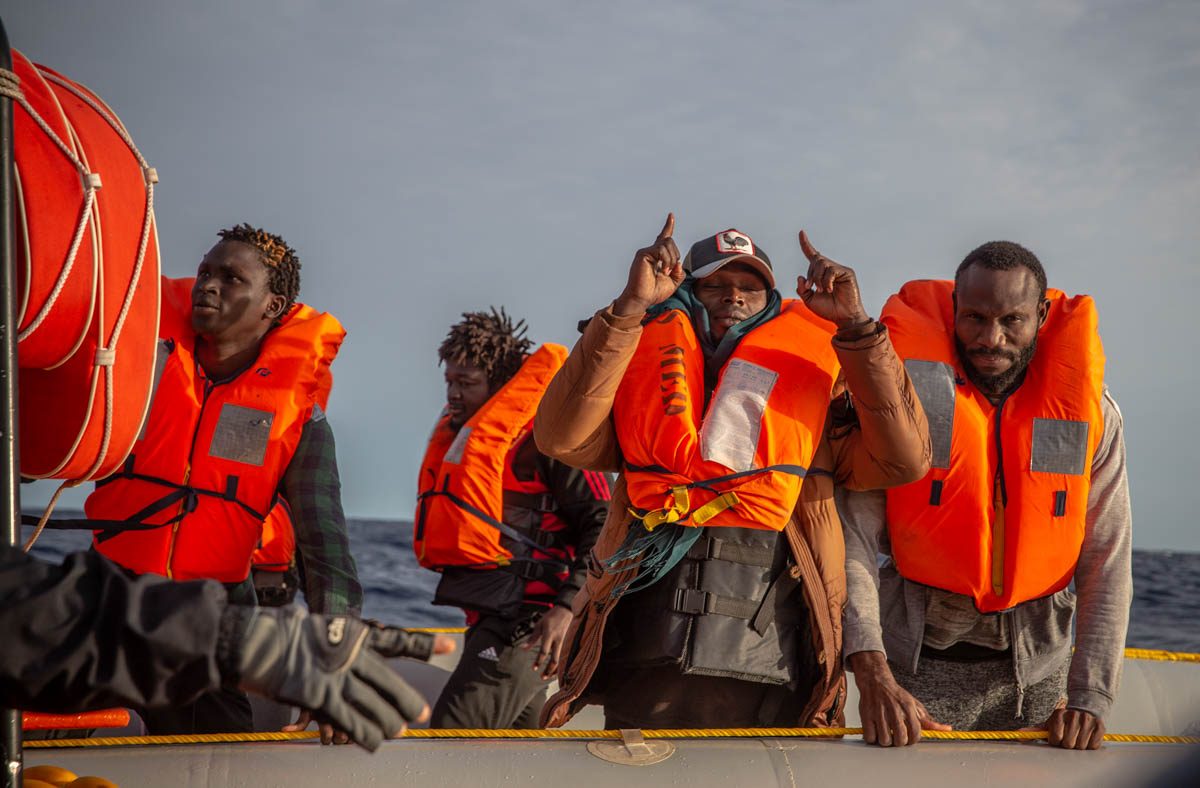
Being rescued by an NGO vessel takes these people closer to their
dream of reaching Europe.
While the journey is not complete and asylum
in Europe is not guaranteed, they say that after being rescued, they
feel the safest they have felt since leaving home.
"If the Libyans
[coastguards] come on board right now, I will smash my head into the
wall, slit my throat and jump into the water. That will be so much
better than going back to Libya," Florent, from Cameroon, said.

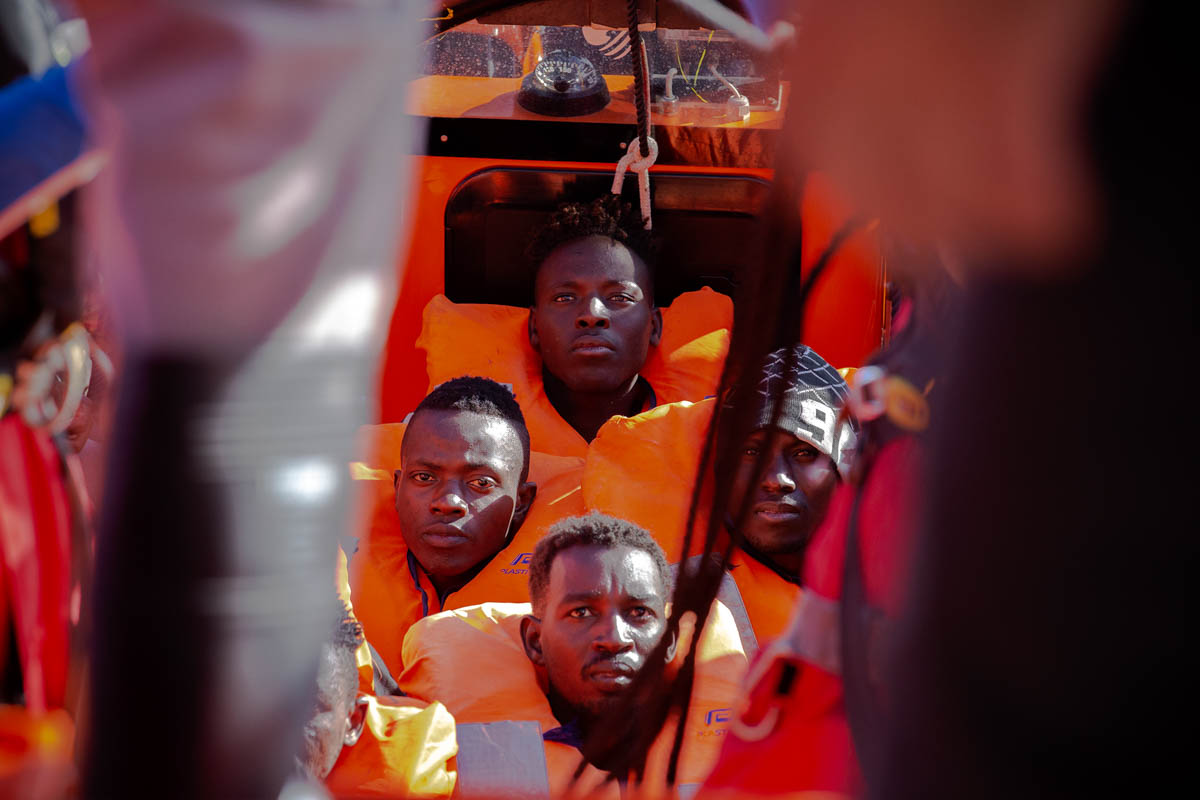
"Being able to sleep without fear of being woken up by gunshots or being
kidnapped for ransom time and again is a blessing," one of the rescued
migrants said.
Others said it was a huge relief to get warm meals, to be
able to clean themselves and have people to talk to.
"I started to cry
when the rescuers told us they weren't from Libya. I couldn't believe
that I was going to be rescued and not going to die in the sea."

Despite their traumatic experiences and arduous journeys on land and
sea, the refugees and migrants remained hopeful of their pain
transforming to joy once they reach the "safety of Europe" and are able
to provide for their families back home.
"My father is dead, my mother
is dead. It's just me and my wife and I left Nigeria because I didn't
have anyone or anything left anymore," said Sondy, 37.

For the rescuers, especially those who have seen a rescue situation
change from stable to deadly in a matter of seconds, the job is not
easy.
Rough seas, testing conditions, and the urgency and
unpredictability of the situation make it difficult.
"We are rescuing
people because they have a right to be rescued," said Dragos, a rescuer
from Romania.
"If you find a horse or a cow in the water, you will
rescue them because they are not supposed to be there."

Leaving on a boat, most of the refugees and migrants do not know
how far it is to Italy from Libya.
Some are told by the human smugglers
that it is only a small river they have to cross, the smugglers
pointing to lights on offshore oil rigs - just over 100km (62 miles)
away - and saying that is their destination.
Here, rescued people talk
about the countries in Europe they heard about and how the distance to
Europe seems very small but the journey very long.

"When I was a firefighter or rescue soldier, nobody
questioned my mandate. Now that I'm still saving lives, the work is
questioned and even criminalised. I'm just a f****** rescuer trying to
save lives," said Tanguy.
Rescuers talked about their constant high
levels of stress and their fear that a rubber boat may fall apart in
front of their eyes.
"We deal with some very traumatic experiences at
sea. And that leaves a mark," said Nicholas Romaniuk, a
search-and-rescue coordinator.

Rescued female migrants told tales of physical and sexual abuse that
began even as they were setting out from their home countries.
On their
way to Libya, many were tortured and raped.
After arriving in Libya,
they found physical and sexual violence everywhere: on the streets and
during their forced work as cleaners.
Some women said their genitals had
been burned.

As the rescued people prepare to disembark in Europe, they
realise stern tests await them in front of immigration officials and
that their journey is not over.
More than 5,000 migrants were forcibly
repatriated by Italy in 2019.
For those who are returned, the violence,
torture and extortion they endured on their journey was for nothing.
Links :
- AlJazeera : Nearly 1000 migrants 'returned to Libya' this year
- GeoGarage blog : Once migrants on Mediterranean were .../ The risks to migrants of crossing the English ... / A perilous journey: How many asylum ... / What rules apply to migrants rescued at sea? / Mediterranean Sea Rescue / Mediterranean migrant deaths reach record ... /
Migrants can't be left to die in the seas of ... / The millionaires who rescue people at sea / A wintry sea seems a safer bet than life at .../ Lampedusa, the Italian Island thousands are ... / Fuocoammare, par-delà Lampedusa / European Union authorizes military action ... / Greece's island of despair
Tuesday, January 14, 2020
Aeolus: Weather forecasts start using space laser data
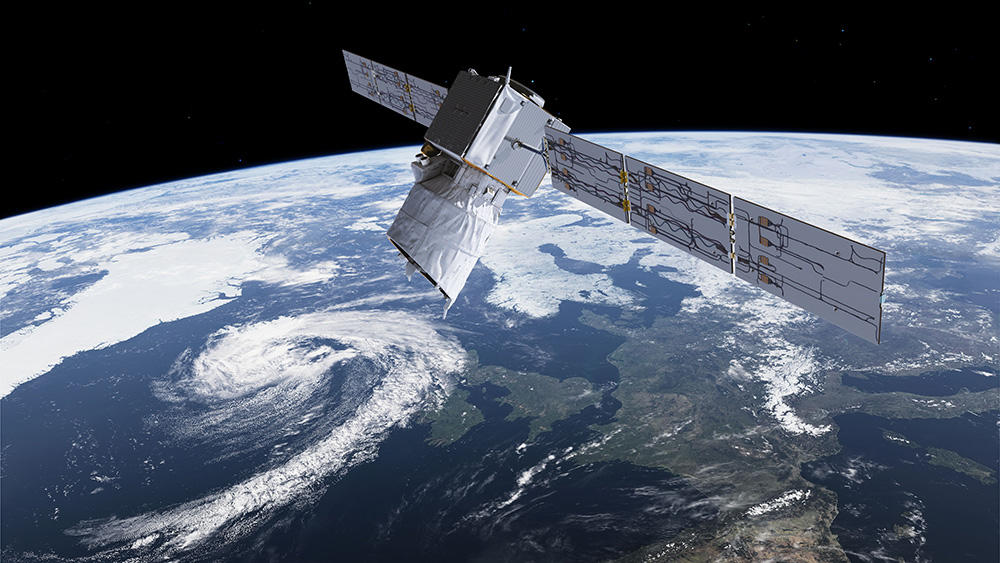
Profiling the world's winds
Aeolus winds now in daily weather forecasts
image : ESA/ATG medialab
From BBC by Jonathan Amos
Europe's novel wind-measuring satellite, Aeolus, has reached a key milestone in its mission.
The space laser's data is now being used in operational weather forecasts.
Aeolus monitors the wind by firing an ultraviolet beam down into the atmosphere and catching the light's reflection as it scatters off molecules and particles carried along in the air.
The European Centre for Medium-Range Weather Forecasts says the information is now robust enough for routine use.
The Reading, UK-based organisation is ingesting the data into its numerical models that look from one to several days ahead.
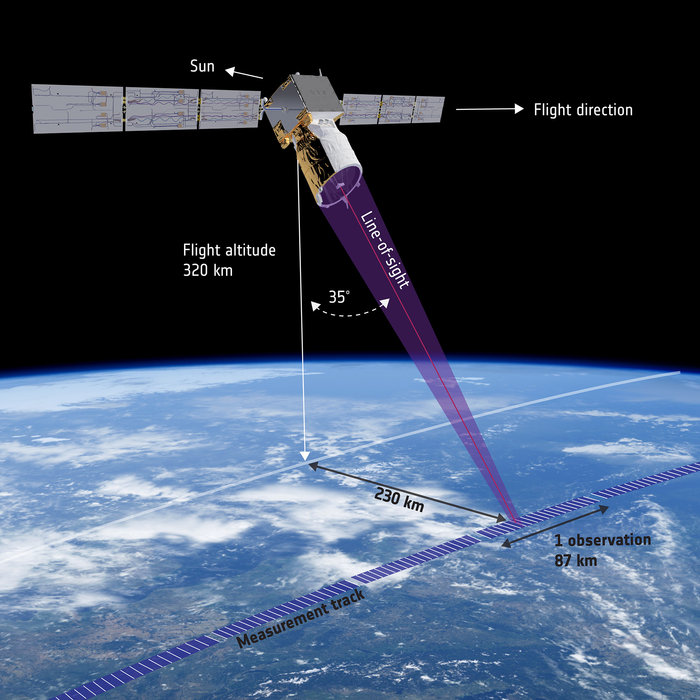
Principle of wind measurement by the Aeolus space mission.
ESA credit.
Forecast improvements are most apparent for the tropics and the Southern Hemisphere.
Meteorologists are constantly trying to increase their skill level; they want to see a certain performance being achieved further and further into the future.
And on one important measure - the eight-day look-ahead - the ECMWF says the Aeolus data enables conditions in the Southern Hemisphere to be forecast with the same level of accuracy an additional 3.7 hours into the future.
"This is just one experimental instrument but it suggests that if you had many more of them in space you would have an even greater impact," the centre's Dr Michael Rennie commented.
"Aeolus shows us there is a lot of promise from this type of direct wind measurement," he told BBC News.
Learn how Earth’s wind is generated and why we need to measure it.
Discover how ESA’s Aeolus satellite will use laser technology to measure these invisible streams of air to help understand our climate and to improve our weather forecasts.
credit ESA
The UK Met Office is likely to start ingesting Aeolus data routinely into its forecast models from the Summer. Meteo France and DWD (Germany) are expected to follow too.
The Americans have also been running simulations to assess the benefits, and the Japanese are about to start.
The Chinese have investigated the quality of the data through comparison with other satellite wind observations.
The European Space Agency's Aeolus satellite is regarded as a breakthrough concept.
Wind measurements have traditionally been very patchy.
You can get data from anemometers, weather balloons and aeroplanes - and even from satellites that infer air movements from the way clouds track across the sky or from how rough the sea surface appears at different locations.
But these are all limited indications that tell us what is happening in particular places or at particular heights.
Aeolus on the other hand gathers its wind data across the entire Earth, from the ground to the stratosphere (30km) above thick clouds.
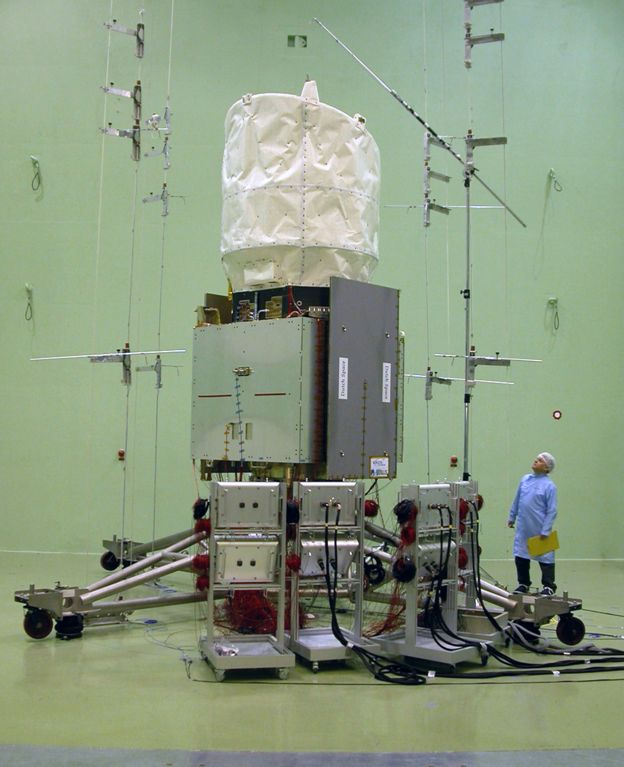
The Aeolus satellite was assembled from European components in the UK factory of Airbus
How to measure the wind from space
- Aeolus fires an ultraviolet laser through the atmosphere and measures the return signal using a large telescope
- The light beam gets scattered back off air molecules and small particles moving in the wind at different altitudes
- Meteorologists will adjust their numerical models to match the information gathered by the satellite, improving accuracy
- The biggest impacts are expected in medium-range forecasts - those that look at weather conditions a few days hence
- Aeolus is only a demonstration mission but it should blaze the trail for future operational weather satellites that use lasers
For a long time, Europe's engineers struggled to find a design for the UV laser instrument that would work in space.
And when the satellite finally launched to orbit in 2018, it did so 19 years after first approval.
So to see Aeolus working - and working well - is an enormous fillip to all the teams involved in the project's development.
It was, however, built as a one-off research mission and if the forecast benefits are to be maintained, Europe will have to consider a follow-on.
Those discussions have already started.
At a meeting in Seville, Spain, in November, research ministers from the nations that make up the European Space Agency agreed to fund feasibility studies.
It's been suggested that two or three lasers might be flown in a constellation.
"Some of Esa's member states support starting preparatory activities for a potential follow-on mission," said Aeolus mission scientist, Dr Anne Grete Straume.
"Of course, we'd need to improve it and for the next generation there are a number of things we could make even better, such as the stability of the laser instrument. At the moment it looks good but for the future it would have to be absolutely solid," she told BBC News.
Links :
- SpaceDaily : Aeolus winds now in daily weather forecasts
- Windy : Positive impact of new stallite data on ECMWF forecasts
- ESA : Aeolus
- ECMFW : Introductory presentation about Aeolus L2B winds / ECMWF starts assimilating Aeolus wind data
- GeoGarage blog : Aeolus: wind satellite weathers technical storm
Monday, January 13, 2020
West Mexico (BLP), a new layer in the GeoGarage platform

135 nautical raster charts added for the Sea of Cortez and Baja California
in the GeoGagage platform
see GeoGarage news
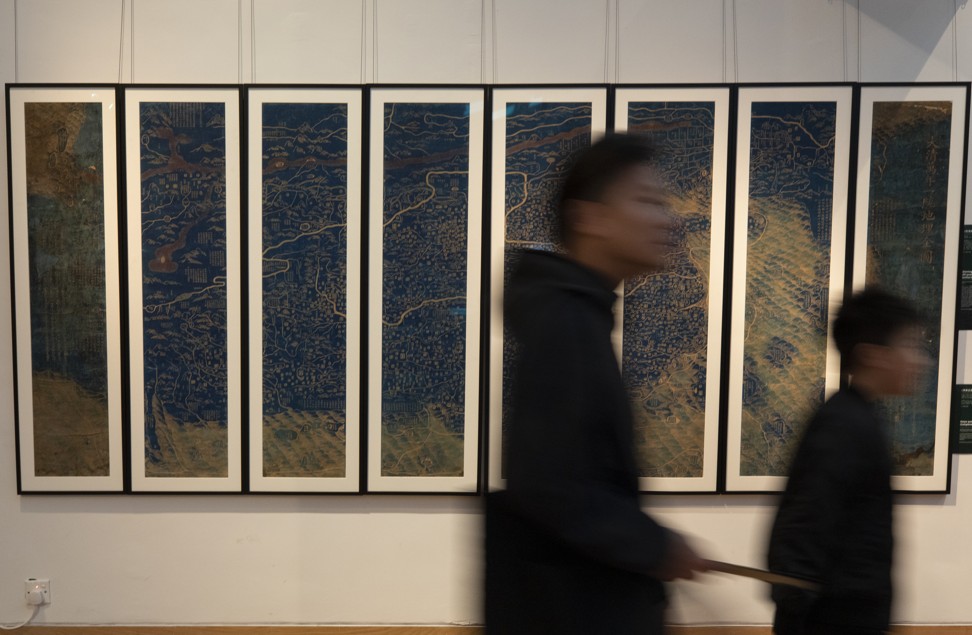
Old maps of China shed light on modern border disputes and how it sees the world today at Hong Kong exhibition
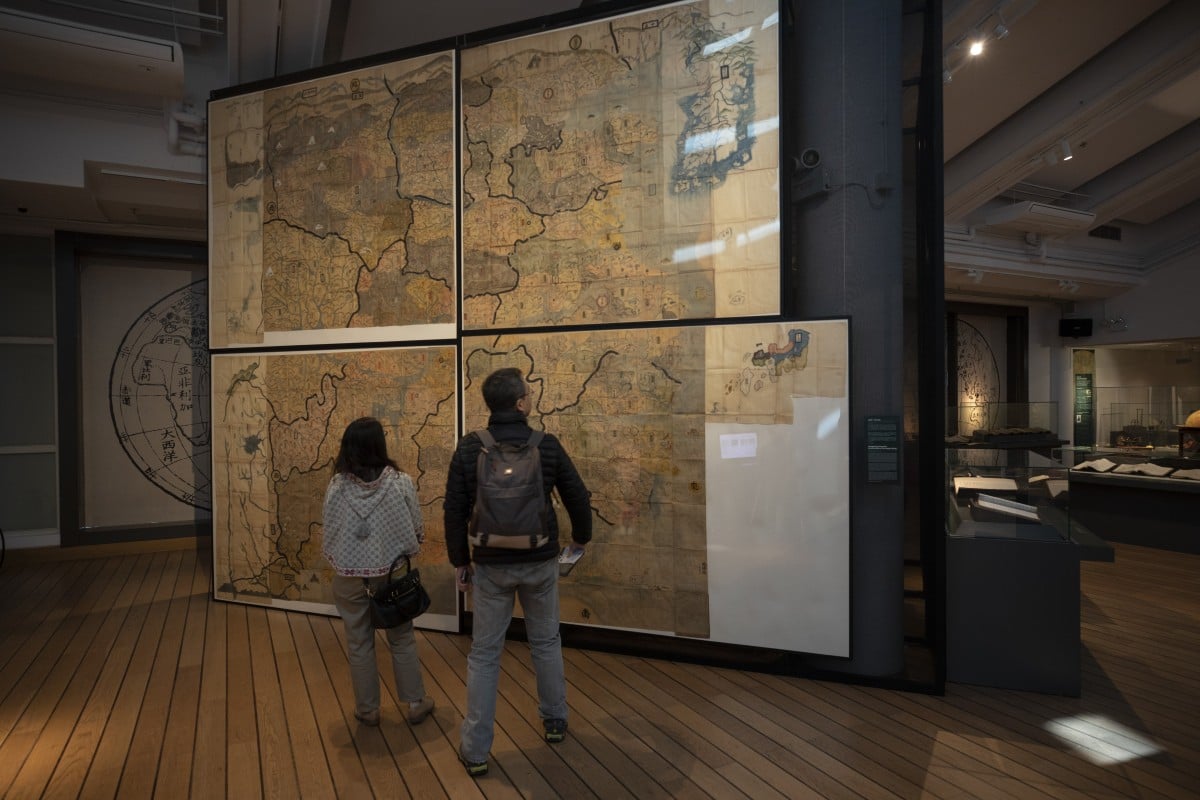
People looking at the Huang-Ming Yitong Da Tu (Unified Atlas of the August Ming) at the Hong Kong Maritime Museum, part of an exhibition called “The World on Paper: From Square to Sphericity”. Photo: Antony Dickson
From South China Morning Post by Stuart Heaver- A show of 80 historic maps and charts reveal China’s view of itself over the centuries and give clues on why the country now conducts business as it does
- The exhibition at the Hong Kong Maritime Museum also shows that the West’s view of China was long distorted
The map, whose title translates as the Unified Atlas of the August Ming, is one of 80 historic maps and nautical charts on display at the Hong Kong Maritime Museum as part of an exhibition called “The World on Paper: From Square to Sphericity”.
“Maps both reflect history and are a record of history,” says collector Tam Kwong-lim, who helped curate the exhibition.
Running until February 24, the exhibition not only follows the evolution of Chinese navigation and cartography, but reveals how China saw itself in the world and how the rest of the world perceived China.

Tam Kwong-lim at the exhibition at the Hong Kong Maritime Museum.
Photo: James Wendlinger
Tam bought his first old map of China in a second-hand bookshop in Tokyo while working in the city as a shipping executive in the 1970s.
He has since been an avid collector and is now recognised as an authority on antique maps and charts, which, he points out, still influence modern geopolitical and territorial disputes.
He points to a 1951 Japanese chart showing the South China Sea that is clearly marked in red ink as “China”.
Another Japanese chart, produced in 1943 and including the Philippines, shows a thick boundary line drawn around the
hotly disputed Spratly Islands, excluding them from control of the Philippines, which was occupied by the Japanese at the time.
Museum director Richard Wesley says the old maps help shed light on how the modern Chinese state goes about its business.
“China is now recognised as a global economic superpower, but to better understand the Chinese approach to international trade and diplomacy, it can be helpful to examine how they saw the world and how they mapped it,” he says.
A Japanese map produced in 1951 at the exhibition which shows the South China Sea as clearly belonging to China.
Photo: Antony Dickson
Although China had been producing maps since the Han dynasty (206BC-AD220), there was no attempt to accurately chart its national boundaries or undertake scientific surveys of its territory, Tam says.
It didn’t need to.
Traditional Chinese thinking was greatly influenced by the concept of a “canopy heaven” represented by a spherical heaven and flat Earth.
Everything inside China was ruled over by the emperor.
Everything outside that empire was the world of barbarians and hardly worth bothering about.
Even as trade routes to the Arabian Peninsula developed in the Song dynasty (960-1279), this self-centric view of China at the centre of the heavenly universe remained firmly in place.
Early maps of China had more of a municipal function, showing settlements, roads and geographical features, often with great artistic flourish.
“The maps were drawn like Chinese paintings, depicting rivers and mountains – what was important was the distribution of cities and centres of population density, because they had more of an administrative purpose than a navigational purpose,” Tam says.
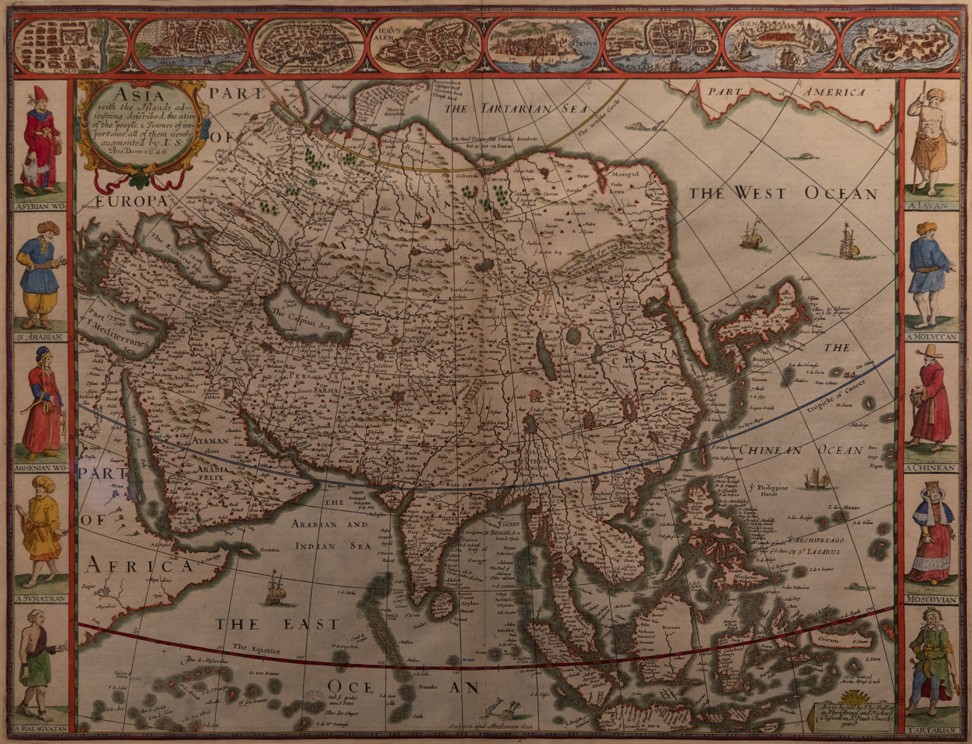
A map by Englishman historian and cartographer John Speed, published in 1676, at the exhibition, which includes depictions of indigenous people from major countries in the region.
Photo: Antony Dickson
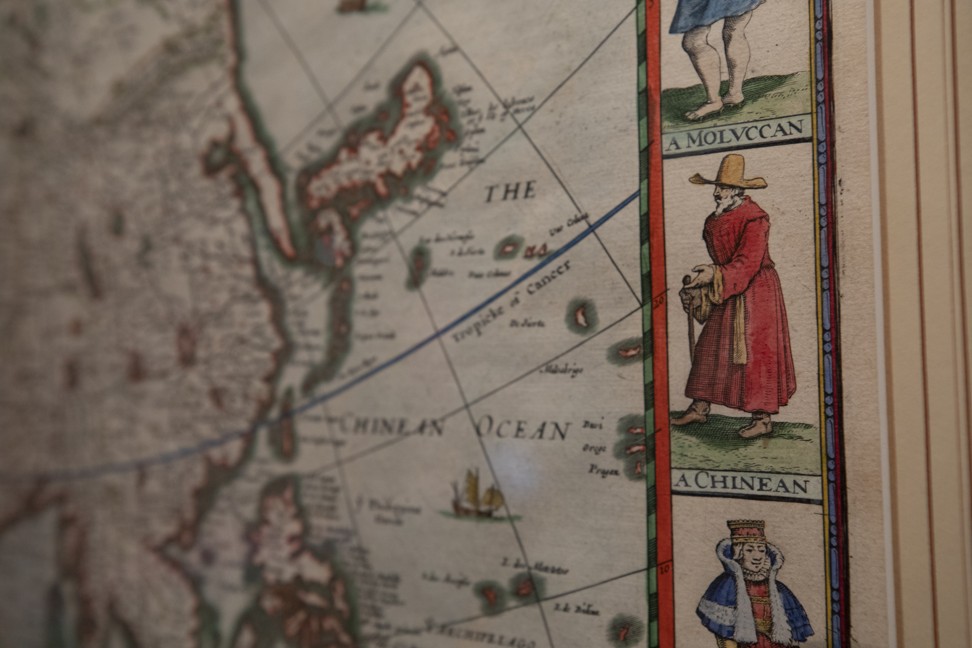
Close-up of John Speed’s map, which shows a tall, white-bearded gentleman wearing a red monk’s robe and a large brown wide-brimmed cowboy hat described as a “Chinean” – revealing the paucity of information about China in the late 17th century.
The exception was maritime charts, which were needed to guide Chinese junks safely between ports.
One exhibition highlight is a beautiful nautical chart thought to represent the sixth voyage of the Chinese fleet of imperial treasure junks, commanded by Zheng He.
The Muslim admiral led seven diplomatic expeditions from China’s eastern city of Nanjing to the coast of east Africa between 1405 and 1433.
Though the chart depicts islands, harbours, navigational hazards and sailing routes, it was actually compiled some 200 years after Zheng He’s famous voyages were completed.
The expeditions described in the chart represented a high point in terms of official Chinese engagement with the barbarian world, though Tam notes that Zheng was not the first to sail between China and the Persian Gulf and eastern Africa.
Numerous sailors and merchants had been doing this since the eighth century – possibly earlier.
While Chinese junk captains traditionally hugged the coast, it was their Arab counterparts who held the key to celestial navigation – using the stars and planets to determine position and heading.
It is likely that Zheng employed experienced Arab mariners as pilots and that much of the information on the chart was derived from Arab sources.
Zheng is often cited as the historical symbol of the Maritime Silk Road, which is the inspiration for Chinese President Xi Jinping’s “belt and road” trade and diplomatic initiative.
However, the ancient chart suggests that China could not have navigated very far along the Maritime Silk Road without Islamic knowledge and technology.
It was the arrival of Western technology and knowledge introduced by European missionaries that persuaded the Qing dynasty (1644-1912) to undertake large-scale, detailed surveys of its recently expanded Chinese territory.
In 1708, the 47th year of the Kangxi reign, a team of Jesuit missionaries and scholars were recruited to undertake a comprehensive and highly ambitious cartographic survey of China and the surrounding region.
The map, which is called Huang Yu Quan Lan Tu (Kangxi Imperial Atlas of China), took more than 10 years to complete and covered all Chinese territory plus Tibet and the Korean peninsula.
According to Professor Mario Cams at the University of Macau, at the time this map was produced the Qing empire was almost at the height of its territorial reach.
It had conquered much of the vast Mongolian steppes and parts of Taiwan.
Qing China was sending armies into Tibet and towards the deserts in the far west – today’s Xinjiang region – and laying the foundations for the territory of the modern People’s Republic of China.
People walking past the “Complete Map of the Unified Great Qing” at the Hong Kong Maritime Museum.
Photo: Antony Dickson
The 41 sheets of the copperplate atlas together constitute one large map of continental East Asia, from Lake Baikal (north) to Sakhalin (northeast) and Taiwan (east), and from Hainan Island (south) to Kashgar (west).
It has sometimes been called the “Jesuit map of China”, but Cams says that title underestimates the contribution of Chinese officials and scholars.
This enormous atlas of Qing China, printed in several versions, resulted in the largest mapping project of the early modern world and is unique in a number of ways, Cams says.
First, it was largely based on field surveys conducted by mixed teams of Qing officials and European missionaries.
Second, it is probably the most important example of early modern state-sponsored cartography.
Third, it is a product of the creative integration of two different cartographic practices, European and East Asian.
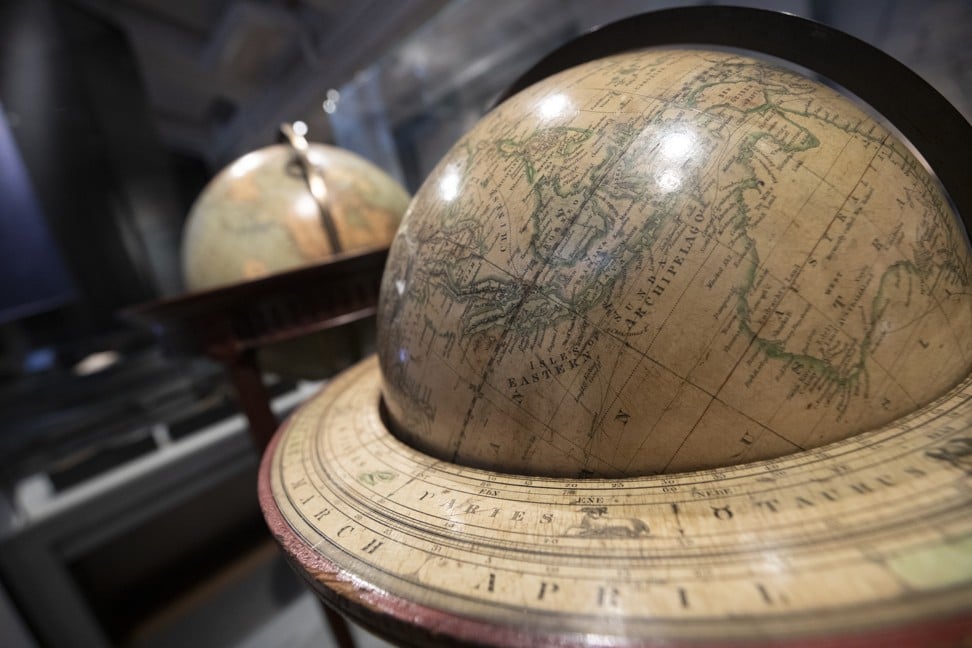
Globes on display at the exhibition.
Photo: James Wendlinger
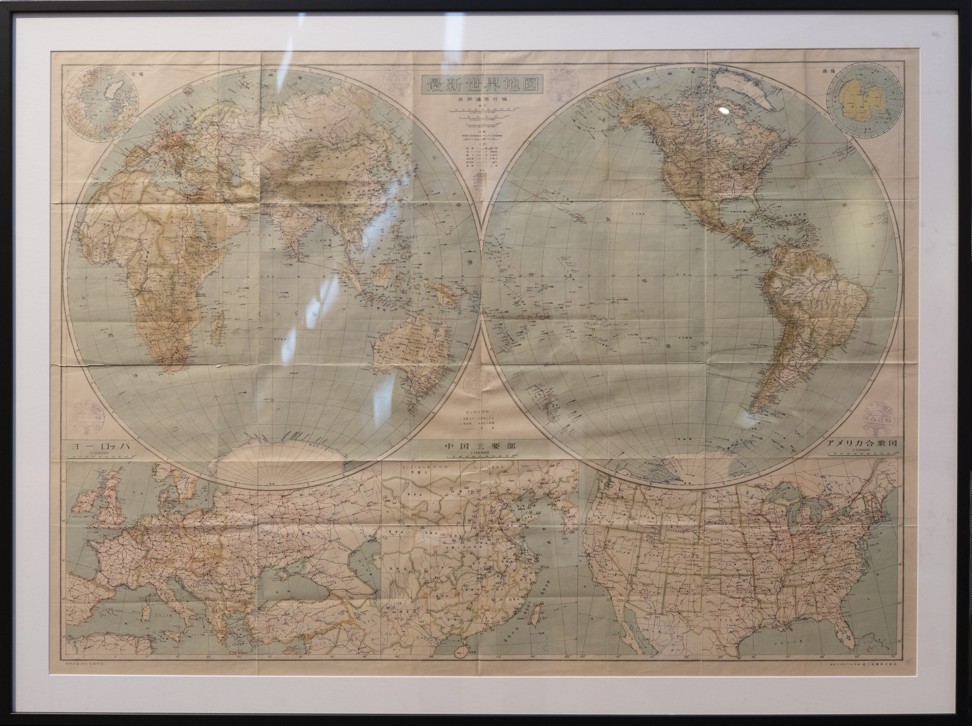
It was not until 1899 that China produced its first modern map without Western help and referenced to latitude and longitude with a conical projection, according to Tam, but the central meridian remained in Beijing.
Called the Daqing Huangyu Quan Tu (Imperial Atlas of China), the map is remarkable because the external land boundaries are deliberately left ambiguous, Tam says.
“So many Western powers wanted a slice of China [by this time] that they could not define their own boundaries because, diplomatically, China could not afford to upset any third-party power,” says Tam, standing by the 1909 edition of the map on display at the exhibition, which still has the purchase price of 1.20 Chinese dollars displayed in the bottom corner.
In less than a century, China had regressed from an empire under heaven, so self-confident that it did not feel the need to define its boundaries, to a nation that could not afford to define them for fear of upsetting aggressive foreign powers.
Tam says this was part of the process of the “100 years of humiliation” that still informs contemporary foreign policy in Beijing.
“I think it must influence modern Chinese diplomacy,” Tam says, adding that it may be one reason Beijing is still so sensitive about issues of sovereignty.
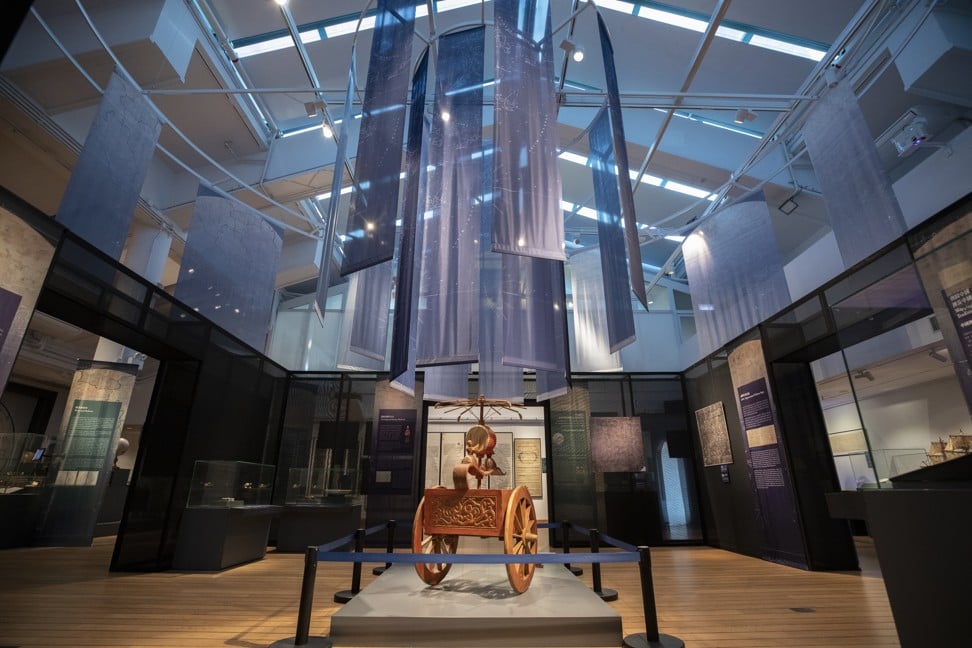
Maps, charts and globes on display at the Hong Kong Maritime Museum.
Photo: James Wendlinger
The first Chinese map with a complete border was not completed until 1905, as part of the self-strengthening movement to modernise and industrialise China to compete with Western hegemony.
Tam describes it as China’s “joining point with modernity”.
It is also apparent that while China needed Western and Islamic technology to inform its traditional view of the world, the Western view of China was distorted and inaccurate until relatively recently.
China is featured in Abraham Ortelius’ Theatrum Orbis Terrarum, published in 1570 and thought to be the first true modern atlas.
Many places in China are marked on this map, but the landscape is shown as a rectangle and some coastlines are wrongly drawn.
Meanwhile, a map of Asia by English historian and cartographer John Speed published in 1676 includes depictions of indigenous people from major countries in the region.
A tall, white-bearded gentleman wearing a red monk’s robe and a large brown wide-brimmed cowboy hat is described as a “Chinean” and reveals the paucity of information about China in the late 17th century.
“Maps and charts offer a new dimension and angle on Chinese history,” Tam says.
Links :
- SCMP : The South China Sea: Conflicting Claims
- GeoGarage blog : Collector's 400 years of China maps and nautical charts up for ... / New map boosts China's maritime claims / Ancient map irrefutable evidence that the ... / Battle of the South China Sea charts / China revises mapping law to bolster claims ...
Sunday, January 12, 2020
Flashback in maritime history – the Afrique passenger ship sinking with 575 fatalities, one century ago
The Afrique was a passenger ship of the French shipping company Compagnie des Chargeurs Réunis, which from 1908 to 1920, traded between French territories of French West Africa, French Equatorial Africa, and Post of Bordeaux in the French colonies.


On her way in heavy seas, the Afrique sprung a leak, presumably from hitting a submerged object.
On the 11th, while 65 miles west from Royan, her engine room got flooded and the boilers extinguished.
She asked for a tow, but not one vessel was able to reach her.
On January 12, 1920, the generators in engine room failed during a storm off the French coast.
The steamers, were then unable to maneuver and was thrown against a reef.
At 23h00, the Afrique hit the Rochebonne Lightvessel and subsequently sank at 3:00, May 12th, of the 609 passengers and crew of whom 15 missionaries and 190 senegalese gunners, only 34 survived.
The disaster is one of the largest disasters in French history, but would be consumed in the shadow of the First World War and presidential elections the same year.
Subscribe to:
Posts (Atom)