Visitors walk on the deck of the Soviet-era submarine Juliett 484 stand in Providence, R.I., on Aug. 28, 2002.
The old Soviet Union may have been just as familiar with Canada's Arctic waters as Canadians.
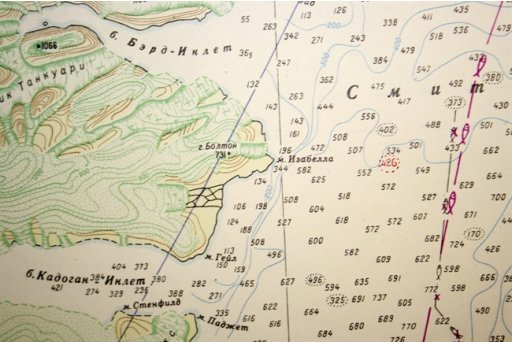
Sections of Cold-War-era nautical charts obtained by The Canadian Press suggest that Russian mariners have for decades possessed detailed and accurate knowledge of crucial internal waterways such as the Northwest Passage.
THE CANADIAN PRESS/AP, Steven Senne
The old Soviet Union may have been just as familiar with Canada's Arctic waters as Canadians.
Sections of Cold-War-era nautical charts obtained by The Canadian Press suggest that Russian mariners have for decades possessed detailed and accurate knowledge of crucial internal waterways such as the Northwest Passage.
Those charts, which may offer the first documentary proof of the widely held belief that Soviet nuclear submarines routinely patrolled the Canadian Arctic during the Cold War, are still in use by Russian vessels.
A Soviet era nautical map charts the Canadian coastline in Nares Straight, which separates Ellesmere Island with Greenland, in this photo by UBC international law professor Michael Byers from on the bridge of the Academik Ioffe in August 2011.
In some places, they are preferred to current Canadian charts.
"In some cases the Russian charts are more detailed than the Canadian ones and the navigators have them out on the chart table beside the Canadian ones in order to cross-reference any questionable soundings," said Aaron Lawton of One Ocean Expeditions, an adventure tourism company that charters the Russian-owned ship Academik Ioffe for Arctic cruises.
"I have travelled on the Ioffe in the Canadian Arctic for (many) seasons and have generally found that the vessel has always cross-referenced the Russian charts," Lawton said in an email from on board the Ioffe off the Antarctic coast.
Vladimir Tereschenkov, head of marine operations, said the Russian charts were published by the Russian Hydrographic Service.
The sections seen by The Canadian Press are photographs of charts in current use on the Ioffe.
Compiled from information gleaned over the years up to 1970, they are clearly marked with Soviet insignia, including the red star and the hammer and sickle.
Both sections are of highly strategic Arctic waterways.
One map is of a section of the Northwest Passage in Barrow Strait, southwest of Resolute.
All deepwater vessels navigating the passage, including submarines, must pass through there.
The other section details a choke point on Nares Strait off Cape Isabella between Ellesmere Island and Greenland.
Not only does Nares Strait pass the U.S. air base at Thule in Greenland, it links the Arctic and Atlantic oceans and avoids waters east of Greenland that were heavily NATO-patrolled during the Cold War.
Both sections of the charts contain many more depth soundings than corresponding modern Canadian charts.
"That was surprising, especially up in that area," said Alex MacIntyre, a highly experienced Canadian ice pilot who was advising the captain last summer on board the Ioffe.
"The thought immediately came to mind, how did they get all those soundings?"
MacIntyre saw the charts one evening last summer on the Ioffe's bridge, where he was joined by passenger Michael Byers, a Canadian academic and Arctic expert who was a guest lecturer on the ship as it cruised the Northwest Passage.
Byers was also struck by the detail of the Soviet charts.
"The difference was immediately apparent," he said.
"The density of soundings on the Soviet chart was much greater than on the Canadian one."
Byers points out that Nares Strait is still choked with thick, hard, multi-year ice and would have been even more so 50 years ago.
Both he and MacIntyre believe the only way the Soviet government could have acquired data for the charts is from nuclear submarines secretly patrolling the Arctic.
"It confirms what many of us assumed," said Byers.
"The Soviet navy was extremely capable and also was willing to take considerable risk. Sending submarines into the Canadian archipelago, which was heavily monitored by NATO, thousands of miles away from Soviet assistance, was a perilous thing to do. It was a phenomenal accomplishment."
Byers said the charts are the first public proof he's seen of that theory.
They suggest that the capabilities of the Soviet navy portrayed in movies may not be entirely fiction.
"I can't help but think back to 'The Hunt for Red October,' where Sean Connery plays the captain of a Soviet nuclear missile submarine and relies on the accuracy of Soviet charts to avoid a torpedo that's been shot at his ship," Byers said.
"These charts indicate that the Soviets were in fact that competent."
Canadian government sources acknowledge that the Soviet charts seem to incorporate Canadian data, but they have no explanation for the additional information they contain.
"We are not sure yet what to make of the difference in sounding-density," said one.
So-called "field sheets" — records of raw data from Canadian hydrographers — are more detailed than the published Canadian charts.
Field sheets are available, but only through application.
Nares Strait has been surveyed three times between 1962 and 2003; the Barrow Strait six times between 1960 and 1989.
Byers said the existence of the Soviet charts doesn't pose a threat to Canadian sovereignty over those waters.
"This Soviet activity was covert," he said.
"At no point did the Soviet Union challenge Canada's sovereignty claims."
The charts do, however, present a buying opportunity, he suggested.
"It would seem prudent, for both shipping safety and economic efficiency reasons, for the Canadian government to obtain a complete set of the Soviet charts so as to determine their potential utility. It might also be possible to obtain the Soviet equivalent of field sheets and an effort to do so should certainly be made."
Although Canada is improving its knowledge of the northern oceans, most of that mapping involves High Arctic waters in preparation for an extended continental shelf claim under the United Nations Convention of the Law of the Sea.
Sea lanes within the Arctic islands are getting less attention.
"At the current rate of charting, it will take 300 years for the Canadian Hydrographic Service to bring all our charts for the Canadian archipelago to world standards," Byers said.
He points out three ships ran aground in the Arctic last summer.
"Those three groundings focused attention on the inadequacy of our charts. That's where the Soviet charts are most interesting. "
This is first and foremost an opportunity for Canada to acquire some very valuable new data.
Links :
- EVC : Russian nautical maps
- Chart Pilot : Nautical charts published by Head Department of Navigation and Oceanography of Ministry of Defense of the Russian Federation (HDNO MD RF). The Russian collection contains 6800 nautical navigation charts, and over 1500 of them are bilingual (Russian and English).