Saturday, June 11, 2016

Mar

Daylight wanes as sky becomes heavy.
Isobars compress and warp; cross-sectioned onions on the nightly news.
The coast awakens, transformed from the doldrums of summer.
Warmth; a flickering memory, like those drawn upon for favourable conditions at half-forgotten spots. The ocean roars, resuming it’s age-old attack on the coastline in a relentless barrage of storm fronts. And so the hunt begins, chasing the nooks hidden from wind and seas.
Schedule revolves around brief opportunities, better described as optimistic hunches.
A goading carrot dangled, and ever so occasionally within reach.
Winter chasing shapes on the fringes of the North Atlantic.
A collections of moments captured along the way.
Mar.

Friday, June 10, 2016

If the ocean was transparent : the see-through sea

Manuscript painting of Bruce C. Heezen & Marie Tharp "World ocean floor" map
by Heinrich C. Berann, (1977)
(Library of Congress Geography and Map Division Washington) 


The ability to peer unhindered into the deep would reveal a host of wonders—and have huge practical consequences

THE surface of Mars is better mapped than that of the Earth.
Every dry, dusty square metre of it has been peered at by cameras and illuminated by altimeters.
The lion’s share of the Earth’s surface has never been shown any such attention.
This is not because Mars is more interesting.
It is because it suffers from an insufficiency of ocean.
In most respects, this is to its detriment; seas are fascinating things that make planets far more habitable.
They also allow paddling, whalesong and other delights.
But they do rather cover things up.

Water absorbs light.
Despite this, seeing through a few metres of it is not too hard, sediment permitting.
And some wavelengths can penetrate a lot more.
A ray that is just the right shade of blue will still be half as bright after passing through 100 metres as it was when it started.
If you were to sink into the ocean looking up, that shade of blue would be the last thing you would see.
But even it would eventually fade to black.
Almost the whole ocean floor is dark to those that inhabit it, and invisible to all.

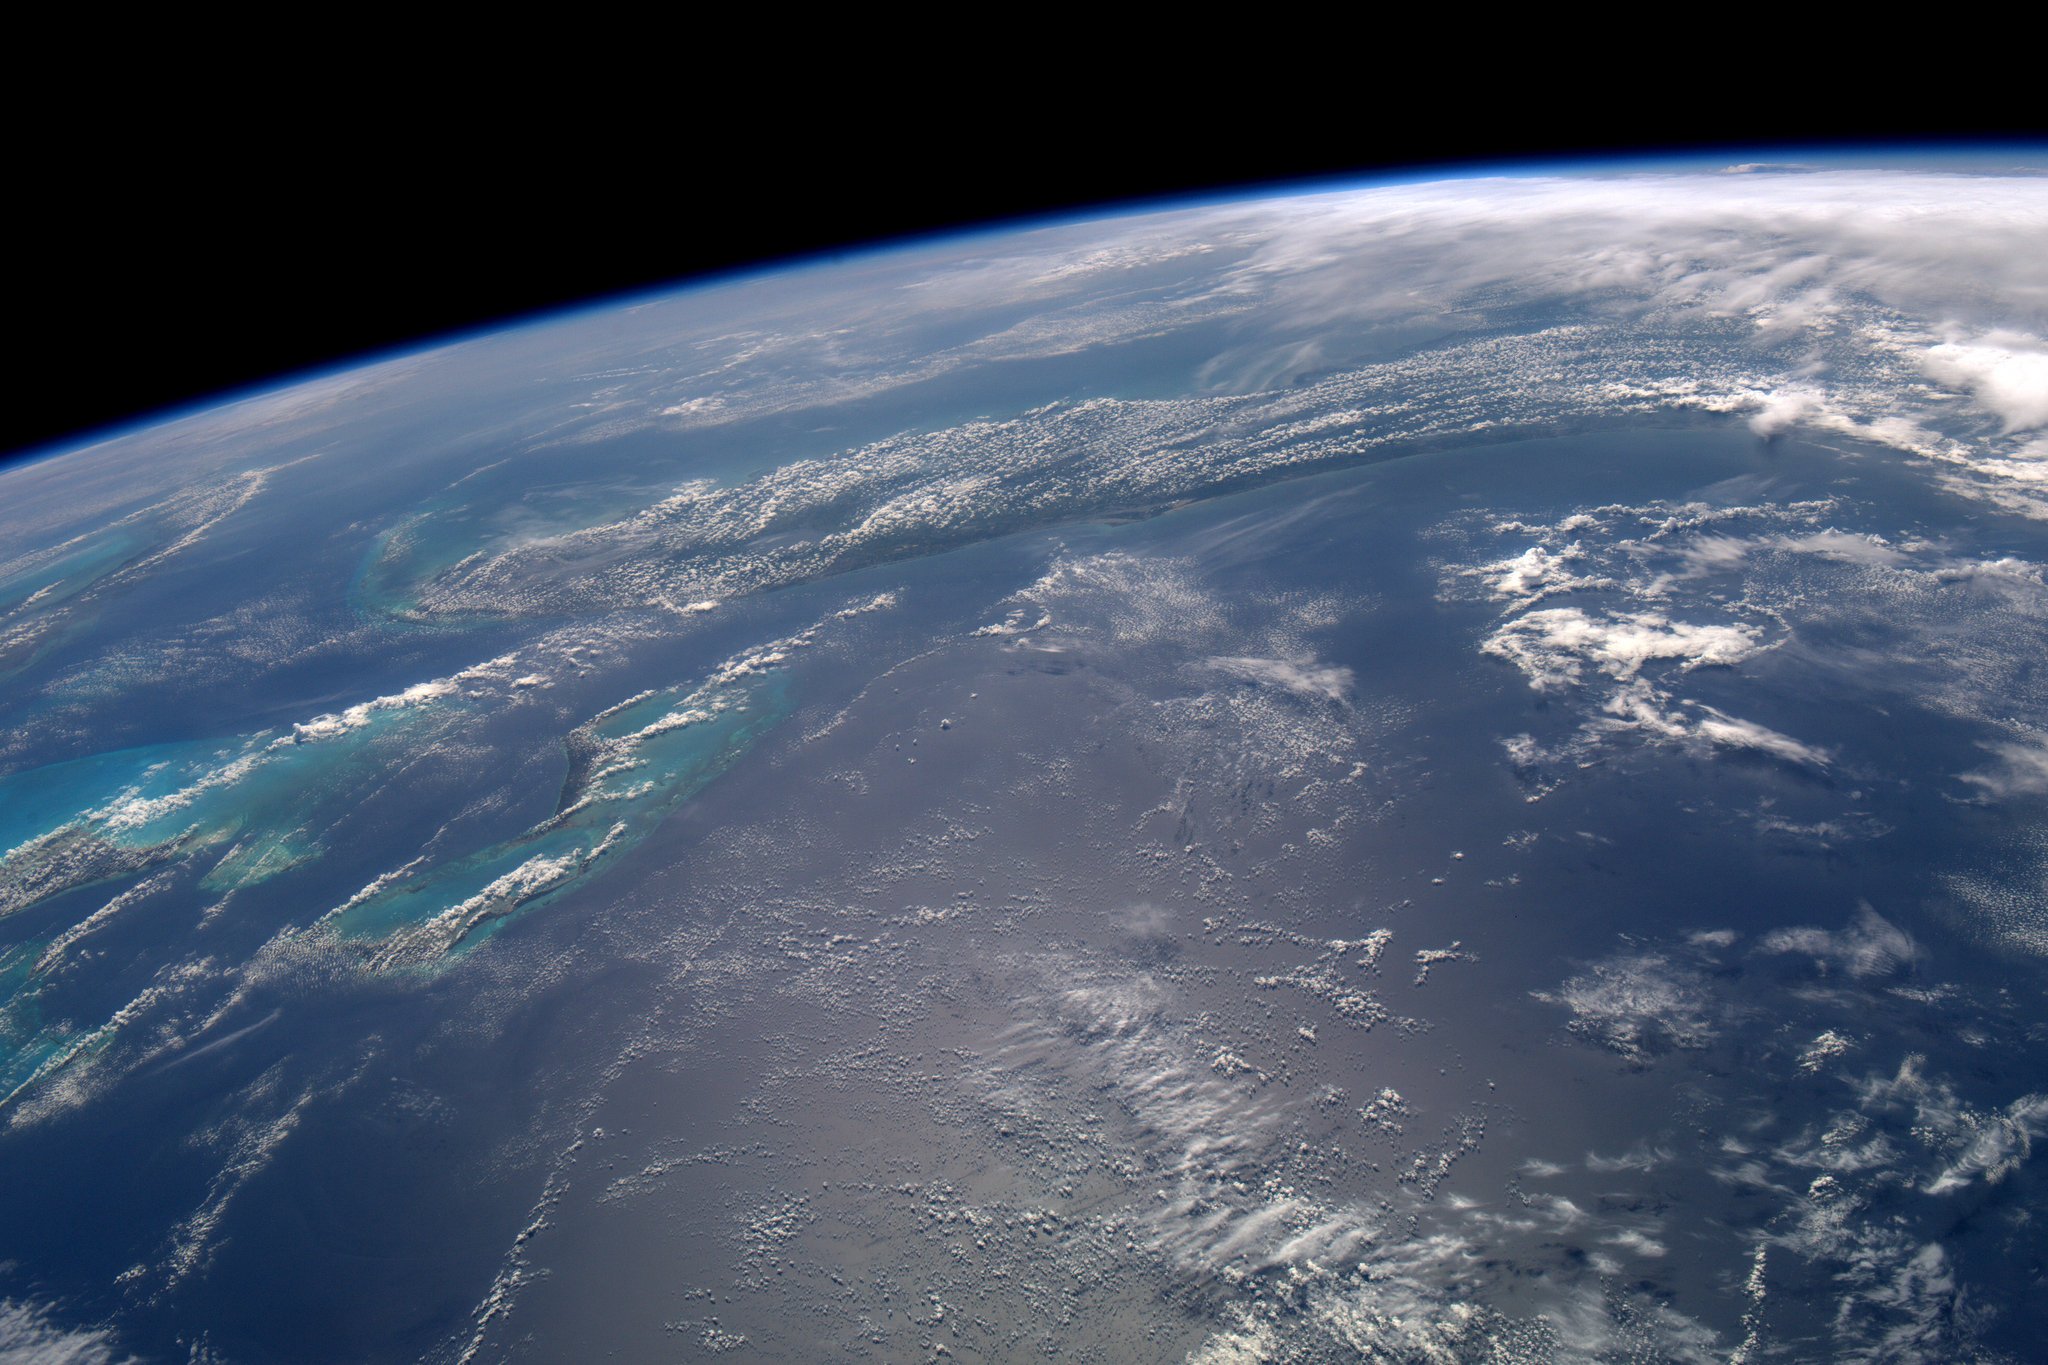
What if it were not—if light could pass through the ocean as easily as it does through the atmosphere?
What if, when you looked down from a trans-Atlantic flight, the contents of the ocean, and its floor, were as clearly visible as if seen through air: what would you see?

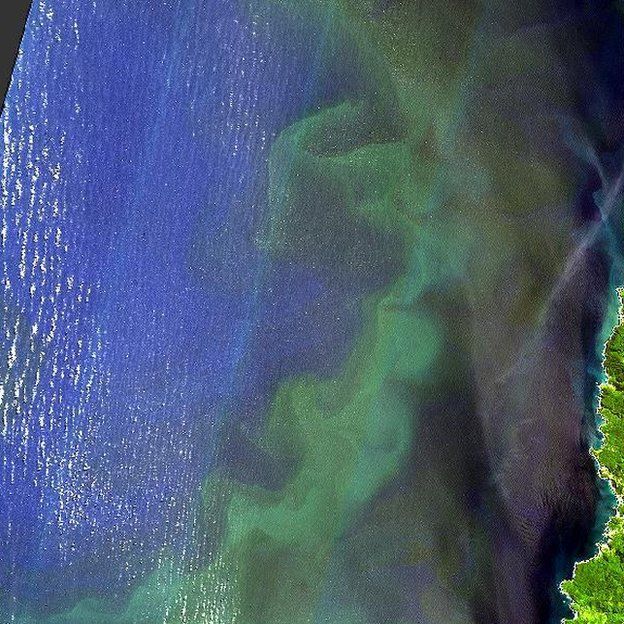
The most persistent feature would be a thin green mist extending a few tens of metres down from the surface.
It would be too sparse to be seen over much of the planet; but in some patches, and close to some shores, it would be a visible layer of light and life.
This is the world’s stock of phytoplankton, tiny photosynthetic algae and bacteria.
Its total mass is far less than that of the plants that provide photosynthesis on land, but every year it takes 50 billion tonnes of carbon out of the atmosphere, turning it into organic matter for the ocean’s inhabitants to eat.
Scant though the planktonic biomass is, it does roughly as much biogeochemical work as all the continents’ forests, savannahs and farms.


 Map of the world without water, 1694

Water, water, everywhere

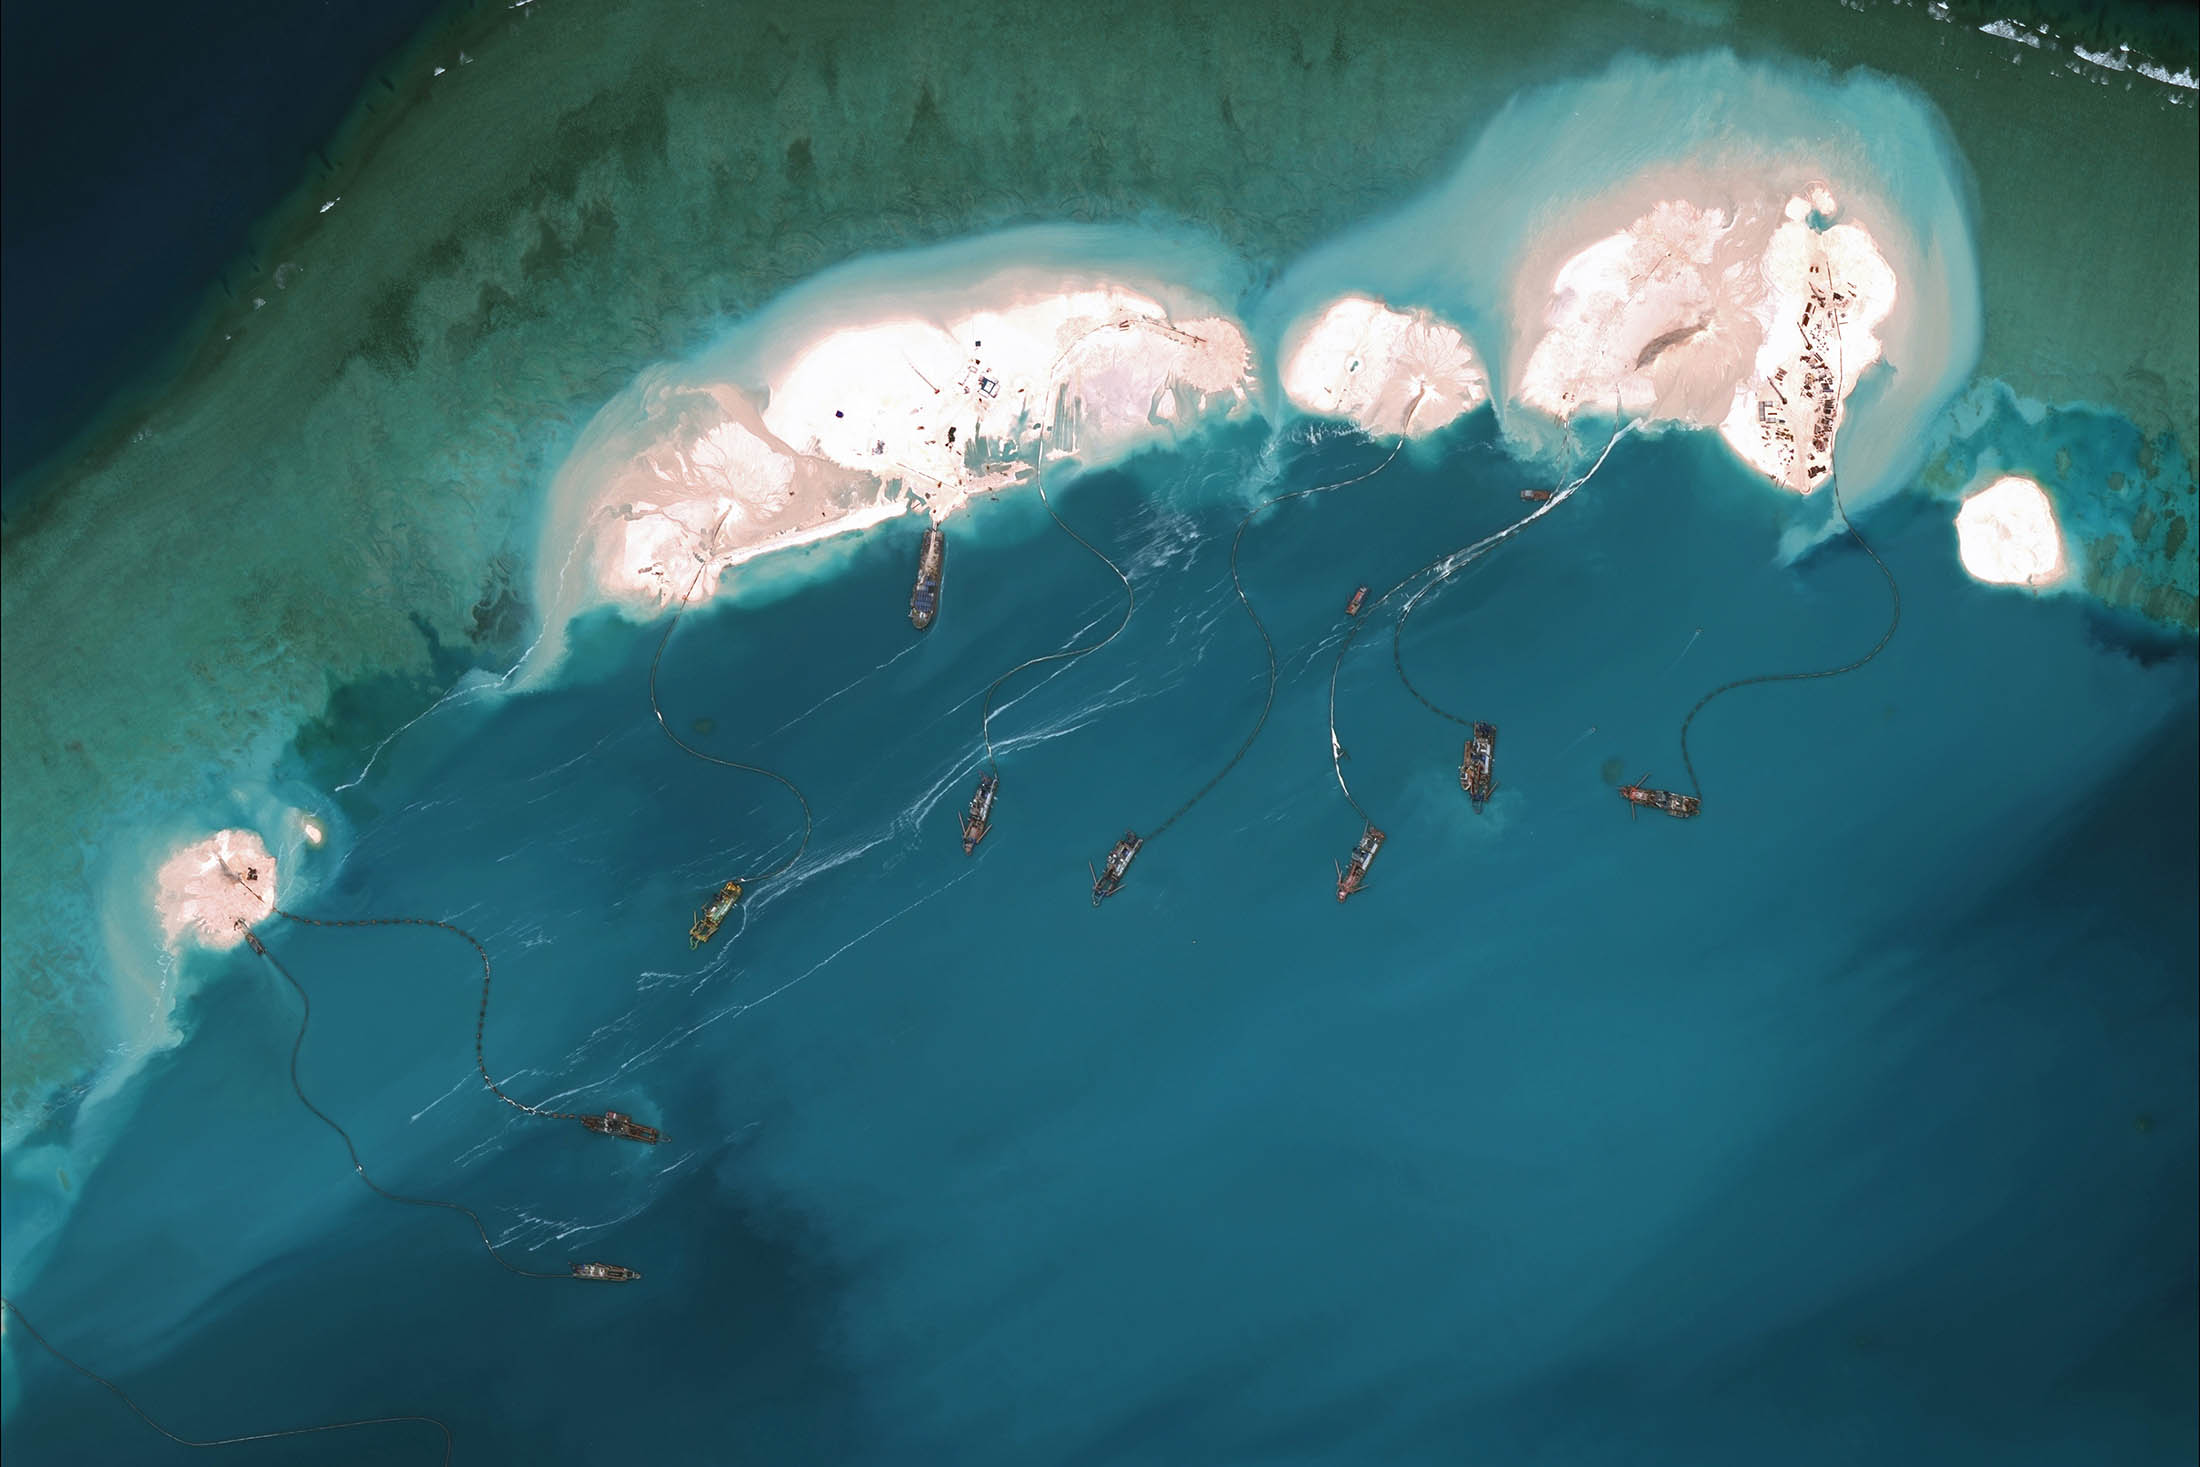
From the smallest of the surface features to the largest, you would also see more than 111,000 ships hanging as if suspended in empty space, according to estimates of the size of the world’s merchant fleet from IHS.
They are the workplaces, and sometimes homes, of at least 1.5m seafarers, and more than 500 liners provide temporary accommodation to hundreds of thousands of passengers, too.
This disassembled city of steel carries some 90% of all international trade by weight.
Its wandering buildings can carry, between them, over 1 billion tonnes of cargo: a mass equivalent to one cubic kilometre of water, a little less than a billionth of the total volume of the ocean.

That brings home the most striking feature of the see-through ocean: its emptiness.
People tend to focus on the bits of the ocean that are full of life (such as reefs) or of trade (such as shipping lanes).
But these are only a tiny fraction of everything there is.
And in much of that everything, there is close to nothing.
Spread those ships out evenly and each one of them would have 3,000 square kilometres of ocean to herself—the size of the state of Rhode Island.

Ships are not the only man-made artefacts that float across the seas.
There is an alarming amount of rubbish—in some places it outweighs the phytoplankton.
As ecologically delinquent as this is, in terms of its bulk the problem would still be easy to overlook in a transparent sea.
The “great Pacific garbage patch” consists of millions of tonnes of rubbish floating in the slowly circulating North Pacific Gyre.
But the size of the gyre is such that the rubbish adds up to just five kilograms per square kilometre.

Indeed, rather than filling the ocean, humankind has been working hard at emptying it.
Tuna stocks are thought to be half of what they were before modern commercial fisheries.
Estimates of Atlantic whale populations based on DNA suggest they used to be between six and 20 times greater than they are today.

The opacity of the ocean makes a straightforward numerical census of what remains impossible.
But Simon Jennings of CEFAS, a research centre in Lowestoft, in England, and Kate Collingridge have made a brave stab at estimating how many fish there are in the sea by applying ecological modelling.
Their result is strikingly small: 5 billion tonnes of fish weighing between a gram and a tonne.
If piled together, those fish would not even fill Loch Ness, which though an impressive body of water is nugatory compared with the whole ocean.
Even if Dr Jennings is off by a factor of ten, the volume of fish would still be less than that of Lake Geneva.
Broadly, the world boasts less than a minnow for every Olympic swimming pool of its seawater.

Yet life in the ocean can still mount sublime spectacles.
Nicholas Makris of MIT and his colleagues have observed fish in the Gulf of Maine using a sonar system that comes as close as almost any technology to making this article’s premise real, and rendering the ocean transparent.
Employing longer wavelengths of sound than most sonars, and taking advantage of lightning-fast processing power, it is possible to create time-lapse movies of sea life over tens of thousands of square kilometres.

Dr Makris’s team have been able to quantify the processes by which herring can gather themselves into shoals many kilometres long comprised of hundreds of millions of fish, watching their depth and behaviour change with the time of day.
And in the Gulf of Maine they were able to distinguish the calls and songs of various species of whale attracted by the herring shoals, to track them as they communicated with each other and to distinguish their different herring-snaffling strategies.

 Marie Tharp working on a map of the ocean floor at Columbia in the 1960s.
courtesy of Lamont-Doherty Earth Observatory

And a thousand thousand slimy things

Other acoustic research has revealed a fundamental feature of ocean life invisible from the surface—a layer of small fish and other creatures that spend their days at depths of a few hundred metres before rising to the surface at night.
In the early days of sonar this was regularly confused with the sea floor, because of the way the fish’s bladders resonated with the sonar’s sound waves.
The daily rise and fall of this “deep scattering layer” would, in a transparent ocean, be revealed as one of the largest mass movements of the animal kingdom.

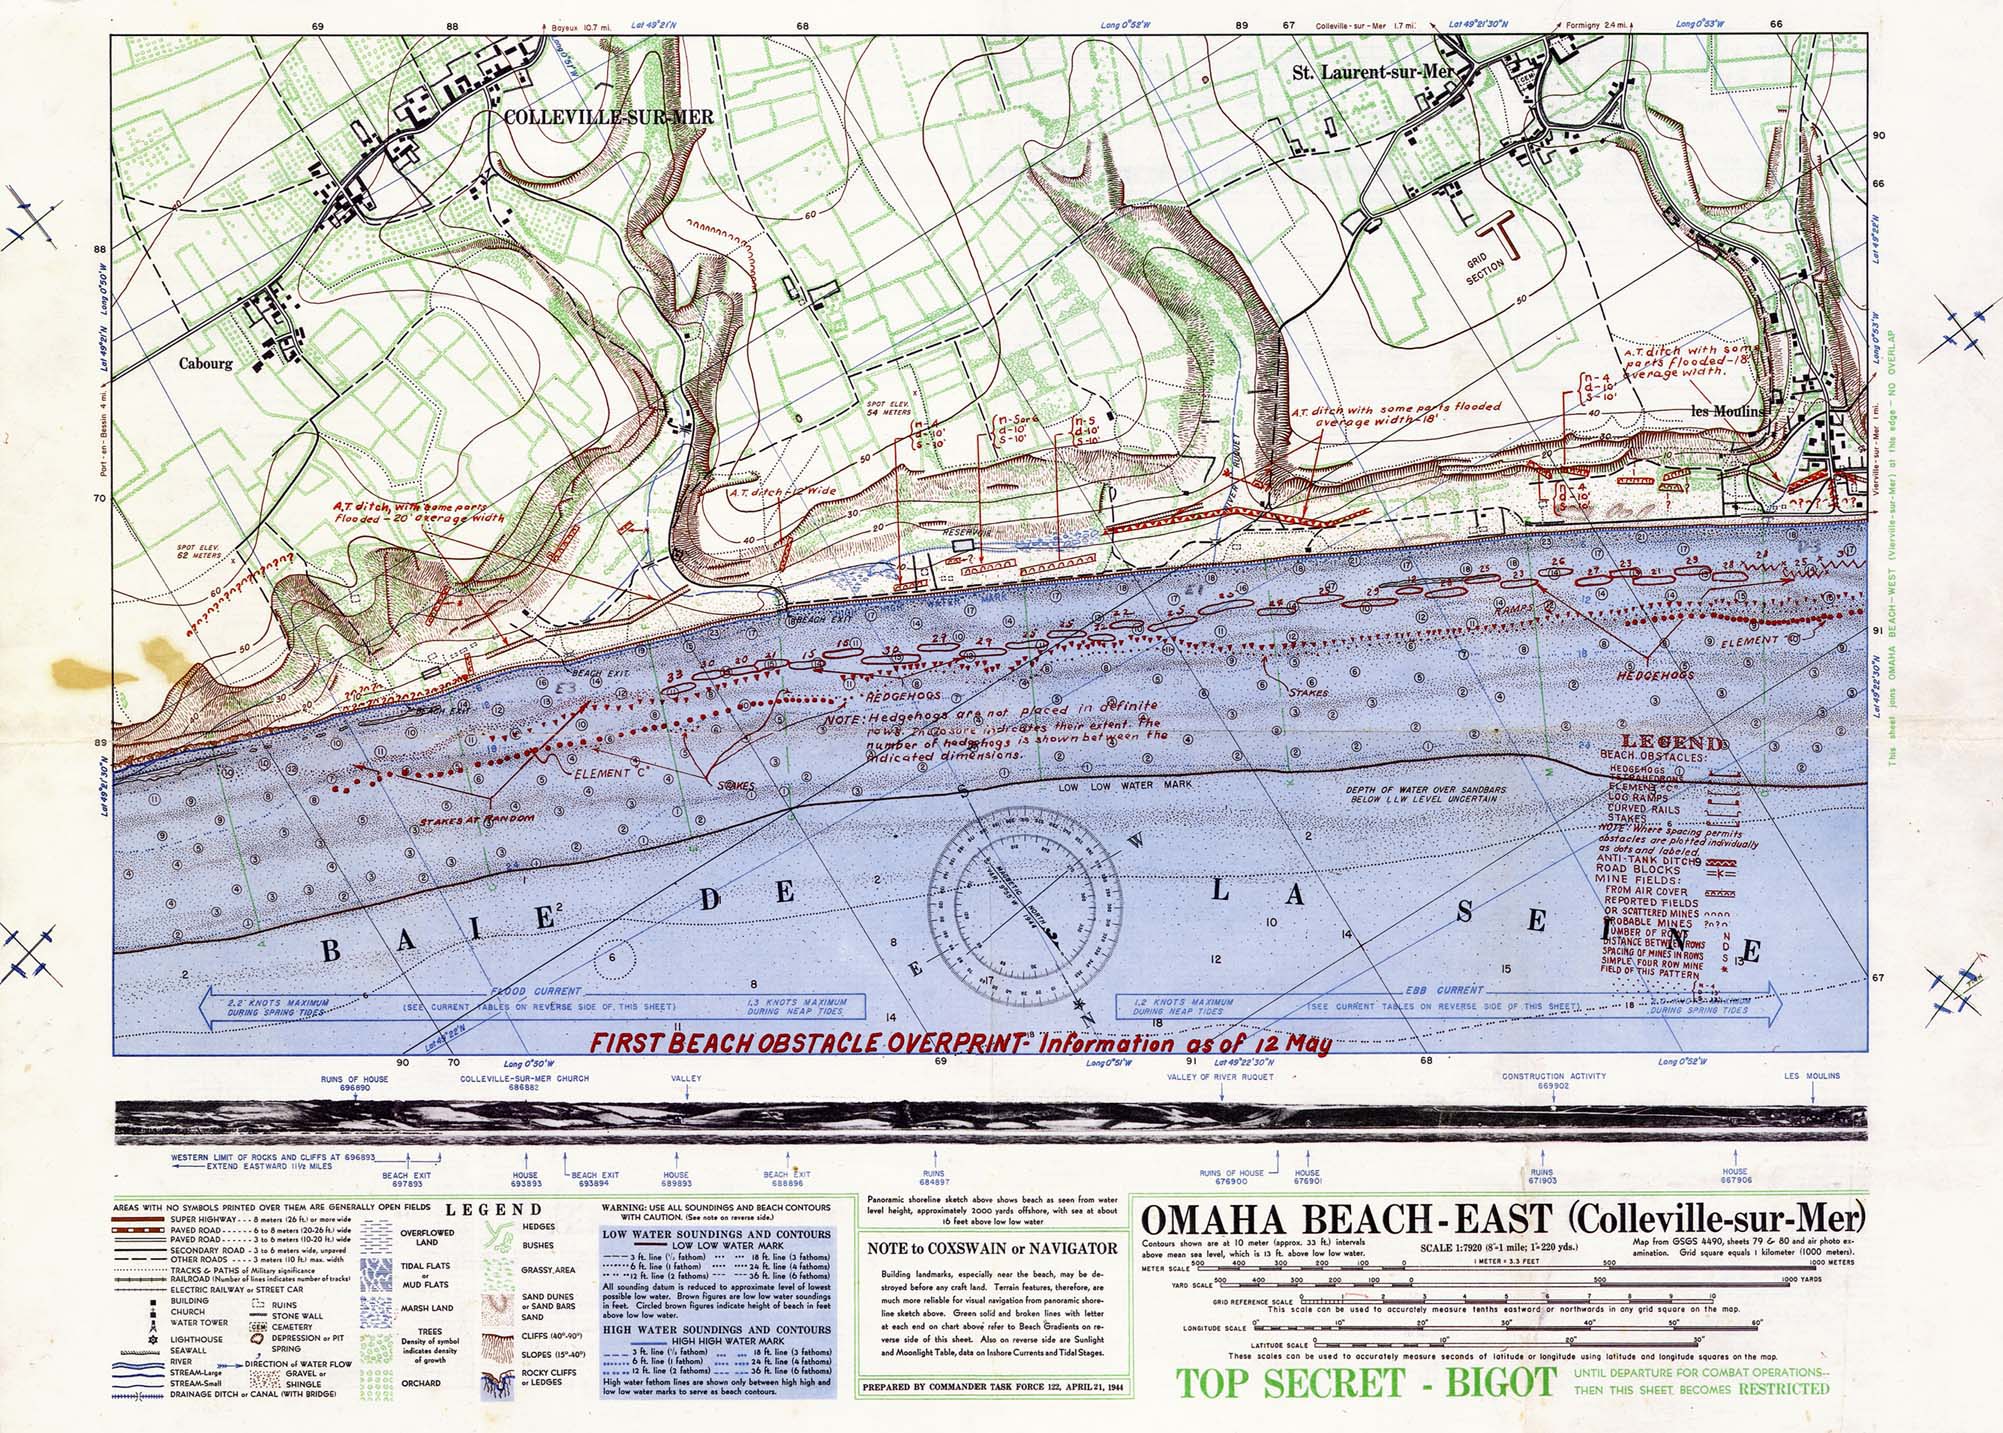
Acoustic techniques produce pictures of the ocean’s floor, as well as its contents.
For most of the 20th century, though, the relevant measurements were sparse.
Thus the pioneering maps put together by Marie Tharp and Bruce Heezen of Columbia University in the 1950s and 1960s—which first identified the structure of the mid-Atlantic ridge, and of the faulted “fracture zones” perpendicular to it—often relied on depth data from just a few ships making single crossings of the ocean to get a sense of vast swathes of the terrain below.
The maps were works of extrapolation, interpolation and inspiration, not mere measurement.

Nevertheless, they had a huge impact.
They let geologists visualise the processes at work in the nascent theory of plate tectonics; those mid-ocean ridges and fracture-zone faults turned out to be the boundaries of the “plates” into which plate tectonics cut the surface of the Earth.
They were mind-expandingly right in their synoptic vision, if frequently inexact and sometimes mistaken in their specifics.

The side-scanning and “multibeam” sonar introduced for civilian use in the 1980s allowed a ship to map not just a thin strip of sea floor directly beneath it but a rich swathe to either side, and to provide detail on its texture, not just its depth.
At first this acuity was used mostly for sites scientists wanted to focus on, or artefacts of particular interest.
UNESCO estimates that there are 3m wrecks on the sea and ocean floors: 30 for every ship that now sails the surface.
Sophisticated sonar has found some of the spectacular ones, such as Bismarck, and others whose cargoes are of commercial interest for salvage.
It has also helped in the laying of ever more cable ever more precisely across the abyss; according to TeleGeography, there are now a million kilometres of submarine cable.
Every second they can carry 31 terabits across the Pacific, 55 across the Atlantic.

Because GPS satellites allow ships to know exactly where they are, and thus exactly which bit of the sea floor they sit above, new sonar technology has also revolutionised mapping.
The 2014 edition of the General Bathymetric Chart of the Oceans (GEBCO), an enterprise begun by Albert I of Monaco in 1903, includes sonar depth data from thousands of voyages, covering more than 60m square kilometres of the ocean floor.
But even that represents only 18% of the ocean floor.
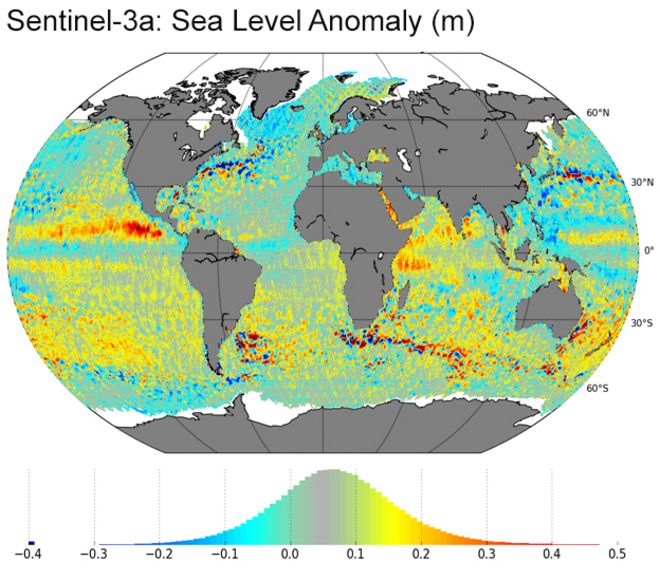
The rest is mapped indirectly, by satellites.

Whereas light is absorbed by water, some forms of electromagnetic radiation bounce right off it.
Satellites can thus use radio waves to get a very accurate picture of the height of the ocean’s surface.
This varies from place to place, reflecting the unevenness in the solid Earth’s gravitational field that comes from the planet not being a perfect sphere.
The sea level is, for example, slightly higher above a seamount—an ocean-floor protuberance that does not make it to the surface—because the water feels the gravitational attraction of its mass.
This difference is only a couple of centimetres; but satellites can measure it.

 Tharp invents augmented reality
Altimetry has discovered at least 10,000 such seamounts.
Statistics suggest that hundreds of thousands of smaller ones remain to be found.
Added together that’s an ecologically interesting habitat about the size of Europe that was previously almost completely uncharted.

Since the 1990s radar-altimetry has allowed oceanographers to fill in the 80% or so of the ocean floor that sonar bathymetry does not cover.
The latest GEBCO map still required some interpolation.
But in both resolution and consistency such hybrid maps are far better than what went before.
In some ways looking at these maps comes as close as one can get to seeing right through the ocean.

The charmèd water burnt alway

There is a subtle distortion, though.
Maps of the ocean floor are typically rendered in a “shaded relief” style (and computers now add a spectrum of “false colour”, with red for high and blue for low).
For this to make sense to the untutored eye, the relief in question has to be exaggerated, typically by a factor of ten or 20.

So people have become used to seeing the ocean-floor world as interestingly craggy.
It really isn’t.
In maps the drops that separate continental shelves from the abyssal plains far below them fall away like the edge of a flat Earth; in fact they have typical gradients of about 7%.
Were it not for the water, few features in the ocean would present an off-road car with much difficulty.

Marie Tharp drew her maps in this way in part to emphasise the new features she, Heezen and their colleagues had discovered.
But it was also because the obvious alternative was no longer legal.
Earlier 20th-century maps of the ocean floor had, like maps of the land, used contours.
In the 1950s the precise depths necessary for making contour maps were classified by the American government.
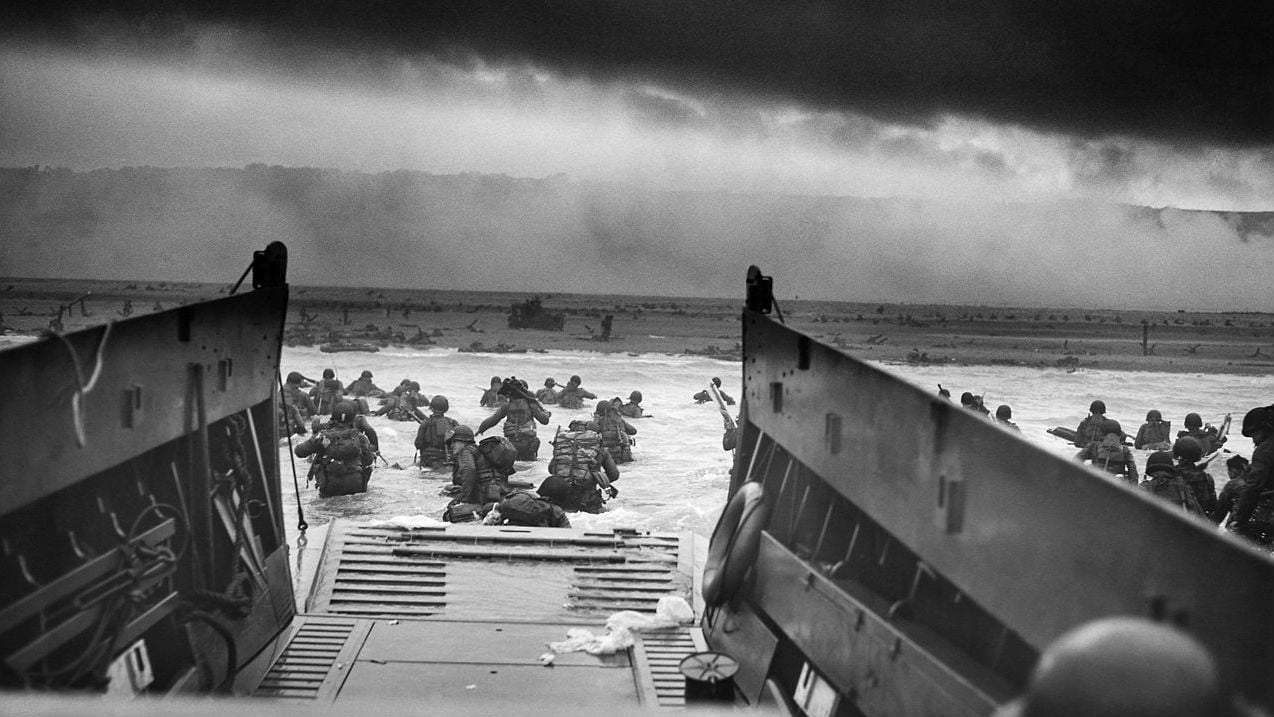
The deep seas were becoming a cold-war battlefield.

Being unseen had given submarines a tactical advantage since they entered widespread use in the first world war.
In 1960 the obscurity of the depths took on a strategic importance, too.
The nuclear-powered George Washington, launched that year, carried 16 Polaris missiles with nuclear warheads.
That her location when submerged could not be known meant there was no way for all of America’s nuclear weapons to be destroyed in a pre-emptive attack.
The appeal of this “assured second strike” capability saw missile submarines adopted by Russia, Britain, France, China, Israel and India.
These days about a dozen nuclear-missile-carrying submarines (known as SSBNs) patrol the ocean at any given time.
If water were perfectly transparent you would see them, plump tubes of menace hanging in the void.
And if you could see them, you could target them.

There is a certain irony, then, that the technologies which have done most to make the ocean transparent have come from the armed forces.
The American navy developed multibeam sonar to understand the submarine battlefield.
The gravitational-field mapping that lies behind satellite altimetry was needed so that submarines and their missiles would better know where they were and what they would hit.
The cold war produced the experts as well as the technology: Dr Makris listened for submarines at the Office for Naval Research before he listened for herring off Maine.
If you were interested in ocean remote sensing, he says, you more or less had to: “They had all the great toys.”

The end of the cold war saw a big drop in undersea sensing as a military priority, but its strategic importance is hardly diminished.
Britain, for example, is deciding whether to renew its SSBN fleet.
It matters whether the submarines will, in the 2050s, be as impossible to trace as they are today.

 Geological map of the seafloor by Nicolas Parubets

Under the keel nine fathom deep

What new technological approaches might be able to make the ocean transparent to submarine-hunters?
Two are widely discussed: drones and big data.
Uncrewed surface vessels and submersibles might be able to field far more instruments more cheaply than navies have in the past.
And new data-processing capabilities might be able to make sense of signals that would previously have been swamped by noise.

Thousands of remote-sensing platforms are already scattered around the ocean.
The Argo array currently consists of 3,918 floats which submerge themselves to about 2,000 metres and then return to the surface, measuring temperature and salinity as they rise and fall and sending their data back by satellite.
By gauging the amount of heat stored in the ocean they are crucial to studies of climate change.
These floats go where the currents take them, but that is not mandatory.
The wings of “seagliders”, which also rise and fall by changing their buoyancy, allow them to traverse large distances as they sink.
They can operate autonomously for months at a time and traverse whole ocean basins.

There do not yet appear to be any seagliders designed for detecting or tracking submarines—but in April DARPA, the Pentagon’s developer of futuristic technology, commissioned Sea Hunter, a small non-submersible trimaran that needs no crew, but carries sensors.
It is intended to prove that once an enemy submarine is located it can be trailed indefinitely.

Sea Hunter is designed to track conventional diesel-electric submarines, not SSBNs.
The American navy got a shock in 2006 when a previously unnoticed Chinese diesel-electric boat surfaced less than 10km from one of its aircraft-carriers, Kitty Hawk, in the Philippine Sea.
If it wants to keep its carriers safe it needs to be able to keep better tabs on such craft.
But what can be used for one sort of submarine today might be adapted to track another tomorrow.
It is likely that drones above, on or below the surface will come to play a much bigger role in anti-submarine warfare; the underwater ones, though, will still have to deal with the sea’s opacity.
A swarm of airborne drones can co-ordinate itself by radio, but things are harder underwater.

New data-processing approaches could also make submarines easier to see.
America’s Ohio-class submarines displace 18,750 tonnes when submerged.
Moving such a big object, even slowly, will leave a wake of sorts on the surface.
Computers are getting better and better at picking small signals out of noisy data.
And being metal, submarines have an effect on the Earth’s magnetic field, another potential giveaway.
Flying drones equipped with new sorts of magnetometer could make submarine-hunting easier.

Turning these possibilities into operational systems could make vital parts of the ocean—for example, some of the seas off Asia—transparent.
Scaling them up to cover whole ocean basins, though, would be a huge endeavour.
Remember the first insight of the transparent ocean: very big, very empty.
That array of 3,918 Argo floats works out as one per 340,000 cubic kilometres of water.
And SSBNs are sneaky.

If the SSBNs can still find somewhere to lurk, for now, the ocean will surely become more see-through, especially at the edges.
Dr Makris would like to make sonar systems like that which he and his colleagues have pioneered available for fisheries management.
As Dr Jennings points out, the seas are already transparent for a lot of fishing fleets, thanks to short-range fish-finding sonar and spotter planes.
Letting managers see what is going on might be a boon for conservation in some fisheries.

Charting of the deep seas will continue, too.
The task is daunting: Larry Mayer of the University of New Hampshire says multibeam-sonar mapping of all the remaining deep ocean would take 200 years of a research ship’s time.
But bit by bit it will be done.
A GEBCO forum in Monaco this month will discuss the way forward.

Being able to see is only the start; then you have to learn to look, to distinguish, to understand.
What ecological patterns could be discerned from those as yet unmapped seamounts?
What secrets lie in the ecosystems of the deep sea?
What archaeological surprises may lurk in those millions of wrecks—or in the abandoned homes of those who, in the last ice age, lived in plains that today are sea floors?
Where is the heat the Argo floats are tracing ending up—and how likely is it to come back out?
What sorts of clever management could restore some of the riches that have been fished away?

There is a fear that making things visible will strip them of their mystery.
Maybe so.
But it need not strip away curiosity or wonder.
As mappers of both Mars and the ocean bear witness, there is no void, abyssal or interplanetary, that those feelings cannot fill, if given a chance.

Links :

Thursday, June 9, 2016

China is planning a massive sea lab 10,000 feet underwater

A Google Earth animation of the artificial island being built on Fiery Cross Reef.
courtesy of Timothy Whitehead, GEblog

From Bloomberg

China is speeding up efforts to design and build a manned deep-sea platform to help it hunt for minerals in the South China Sea, one that may also serve a military purpose in the disputed waters.


Photographer: DigitalGlobe/ScapeWare3d/DigitalGlobe/Getty Images

Such an oceanic “space station” would be located as much as 3,000 meters (9,800 feet) below the surface, according to a recent Science Ministry presentation viewed by Bloomberg.
The project was mentioned in China’s current five-year economic plan released in March and ranked number two on a list of the top 100 science and technology priorities.

 China considers more than 80% of the South China Sea its sovereign territory.
Its construction of seven artificial islands in the Sea has raised tensions in a region with overlapping territorial and economic interests.

Authorities recently examined the implementation of the project and decided to accelerate the process, according to the presentation.
"Having this kind of long-term inhabited station has not been attempted this deep, but it is certainly possible," said Bryan Clark, a senior fellow at the Washington-based Center for Strategic and Budgetary Assessments.
"Manned submersibles have gone to those depths for almost 50 years. The challenge is operating it for months at a time."

So far there are few public details, including a specific time line, any blueprints or a cost estimate -- or where in the waterway it might be located.
Still, China under President Xi Jinping has asserted itself more strenuously in the South China Sea, one of the world’s busiest shipping routes.
Its claims to more than 80 percent of the waters and the creation of artificial islands covering 3,200 acres have inflamed tensions with nations including Vietnam and the Philippines.

 Vietnam disputes China’s claim to the Paracel Islands, which China has occupied since 1974. Sixty-four Vietnamese sailors died in a 1988 naval clash between Vietnam and China near Johnson South Reef.

Shipping Lane

It has also led the U.S. to send ships from its Seventh Fleet to ensure freedom of passage through an area that carries $5.3 trillion of global trade a year.
"The deep sea contains treasures that remain undiscovered and undeveloped, and in order to obtain these treasures we have to control key technologies in getting into the deep sea, discovering the deep sea, and developing the deep sea," Xi said last month at a national science conference.

While China’s appetite for natural resources remains the driving force behind the project, the recent ministry presentation noted the platform would be movable, and used for military purposes.
China has proposed a network of sensors called the "Underwater Great Wall Project” to help detect U.S. and Russian submarines, say analysts at IHS Jane’s.

 Tensions between the Philippines and China escalated in 2012 after the Philippine navy detained eight Chinese fishing vessels near the Scarborough Shoal.
China has since taken possession of the Shoal.

‘Important Strategy’

"To develop the ocean is an important strategy for the Chinese government, but the deep sea space station is not designed against any country or region," said Xu Liping, a senior researcher for Southeast Asian affairs at the Chinese Academy of Social Sciences, a government-run institute.
"China’s project will be mainly for civil use, but we can’t rule out it will carry some military functions,” Xu said.
“Many countries in the world have been researching these kind of deep water projects and China is just one of those nations."

When analysts look at the South China Sea, they tend to focus on the potential for oil and gas reserves as estimates for mineral deposits are sketchy.
The U.S. Energy Information Administration says the area has proved and probable reserves of about 11 billion barrels of oil and 190 trillion cubic feet of natural gas.

China’s estimates dwarf those. In 2012, Cnooc Ltd.’s then-chairman estimated the area holds around 125 billion barrels of oil and 500 trillion cubic feet of natural gas.

 Taiwan and China's overlapping claim to the South China Sea is based on an imprecise "nine-dash line" drawn on a map sometime in the 1940s, before China split in 1949.
Taiwan operates one outpost in the Spratlys.

Typhoon Challenge

While most of the undiscovered oil lies in coastal regions that aren’t disputed, the contested areas face geological and technological challenges, not least the depth of the waters and frequency of typhoons.

Spearheading the planning for the deep-sea station is the China Shipbuilding Industry Corporation, according to a statement on the website of the science ministry.
Once operational, it would host dozens of crew members who could remain underwater for up to a month, the ministry’s presentation separately said.

China Shipbuilding Industry Corporation and the ministry did not reply to faxes seeking comment.

 Brunei and Malaysia also claim maritime boundaries in the Sea. Malaysia operates several military outposts in the Spratlys.
Brunei has claims to several reefs, but occupies no territory.

Price Tag

Planning has been under way for a decade and is central to China’s push to become a global technology superpower by 2030, according to the presentation.
Completing it would help China close a deep sea exploration gap with the U.S., Japan, France and Russia on underwater technology.
China has already logged successes, with its Jiaolong submersible setting a world record by descending 7 kilometers in 2012.

The ministry presentation didn’t give any estimated price tag but Bryan Clark, who formerly served as special assistant to the chief of U.S. naval operations, said the cost could be daunting and its vulnerability to detection would make it less attractive militarily than using a submarine or an unmanned vehicle.

China spent 1.42 trillion yuan ($216 billion) on state and privately-funded research and development in 2015, according to the National Statistics Bureau, while total defense spending this year is projected by the government to increase 7.6 percent to 954.4 billion yuan ($145 billion).

"The kinds of systems that make sense for deep sea are sensor and communication systems," said Clark.
"In the Cold War, the U.S. and USSR spent much effort looking for each others’ communication cables and sensors to disrupt them in peacetime or attack them in war. We can assume those efforts would continue today and into the future."

 The South China Sea is a vital thoroughfare for the global economy.
Home to 10% of the world’s commercial ocean fish stock, the sea lies above an estimated 11 billion barrels in oil reserve

Links :

Wednesday, June 8, 2016

World Oceans Day : What’s working? Inspiring ambitious coalitions for the Ocean and Climate


From Huffington Post by José Maria Figueres

Important global challenges can be overcome by strong global coalitions.
That is exactly what happened at COP21.
Countries, with business and civil society as relevant players in the build-up to the Paris Summit, finally broke through years of slow progress to hammer out a global Climate Agreement.


But what about the Ocean?
What about our 8th continent where life begins, covering 70% of the Earth’s surface?
In spite of its present degradation there are reasons to celebrate this year’s Oceans Day with renewed optimism.
Here are two reasons why this is so.

Firstly, recent years have witnessed growing global understanding on the importance of the Ocean within our planetary climate system.
Indeed the persevering work of many, including the more recent report of the Global Ocean Commission, points to the importance of moving towards a rescue package to recover the Ocean’s health.
To this point, early in 2015 the world agreed to give the Ocean its own Sustainable Development Goal (SDG 14) to strengthen its resilience and to take action to restore the health of marine ecosystems.

Secondly, the Paris Agreement on Climate Change pledges to keep average temperature rise below 2oC, with the aspiration of not passing 1.5oC.
This is vital for the future health of the Ocean, which is already suffering the chronic impacts of warming and acidification as a direct result of absorbing our excess heat and emissions.

This last point was evident during the Paris Climate Summit.
I was there to participate in the launch of the Because the Ocean alliance of countries and organizations calling for an end to the divide between Climate and Ocean.
Heads of State and Ministers from 22 countries signed this declaration, requesting a special report by the Intergovernmental Panel on Climate Change (IPCC) on the ocean-climate interface, and a dedicated ocean action plan under the UN Framework Convention on Climate Change (UNFCCC).

 photo courtesy of Jeff Williams from ISS

In 2016 we are already seeing results.
The IPCC has established its work program for the 6th Assessment Cycle, with the Ocean as a major priority.
It also announced the preparation of a new special report dedicated to interactions between climate, ocean and the cryosphere.
Our recommendations in Paris are becoming a reality!
After all, it is about time the Ocean was fully integrated into the climate field.
It captures and stores over 2 billion tonnes of CO2 every year, an entirely free service valued at around US$148 billion a year.
We cannot afford to lose the precious marine biodiversity that, as well as providing food and livelihoods is saving us by fixing this carbon, avoiding even more acute, faster climate impacts.

Therefore, after many years of abject neglect and willing abuse of the Ocean, I am hopeful these international processes are now working towards Ocean restoration and protection.
We will achieve an ambitious global coalition for the Ocean.
But it will take time.
While we work towards this goal, action must not wait.
In our individual nations, regions, companies, communities and homes we should all be taking steps towards a healthy Ocean.

Science is leading the way.
It is inspiring to witness the way that marine experts are expanding our knowledge and understanding of the Ocean, and increasingly influencing the decisions of governments, industry and consumers.
With today’s rapid communications, the lag-time between discovery and action is getting shorter.
As people learn more about the Ocean and our devastating impact on it, the mobilization of citizen campaigns and consumer influence over the fishing and energy industries, is growing.
Coalitions for change are coming together in our streets and shops as well as at world summits.
After years of fighting for the Ocean, this year I am celebrating World Oceans Day with more hope than ever before.
We have a long way to go, but we are beginning to sail together in the right direction!

Links :

Tuesday, June 7, 2016

D-Day: the largest seaborne invasion in History


The Normandy landings on June 6, 1944, (D-Day) were the largest seaborne invasion in history.

The operation, codenamed Operation Neptune, began the liberation of German-occupied northwestern Europe from Nazi control and contributed to the Allied victory on the Western Front.

The amphibious landings were preceded by extensive aerial and naval bombardment and an airborne assault.
The landing involved 24,000 American, British and Canadian airborne troops shortly after midnight.
Allied infantry and armored divisions began landing on the coast of France at 06:30. 

 A LCVP (Landing Craft, Vehicle, Personnel) from the U.S. Coast Guard-manned USS Samuel Chase disembarks troops of Company E, 16th Infantry, 1st Infantry Division (the Big Red One) wading onto the Fox Green section of Omaha Beach (Calvados, Basse-Normandie, France) on the morning of June 6, 1944.
American soldiers encountered the newly formed German 352nd Division when landing.
During the initial landing two-thirds of the Company E became casualties.

The target 50-mile (80 kilometer) stretch of the Normandy coast was divided into five sectors: Utah, Omaha, Gold, Juno and Sword Beach.
Strong winds blew the landing craft east of their intended positions, particularly at Utah and Omaha. While the weather on D-Day was far from ideal, postponing would have meant a delay of at least two weeks, as the invasion planners had requirements for the phase of the moon, the tides, and the time of day that meant only a few days in each month were deemed suitable.

Omaha Beach East map
The Army Map Service, an NGA predecessor, provided maps for the Normandy invasion
and throughout World War II. 
The Army Map Service, a DMA predecessor, met the challenge of providing maps for the Normandy invasion, as well as all of World War II.
During that time, the AMS operated 24 hours a day, six days a week and maintained a skeleton crew on the seventh.
It successfully met every mapping request worldwide.
During the four-year period, 1941–1945, the AMS prepared more than 40,000 different maps of all types. (example)
Many of these were maps of areas never mapped before, prepared and brought up to date by aerial photography obtained by Allied forces aircraft, flying bombing missions.
Normandy invasion required about 3,000 different maps with a total of 70 million sheets.
The total production of maps by the AMS during WWII was approximately 500 million sheets.
If stacked one on top of another, they would reach about 31 miles high, 134 times the height of the Empire State Building.

The men landed under heavy fire from gun emplacements overlooking the beaches, and the shore was mined and covered with obstacles such as wooden stakes, metal tripods and barbed wire, making the work of the beach-clearing teams difficult and dangerous.

Adolf Hitler placed German Field Marshal Erwin Rommel in command of German forces and of developing fortifications along the Atlantic Wall in anticipation of the invasion.

The Allies failed to achieve any of their goals on the first day. Carentan, St. Lô, and Bayeux remained in German hands, and Caen, a major objective, was not captured until 21 July.
Only two of the beaches (Juno and Gold) were linked on the first day, and all five beachheads were not connected until 12 June.
However, the operation gained a foothold which the Allies gradually expanded over the coming months.


Losses to merchant ships during the invasion were much lower than had been anticipated.
Many ships plied back and forth between English ports and the beaches at Normandy.
Some ships made as many as three trips in June alone.

 'Mulberry' artificial harbour in Arromanches (SHOM map with the GeoGarage platform)

The U.S. Naval History and Heritage Command describes how a modern, artificial port was built at Omaha and Utah beaches.
Armed Guards on some 22 merchant ships which were scuttled to make a breakwater played a vital part in the operation.
For days they endured the early fury of the German counter-attack and helped give fire protection to the forces ashore from their partly submerged ships. 

Normandy landing : first assault

Carrying out the time-honored task of saving lives, albeit under enemy fire on a shoreline thousands of miles from home, the U.S. Coast Guard’s cutters involved in the invasion of Normandy saved more than 1,400 souls, but the day was also one of the bloodiest days in Coast Guard history.
German casualties on D-Day were around 1,000 men.
Allied casualties were at least 10,000, with 4,414 confirmed dead.


Links :

Monday, June 6, 2016

Sentinel's first map of sea-surface 'hills and valleys'

 Retrieving this type of data is one of the most basic objectives of a space altimeter

From BBC by Jonathan Amos 

The EU's Sentinel-3a satellite has given a sneak peek at what will be one of its most fundamental products - a map of sea surface height anomalies.

Launched in February, the spacecraft carries an altimeter to sense the oceans' "hills" and "valleys".
It is basic information that is needed to track currents and eddies, inform ocean forecasts and track variability in climate-driven sea-level rise.
This first Sentinel-3a global map contains just one month's data.
The acquisition was made between 3 March and 2 April 2016.
Red shows (positive) areas where the sea surface is higher than the reference sea level, and blue (negative) areas reveal where it is lower.
Positive anomalies are normally associated with warmer waters and a deeper thermocline, with negative anomalies associated with cooler waters and a shallower thermocline.
The thermocline is the transition layer between warmer mixed water at the ocean's surface and cooler deep water below.
The "reference" against which Sentinel-3a is looking is the historical dataset gathered by satellite altimeters since the early 1990s.

 MonteCristo island, Tyrrhenian Sea on open web map for Sentinel2

Montecristo island with the GeoGarage
(IIM/Navimap nautical map layer)

Montecristo island viewed from the sea

Six-satellite set

Some of the big features immediately recognisable in the map are the Gulf Stream moving up the US East Coast and across the North Atlantic, the Brazil-Falklands Confluence Zone in the southeast Atlantic, the Benguela and Agulhas currents that hug the southern tip of Africa, and the Kuroshio current that sweeps east of Japan into the central Pacific.
Sentinel-3a joins five other space altimeters already in orbit that are contributing this kind of data. This number of instruments is unprecedented.
"The main reason you want so many space altimeters is to provide good sampling of mesoscale details," explained Dr Craig Donlon, the European Space Agency's (Esa) mission scientist on Sentinel-3a.
"Given the very narrow field of view which is at nadir (straight down), you only get to see a few km in width, depending on the sea state.
"With a series of altimeters flying in a constellation, you can improve the sampling of the global ocean. But you have to make sure that at least one of those altimeters is working as a reference. This one must be an accurate, well-monitored system, and a consistent system throughout the historical altimeter constellation as well.
"That's been the Topex/Jason series, soon to become Sentinel-6/Jason-CS in a few years' time. The reference altimeter orbit is a 66 degree (relative to the equator) orbit, that was chosen very deliberately because you minimise tidal aliasing, because as you can imagine, if you have tides in your signal it's very confusing."

This image was taken by the Copernicus Sentinel-2 satellite on 1 October 2015. It shows how reflection of solar radiation by the sea surface reveals the complex patterns of waves as they interact with the coastline and seafloor off the tip Dorre Island, Western Australia. 
Copyright contains modified Copernicus Sentinel data (2016), processed by OceanDataLab

But being in a 66-degree orbit means behaviour at the poles is lost.
That is where S-3a comes in.
It goes to much higher latitudes, enabling it for example to have a look at what is happening in the Arctic Ocean.
It is hard to overstate the importance of sea surface elevation to the study of the oceans.
Just as surface air pressure reveals what the atmosphere is doing above, so ocean height will betray details about the behaviour of water down below.
The data gives clues to temperature and salinity, and when combined with gravity information, it is possible to gauge not just current direction but speed as well.
The oceans store vast amounts of heat from the Sun, and how they move that energy around the globe and interact with the atmosphere are what drive our weather and climate systems.

 El Nino warmth suppresses the normally cold waters of the Humboldt current, boosting algal growth
(Copenicus/ESA) 

The sea surface anomalies map, processed by the French space Agency CNES, was released here in Prague at Esa's Living Planet Symposium - a conference dedicated to Earth observation.
Many of the talks are centred on data coming from the EU's new Sentinel satellites - the biggest EO project in the world.
Four spacecraft have now been launched, with many more to follow.
Esa's Earth observation director Prof Volker Liebig showed a recent image from the colour camera on Sentinel-2a.
This featured a giant algal bloom off the coast of Chile.
The bloom was powered by the warm waters brought to the eastern Pacific last year by the El Nino phenomenon.
"Twenty-four million salmon in fish farms died as a consequence of this event," he said.
"The El Nino led to warm water there; normally it is cold water. The industry was unprepared. Eight-hundred-million US dollars have been lost.
"We hope governments and industry will become more aware of these (Sentinel satellite) tools and use them in the future to be better prepared."

A multitude of services based on Sentinel and other satellite data is already available under the EU's Copernicus programme.

How Weather4D Pro does work from Copernicus Observer
Free and open access to Copernicus data: 
added value for smartphone applications : safer sailing with Weather 4D
Weather4D is one of the first smartphone and tablet applications to combine weather and ocean data.
The application is designed for marine navigation, and can calculate the optimal route (based on waves and wind, amongst other parameters) for a ship, sailing boat or fishing vessel using Copernicus products.
The success of the Weather4D app provides a credible testimony to the added value that Copernicus provides in the emerging e-navigation sector.
(see Copernicus observer)

The European-funded Sentinel series

  • The Sentinels represent the world's most ambitious Earth observation project
  • Sentinel-1: Radar satellite that can see the Earth's surface in all weathers
  • Sentinel-2: Colour camera dedicated to study principally land changes
  • Sentinel-3: Multi-wavelength detectors tuned to observe ocean behaviour
  • Sentinel-4: High-orbiting sensor to measure atmospheric gases
  • Sentinel-5: Low-orbiting atmospheric sensor to help monitor air quality
  • Sentinel-6: Evolution of the long-running Jason sea-surface height series

What is the Copernicus programme?
  • EU project that is being procured with European Space Agency help
  • Pulls together all Earth-monitoring data, from space and the ground
  • Will use a range of spacecraft - some already up there, others yet to fly
  • Expected to be invaluable to scientists studying climate change
  • Important for disaster response - earthquakes, floods, fires etc
  • Data will also help design and enforce EU policies: fishing quotas etc

Links :

Sunday, June 5, 2016

Stress and effect on a vessel in severe weather conditions

Stress and effect on a vessel in severe weather conditions.
Recorded during passage from Suez Canal to Singapore, recorded in June 2008.