Saturday, July 18, 2026

Friday, July 17, 2026
The line nobody owns
From Substack by Dr. John E. Nyberg
There are two international date lines.
They disagree by over two thousand kilometers.
Neither is enforceable, and no one has the standing to reconcile them.
A ship lies thirteen miles off Kiritimati, in the Line Islands of Kiribati.
Close enough that the crew can see land.
What day is it aboard?
Ashore, it is Monday.
Kiribati moved itself onto that side of the calendar in 1995, and that was its sovereign right.
Open a navigation text, however, and you find a different answer.
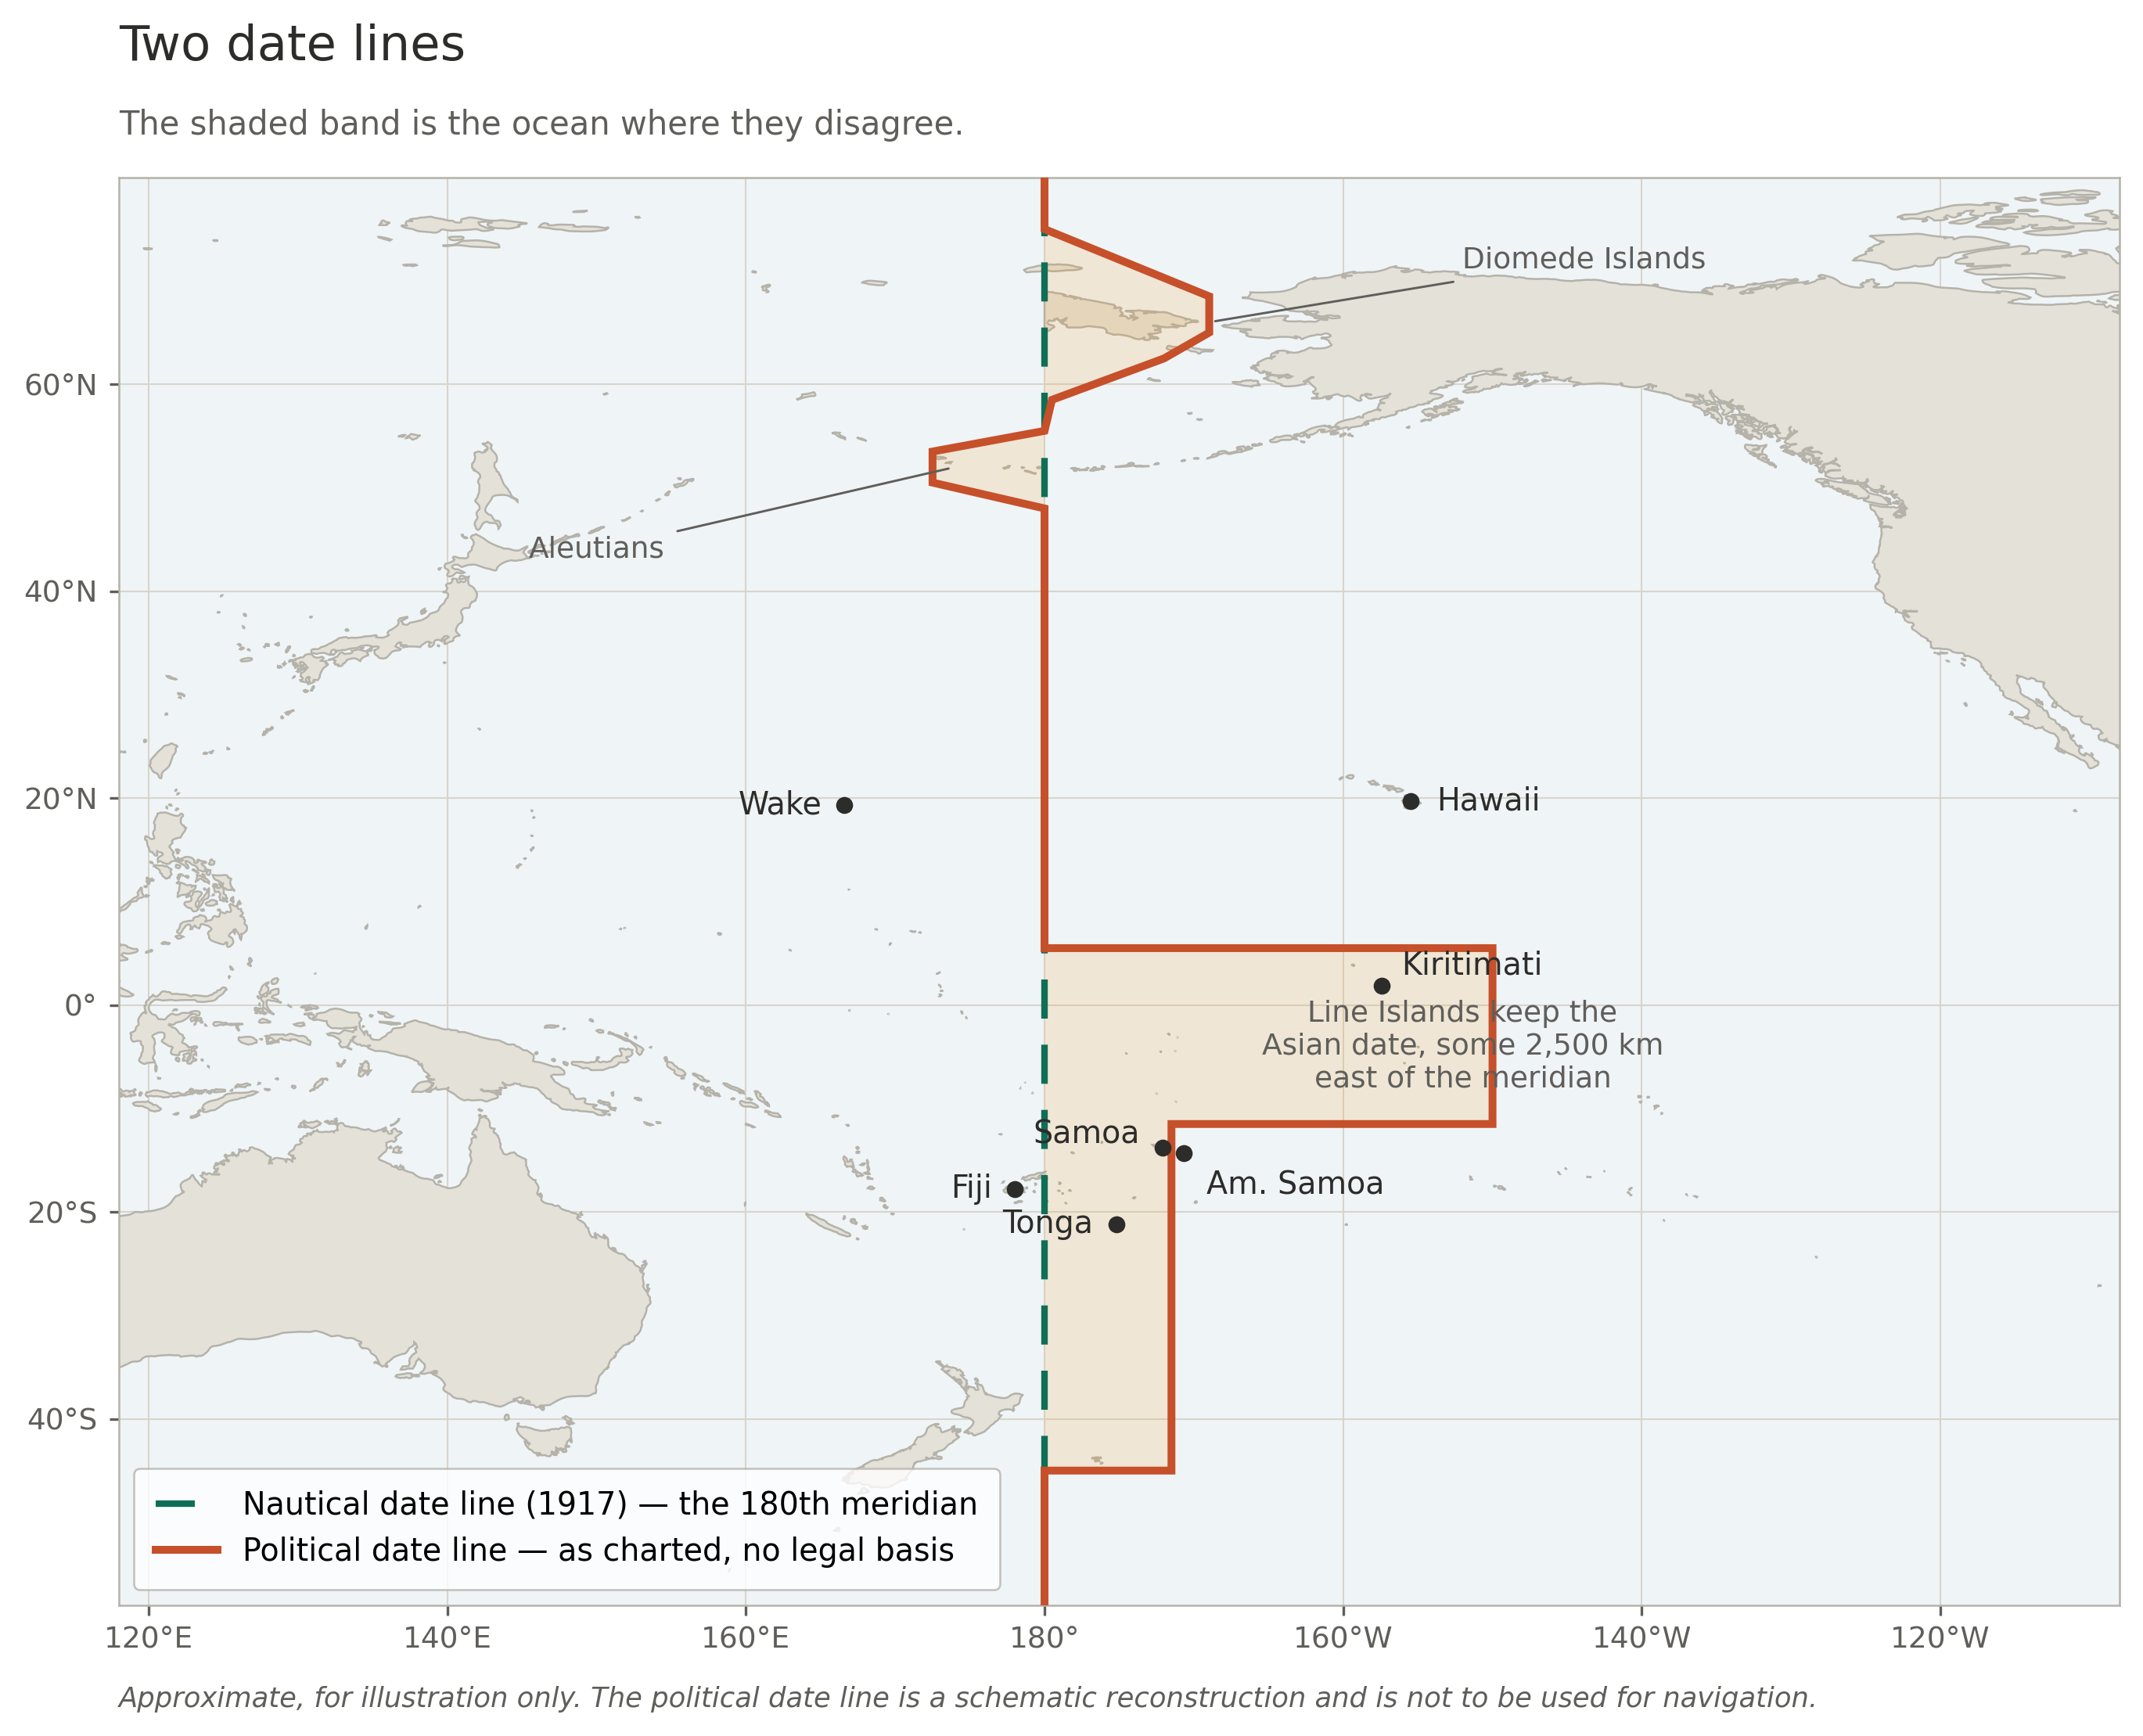
The nautical date line, the one ships were formally told to keep, sits on the 180th meridian: more than two thousand kilometers west of where Kiribati has put the political one.
By that reckoning, the water beneath the hull is still on Sunday.
Now go up to the bridge and ask the master.
He will tell you it is Monday, because he set the clocks and it is his call.
Three answers.
All three defensible.
And no authority on Earth manages it completely.
Two lines, and neither of them holds
The line you know is the zigzag, the one on every world map, jogging east around Kiribati and west around Samoa.
It has no world-wide legal standing at all.
No treaty defines it.
No organization maintains it.
It is a cartographic convention, a curve that chart and mapmakers draw by incorporating the time-zone decisions each Pacific state has made for itself.
When a country changes its mind, the line is redrawn.
That is the entire mechanism.
Cartographers do not fully agree on its precise course, and there is nobody to ask.
The second line is one most people have never heard of.
In June 1917 the Anglo-French Conference on Time-keeping at Sea met in London.
The British Admiralty and the French Navy established a nautical date line, with an idealized system of time zones for use at sea.
The major fleets adopted the recommendation between 1920 and 1925.
Their decision was a recommendation.
Two navies in a room, not a treaty.
Bowditch’s American Practical Navigator, one of the standard references still issued to navigators today, describes the result plainly: a date line “fixed by informal agreement” is the driest possible way of admitting that no one signed anything binding.
States adopted it for their own fleets, which makes it national regulation rather than international law.
And in practice, nautical time is now used chiefly for radio coordination.
What time it is aboard a ship, for watches, for meals, for the clocks the crew actually live by, is set by the master, who advances them when he judges it convenient, and on short passages frequently does not bother at all.
So the nautical date line was never repealed.
It still appears in the reference works.
It still disagrees violently with the line on the map.
And it is honored mainly in the breach.
That is not a footnote to my argument.
That is my argument.
A standard nobody can enforce, reconcile, or retire
Look at what we actually have.
A maritime standard, established by international agreement, adopted by the world’s navies, still on the books after a century, which has drifted thousands of kilometers out of alignment with the boundary everyone else uses, and which has quietly stopped being observed.
Nobody enforces it.
Nobody has reconciled it with the political line.
And nobody has the standing to formally retire it either, because no body owns it.
A hundred years is a long time for an international standard to sit in that condition.
The reason it has been possible is not that the problem was solved.
It is that a workaround was found.
The workaround is UTC and it is not a solution
Here is the objection any maritime lawyer will raise, and it is a fair one: none of this is a problem, because everything with real legal weight is timestamped in Coordinated Universal Time (UTC).
Zulu time has no date line, no zigzag and no ambiguity.
Log entries, position reports, distress traffic, contract timestamps put them all in UTC and the problem evaporates.
That is true.
It also explains why a century has passed without anyone fixing this.
We did not resolve the date line.
We routed around it.
But a workaround is not a custodian, and UTC does not touch what still depends on the line.
The depiction itself.
The date line appears on charts, in atlases, in reference works and in national statutes, and no authority stands behind any of it.
Cartographers reconcile it by watching the news.
Sovereign changes, made without notice.
In 1994 Kiribati deleted Saturday, 31 December from the calendar of its eastern islands, unifying a country that could otherwise conduct business with itself on only four days of the week.
In 2011 Samoa jumped westward to put its working week alongside Australia and New Zealand, and simply skipped 30 December, a date that legally does not exist there.
Tokelau followed.
Neither needed permission, because there was nobody to ask and no notice period to observe.
The world’s systems were patched afterwards.
Local dates in law and contract.
Statutes, charterparties and civil obligations run on calendar dates, not UTC timestamps.
A day that never happened is not a UTC problem.
Antarctica, where the line ceases to exist below roughly 60°S.
Stations keep whatever date their supply chain keeps.
McMurdo and Amundsen-Scott run on New Zealand time because the flights come out of Christchurch.
The one place on Earth where no state exercises sovereignty is the one place with no answer at all, which tells you exactly what has been holding this system together, and it is not law.
Who keeps the line now
The world’s operational date line, the one your phone, your airline and your bank actually consult, is the Internet Assigned Numbers Authority (IANA) Time Zone Database.
It is a set of text files.
It is curated by a community on a public mailing list, led by volunteer coordinators.
It has no formal governance structure, no voting mechanism, no corporate sponsor and no guaranteed funding.
Apple, Google, Microsoft and Amazon all depend on it.
This is not a criticism of that project, which has been maintained superbly for over forty years by people who have never received a fraction of what they are owed.
It is the point.
The tz database is a registry.
It records what sovereign states have already decided.
It has no standing to be consulted in advance, no power to request lead time, and no authority to decline an entry.
It is not a custodian.
It has simply been standing where a custodian ought to be, because nobody else was there.
The world’s operational date line, the one your phone, your airline and your bank actually consult, is the Internet Assigned Numbers Authority (IANA) Time Zone Database.
It is a set of text files.
It is curated by a community on a public mailing list, led by volunteer coordinators.
It has no formal governance structure, no voting mechanism, no corporate sponsor and no guaranteed funding.
Apple, Google, Microsoft and Amazon all depend on it.
This is not a criticism of that project, which has been maintained superbly for over forty years by people who have never received a fraction of what they are owed.
It is the point.
The tz database is a registry.
It records what sovereign states have already decided.
It has no standing to be consulted in advance, no power to request lead time, and no authority to decline an entry.
It is not a custodian.
It has simply been standing where a custodian ought to be, because nobody else was there.
The sovereignty objection, met directly
Propose that someone should own the date line and you will be told at once that this is an intolerable intrusion on sovereignty.
Samoa’s date is Samoa’s business.
It is.
Completely.
Any proposal that says otherwise deserves to fail.
But three things are being run together here and separating them dissolves the objection.
The date — which day it is in Apia.
Sovereign, full stop.
No international body should have any say in it whatsoever.
The line — the depicted boundary that results from summing all those sovereign choices.
Carried on charts.
Relied on in contracts.
Belonging to nobody.
The process — how a change is announced, how much warning the world gets, where the authoritative depiction lives, and what is to be done about a 1917 standard that no longer matches reality.
This does not exist at all.
A state may change its date.
It should not be able to change it by surprise, and it should not be drawing the line itself.
That is not a limit on sovereignty.
It is the same bargain every maritime state already accepts when it publishes a chart, files a notice to mariners, or registers a routing measure with the International Maritime Organization (IMO).
Who should hold it
There is no shortage of candidates, and each carries a liability worth stating plainly.
The International Hydrographic Organization (IHO) is a natural home.
The line is a charted feature, and charting standards is what the IHO does.
But its standard on the limits of oceans and seas, S-130, settles maritime limits.
It was never built to hold time.
Their current standard would either need to be adjusted, or a new IHO standard would need to be built.
The IMO has the only real regulatory power in this field and already administers routing measures that ships must obey.
But its remit is safety of navigation, and the date line might better be served by a standard that, once built, is recognized in IMO regulation.
The International Bureau of Weights and Measures (BIPM) and the General Conference on Weights and Measures own time itself and have lately proved they can settle a contested question by voting to abolish the leap second.
But they do timescales, not geography, and the date line is a spatial object.
The International Telecommunication Union (ITU) has a treaty basis and a long history with UTC.
It is itself mid-argument about the division of labor.
The International Organization for Standardization (ISO) is fast, pragmatic, and already owns the date-format standard.
It has no authority over states whatsoever.
IANA is the incumbent, with neither mandate nor appetite.
Any of these would improve on nothing.
But none is quite right, because none is accountable to the people the line actually runs through.
A body where Kiribati has a permanent seat
The states the date line physically traverses are Kiribati, Tuvalu, Fiji, Tonga, Samoa, Tokelau, Wallis and Futuna, a French overseas collectivity, New Zealand, Russia, and the United States.
Between them they hold very nearly every decision that has ever moved it.
They should have permanent seats.
Not as a courtesy, as a matter of standing.
They are not stakeholders in this question.
They are the primary parties, and the rest of us are downstream consumers of their decisions.
The design is not novel.
The Arctic Council seats Permanent Participants alongside its member states, on the principle that those with most at stake belong in the room regardless of their weight.
The Antarctic Treaty grants consultative status on the basis of substantial activity in the region rather than size.
A date-line body (which could be a working group of any of the above mentioned organizations) on that model would be small, cheap and technical.
It would maintain the authoritative depiction.
It would run a registry of sovereign date decisions with a published notification period.
It would reconcile the nautical and political lines or, at the very least, state plainly where they diverge, and formally retire what has died.
It would say something, at last, about Antarctica.
And it would be a body whose permanent seats are earned by standing in the line’s path, not by size or global reach, which is, I think, the most defensible allocation of authority in any international standards body I can name.
The day belongs to no one
The sea belongs to no one, and the same is true of the day.
Nobody owns Tuesday.
But belongs to no one and cared for by no one are not the same proposition, and the past century has quietly confused them.
A commons does not need an owner.
It needs a custodian, someone whose job is to write the thing down, keep it current, and tell the rest of us before it moves.
We never appointed one.
We found a workaround instead; the workaround held; the question was never forced.
Meanwhile the day still turns over somewhere out in the Pacific, at a place we have all agreed to imagine, on the authority of nobody in particular.
Thirteen miles off Kiritimati there are two published answers to what day it is, a hundred years of dust on one of them, and no one on Earth you can write to about it.
Links :
Thursday, July 16, 2026
Four Chinese icebreaking research vessels set off on Arctic expedition

One of the vessels, Tansuo-3, is equipped with a moon pool, allowing it
to deploy a crewed deep-sea submersible for scientific exploration of
the Arctic seabed.
The Xue Long is the oldest of China’s oceangoing
research icebreakers. Here at port in Shanghai.
Photo: Thomas Nilsen
From Arctic Today by Thomas Nilsen
China launched its 16th scientific expedition to the Arctic Ocean on 3 July, according to the Ministry of Natural Resources. This is the first time China sends four research ships on an Arctic expedition.
Three of the four vessels are icebreakers: Xuelong, Xuelong 2 and Jidi, whose names translate as Snow Dragon, Snow Dragon II and Polar.
Xuelong is well known in the European Arctic after taking part in numerous expeditions to the Barents Sea and the waters around Svalbard. Originally built as an Arctic cargo vessel at the Kherson shipyard in Ukraine, it was purchased by China in 1994 and later converted into a polar research vessel.
According to the Polar Research Institute of China (PRIC), the expedition will continue until October.
“This expedition will focus on addressing global climate change and its impacts, conducting comprehensive surveys and monitoring in key Arctic Ocean areas, covering sea ice, hydrology, biology, ecology, and atmospheric environment,” PRIC said in a joint statement with the Ministry of Natural Resources.

It was only one-year ice and its thickness was thin in the Atlantic sector of the Arctic when the Barents Observer was sailing north of Svalbard in the last week of June on board the Helmer Hanssen, a Norwegian research vessel operated by UiT – The Arctic University of Norway. Photo: Thomas Nilsen
“It will also explore cutting-edge international Arctic issues such as the accretion mechanism of the Gakkel Ridge and the dynamic evolution of ocean crust, and collaborate with scientists from Russia, Germany, and other countries to provide scientific support for my country and the international community to better understand and protect the Arctic and carry out Arctic governance.”
The Gakkel Ridge, also known as the Arctic Mid-Ocean Ridge, is a 1,800-kilometre-long underwater mountain range and divergent plate boundary in the Arctic Ocean.
It stretches from north of Greenland to the Laptev Sea off the Siberian coast.
Tansuo-3 (“Exploration-3”) will work alongside the three icebreakers during the expedition’s deep-sea exploration programme.
Tansuo-3 (“Exploration-3”) will work alongside the three icebreakers during the expedition’s deep-sea exploration programme.
Commissioned in December 2024, the multifunctional research vessel is designed to support full-ocean-depth scientific missions and carries the crewed deep-sea submersible Shenhai Yongshi (“Deep Sea Warrior”).
The submersible can be launched through the vessel’s moon pool, enabling scientific operations beneath Arctic sea ice in conditions where conventional deployment methods would be difficult or impossible.
The Tansuo-3 was also last summer sailing in Russian Arctic waters north of Siberia.
The submersible can be launched through the vessel’s moon pool, enabling scientific operations beneath Arctic sea ice in conditions where conventional deployment methods would be difficult or impossible.
The Tansuo-3 was also last summer sailing in Russian Arctic waters north of Siberia.
Wednesday, July 15, 2026
In a first, scientists observe creation of new seafloor

Île Saint-Paul, a tiny island in the Indian Ocean, some 120 miles southwest of the deep sea site where the Antarctica and Australia tectonic plates diverged during an earthquake in 2024.
Credit... Benoit Stichelbaut/Hemis, via Alamy
From NYTimes by K. R. Callaway
In 2024, a swarm of earthquakes in the Indian Ocean caused tectonic plates to abruptly separate, adding more than three feet of new seafloor in a single event.
For the first time ever, scientists had instruments in place to observe the process as it happened, deployed just two months before the earthquakes struck.
The findings, published earlier this week, offer the most detailed look yet at how Earth recycles its own crust.
The spread of the ocean floor, as tectonic plates spread apart, is known but hard to observe.
Scientists have now documented the process in action.
Far down on the ocean floor, Earth is recycling its own skin.
At certain boundaries, the huge plates of rock that make up the planet’s crust crash into or over each other, pushing old crust below.
At other junctures, these tectonic plates are spreading apart, allowing magma to bubble up and create entirely new stretches of seafloor.
But the process is subtle and difficult to catch in action.
Typically, the seafloor only adds a few inches of new ground per year, unless prompted by sudden, unpredictable earthquakes and other large-scale interactions of the tectonic plates.
In 2024, however, researchers were able to observe for the first time a large-scale seafloor spreading event, in which a series of earthquakes abruptly added more than three feet of new seafloor to the Indian Ocean.
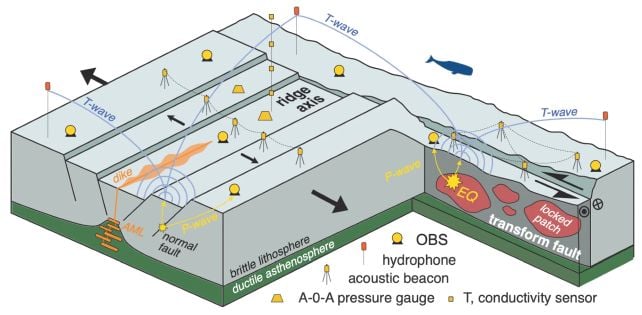
A schematic drawing of the complete observatory in early 2025. (J.-A. Olive (LG-ENS) & J.-Y. Royer (Geo-Ocean), OHA-GEODAMS/Bluesky)
Their findings, described in a study published on Wednesday in the journal Nature, offer a look at one of Earth’s most elusive processes.
“We have been very lucky to have had all these instruments set up when it happened,” said Jean-Yves Royer, a marine geophysicist and lead author of the study.
“But also we are lucky because these big piles of lava outpoured one or two kilometers away from our instruments, so we didn’t lose any data.”
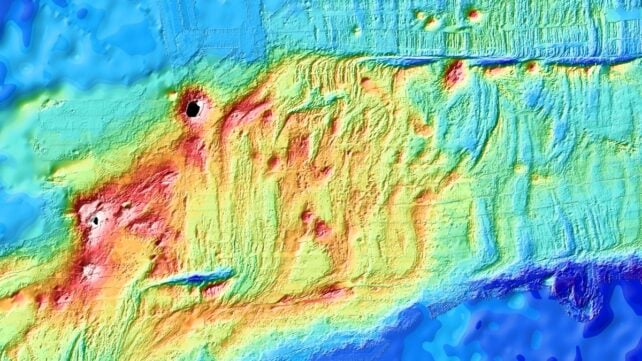 Bathymetry of the seafloor around the Southeast Indian Rift where two tectonic plates abruptly opened a portal to the magmatic underworld in April 2024. (Royer et al., Nature, 2026)
Dr. Royer and his colleagues had only recently begun a three-year experiment along the ridge between two of the Indian Ocean’s tectonic plates.
The observatory they used, called OHA-GEODAMS, was made up of 15 monitoring stations that could sense sound waves traveling through the ocean from earthquakes and other geophysical changes at the seafloor.
By good fortune, it was deployed just two months before the swarm of earthquakes in 2024.
The movement of Earth’s tectonic plates is noisy.
The observatory they used, called OHA-GEODAMS, was made up of 15 monitoring stations that could sense sound waves traveling through the ocean from earthquakes and other geophysical changes at the seafloor.
By good fortune, it was deployed just two months before the swarm of earthquakes in 2024.
The movement of Earth’s tectonic plates is noisy.

A map of the world showing the tectonic plates and a mid-ocean ridge down the middle of the Atlantic Ocean. NOAA
The observatory detected not only the low-frequency rumblings of rocks but also the precise details of the motion: Part of the ridge collapsed by about 13 feet, and its two sides separated by more than three feet.
“It’s quite difficult, and perhaps rare, to make these measurements,” said Aaron Micallef, a marine geoscientist who was not involved in the new study.
“We know so little about what’s going on in these settings that we’re not even really sure of what measurements we need to carry out, so that’s why it’s very useful to throw all the instruments that you have at the problem, as these researchers have done.”
Using underwater microphones, pressure sensors and other instruments, the researchers were able to dissect the process of seafloor spreading in more detail than previous indirect observations had allowed.
The process, they determined, begins with high-pressure pockets of melted magma deep within Earth.
Eventually, the pressure builds enough to propel magma between the layers of rock in the crust, and the earth above the former pocket collapses inward.
Earthquakes spawned by the movement of magma wrench the tectonic plates apart, allowing magma to bubble up to the seafloor and form a new, rocky stretch of ocean bottom.
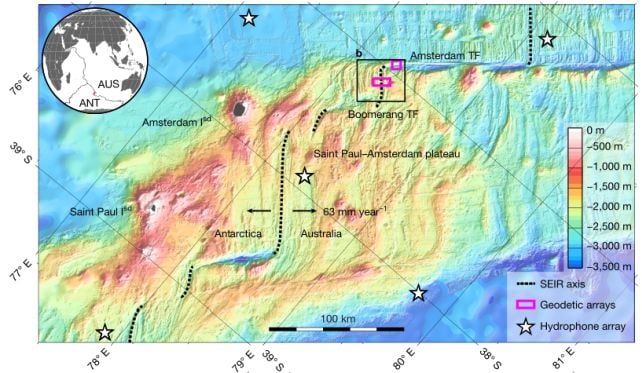
The tectonic setting of the observed seafloor spreading event. (Royer et al., Nature, 2026)
“Where the authors put their instruments may have spread the last time several decades ago, and now they’ve sampled a spreading event just two months after the deployment of their equipment,” he said.
“Jean-Yves Royer and co-workers were very, very, very lucky — like, getting the jackpot.”
Installing the underwater observatory and gathering data from it entailed a minor expedition.
The researchers had to travel 45 days by ship to deposit the sensors and other equipment, and they return annually to collect the data.
“You can’t just drive your car to the site, and you can’t just take an airplane to the site,” said Daniel Fornari, a marine geologist at the Woods Hole Oceanographic Institution who was not involved in the new study.
“Doing something at the bottom of the ocean requires clever engineering and expertise.”
The instruments are now back on the seafloor, where the equipment will continue to gather data on Earth’s movement until 2027.
Dr. Royer said he hoped the work would inspire other scientists to conduct similar measurements where the seafloor is known to spread quicker than average.
“This was a good demonstration that it’s possible to measure with a bit of luck and also a bit of flair,” he said.
Links :
- ScienceAlert : World First: Scientists Witnessed a Piece of Earth's Oceanic Crust Being Born
- NYPost : Scientists discover new seafloor being born — for the first time in history: ‘Massive event’
- Interesting Engineering : In a global first, scientists observe the formation of Earth’s crust in the ocean
Tuesday, July 14, 2026
Russia’s UAV campaign over Europe

The drone is the last link in the chain.
The vessel is the first.
IISS published a report last week assessing that the Kremlin ran a coordinated UAV campaign over Europe between 2024 and 2026, and that shadow fleet vessels were likely used as launch and recovery platforms in international waters.
IISS published a report last week assessing that the Kremlin ran a coordinated UAV campaign over Europe between 2024 and 2026, and that shadow fleet vessels were likely used as launch and recovery platforms in international waters.
From IISS by Charlie Edwards, Red Fox O'Loughlin & Louis Bearn
Russia’s UAV campaign over Europe, likely enabled by shadow-fleet vessels operating in international waters, exposed critical gaps in allied air defences, legal authority and political cohesion, revealing that the threshold for collective response is higher than European deterrence has assumed.
Between August 2024 and February 2026, Uninhabited Aerial Vehicles (UAVs) were flown in the airspace of a dozen NATO member states and Ireland, forcing repeated closures of major commercial aviation hubs, disrupting military operations and penetrating the perimeters of some of Europe’s most sensitive defence installations – among them nuclear-sharing sites hosting American B61-12 gravity bombs and France’s ballistic-missile submarine base at Île Longue.
This report assesses it is highly likely that the Kremlin conducted a UAV campaign over Europe.
We assess it is likely that Russian-linked vessels and the ‘shadow fleet’ were used as launch/recovery platforms for UAVs as part of the Kremlin’s wider unconventional war on Europe.
The UAV campaign (largely in the latter part of 2025) operated with substantial impunity across European airspace – representing both a series of tactical successes for the Kremlin and a strategic failure of allied air defence.
The Kremlin’s success rests on a basic strategic insight: Europe’s air-defence architecture was designed to detect and defeat conventional air threats operating in a recognisable battlespace.
It was not built for, by comparison, relatively low-cost UAVs and deniable incursions with the aim of exposing gaps in detection, decision-making and legal authority – all while remaining below the threshold of a collective allied response.

One finding stands out.
Europe's flagship counter-drone initiative only has a mandate over the drone once it enters European airspace.
Nobody owns the vessel that launched it.
That is the gap maritime intelligence exists to close.
A shadow fleet vessel does not appear out of nowhere.
That is the gap maritime intelligence exists to close.
A shadow fleet vessel does not appear out of nowhere.
It loiters.
It goes dark.
It deviates from its commercial baseline.
It goes dark.
It deviates from its commercial baseline.
It positions itself near infrastructure or under flight corridors days before anything flies.
These are detectable behaviours, and they are detectable before launch, not after.
Counter-UAV starts at sea.
If you wait until radar picks up the drone, you have already lost the initiative.
Read the IISS report.
Then ask who is watching the vessels.
Counter-UAV starts at sea.
If you wait until radar picks up the drone, you have already lost the initiative.
Read the IISS report.
Then ask who is watching the vessels.
Our argument is not that every reported sighting was Russian-directed, or that every reported sighting involved a UAV, but that the aggregate pattern of UAV sightings cannot be adequately explained by misidentification, hobbyist activity or opportunistic harassment alone.
Attribution remains a key challenge for European governments, and none have, to date, publicly attributed a UAV sighting to Russia or gone as far as to describe a coordinated Russian UAV campaign over Western and Northern Europe.
One reason, European officials have suggested to us as part of our research, is that the relevant governments focused on the national response rather than connecting the dots across Europe.
Open-source reporting of each incident in the IISS dataset suggests the Kremlin’s campaign exposed political fractures within the Alliance, as well as exploiting the gap between what European militaries could do and what their governments were prepared to authorise.
And the campaign demonstrated, repeatedly and in public, that the threshold for collective punishment was higher than European deterrence postures have previously assumed.
The campaign likely had a number of aims, including:
Attribution remains a key challenge for European governments, and none have, to date, publicly attributed a UAV sighting to Russia or gone as far as to describe a coordinated Russian UAV campaign over Western and Northern Europe.
One reason, European officials have suggested to us as part of our research, is that the relevant governments focused on the national response rather than connecting the dots across Europe.
Open-source reporting of each incident in the IISS dataset suggests the Kremlin’s campaign exposed political fractures within the Alliance, as well as exploiting the gap between what European militaries could do and what their governments were prepared to authorise.
And the campaign demonstrated, repeatedly and in public, that the threshold for collective punishment was higher than European deterrence postures have previously assumed.
The campaign likely had a number of aims, including:
- probing the response times and decision-making thresholds of allied air defence and civil-military command structures; mapping vulnerabilities around critical infrastructure, including dual-use civilian hubs, military logistics nodes supporting Ukraine, and facilities associated with allied nuclear deterrence;
- imposing economic and psychological costs on European societies through the disruption of civilian aviation and public confidence in airspace security; and
- normalising low-level airspace violations below the threshold of a direct allied military response.
Our key judgement is that Europe’s current counter-UAV architecture does not yet match the threat despite NATO, the European Union and national governments focusing more attention on the issue: detection is uneven, legal authorities are fragmented, response options are often disproportionate and attribution remains too slow to support timely deterrence.
The Kremlin’s tactical successes in exploiting European air-defence vulnerabilities also revealed the limits of Russia’s intelligence-collection options.
The Kremlin has been forced to find a series of workarounds since large numbers of Russian intelligence officers were expelled from European capitals in 2022, reducing the Kremlin’s intelligence infrastructure in Europe.
The UAV campaign also exposed gaps in Russia’s Earth imaging and reconnaissance capacity, especially when Russia’s UAV Campaign Over Europe 5 compared with the combined military and commercial space support available to Ukraine and NATO states.
Europe’s most ambitious collective response, the European Drone Defence Initiative (EDDI), aims to build a continent-wide, 360-degree counter-drone architecture, with initial operational capability by the end of 2026.
Yet the European Parliament concluded in January 2026 that the EDDI lacked the agility and doctrinal coherence required to deliver scalable results.
Critically, even a fully operational EDDI will only target the UAV once it enters European airspace – there is no mandate over the vessel that launched it.
The Kremlin’s tactical successes in exploiting European air-defence vulnerabilities also revealed the limits of Russia’s intelligence-collection options.
The Kremlin has been forced to find a series of workarounds since large numbers of Russian intelligence officers were expelled from European capitals in 2022, reducing the Kremlin’s intelligence infrastructure in Europe.
The UAV campaign also exposed gaps in Russia’s Earth imaging and reconnaissance capacity, especially when Russia’s UAV Campaign Over Europe 5 compared with the combined military and commercial space support available to Ukraine and NATO states.
Europe’s most ambitious collective response, the European Drone Defence Initiative (EDDI), aims to build a continent-wide, 360-degree counter-drone architecture, with initial operational capability by the end of 2026.
Yet the European Parliament concluded in January 2026 that the EDDI lacked the agility and doctrinal coherence required to deliver scalable results.
Critically, even a fully operational EDDI will only target the UAV once it enters European airspace – there is no mandate over the vessel that launched it.
Monday, July 13, 2026
Optimal Transit unveils self-powered vessel-based AI data centre

Optimal Transit Unveils Kraaken™: The World’s First Self-Powered Maritime AI Infrastructure Platform with CAPEX & OPEX Costs at a Fraction of Conventional Land-Based Facilities.
From SmartMaritimeNetwork by Rob O'Dwyer
Optimal Transit has unveiled Kraaken, a family of standardised self-powered maritime AI data centre platforms engineered to eliminate dependence on land, the electrical grid, freshwater cooling and conventional fuel.
Kraaken generates its own continuous electrical power by combining the thermal energy naturally stored in the ocean with waste heat produced by the data centre itself.
Through the company’s multi-stage Digital Ocean Thermal (DOT) engine, waste heat that would otherwise be rejected is transformed into an energy source.
This is combined with cold ocean water for cooling.
The system is designed for continuous operation 365 days per year in marine environments ranging from equatorial waters to Arctic regions without requiring conventional fuel deliveries.
The platforms are built upon Small Waterplane Area Twin Hull (SWATH) vessel technology to provide stability for hyperscale computing while supporting continuous high-bandwidth optical and satellite communications.
The modular platforms can operate either permanently moored offshore or independently at sea.
If severe weather threatens, a platform can disconnect from its mooring and relocate under its own propulsion at speeds approaching 30 kilometres per hour.
“Artificial intelligence is creating unprecedented demand for power, water and land,” said Scott Myers, President of Optimal Transit.
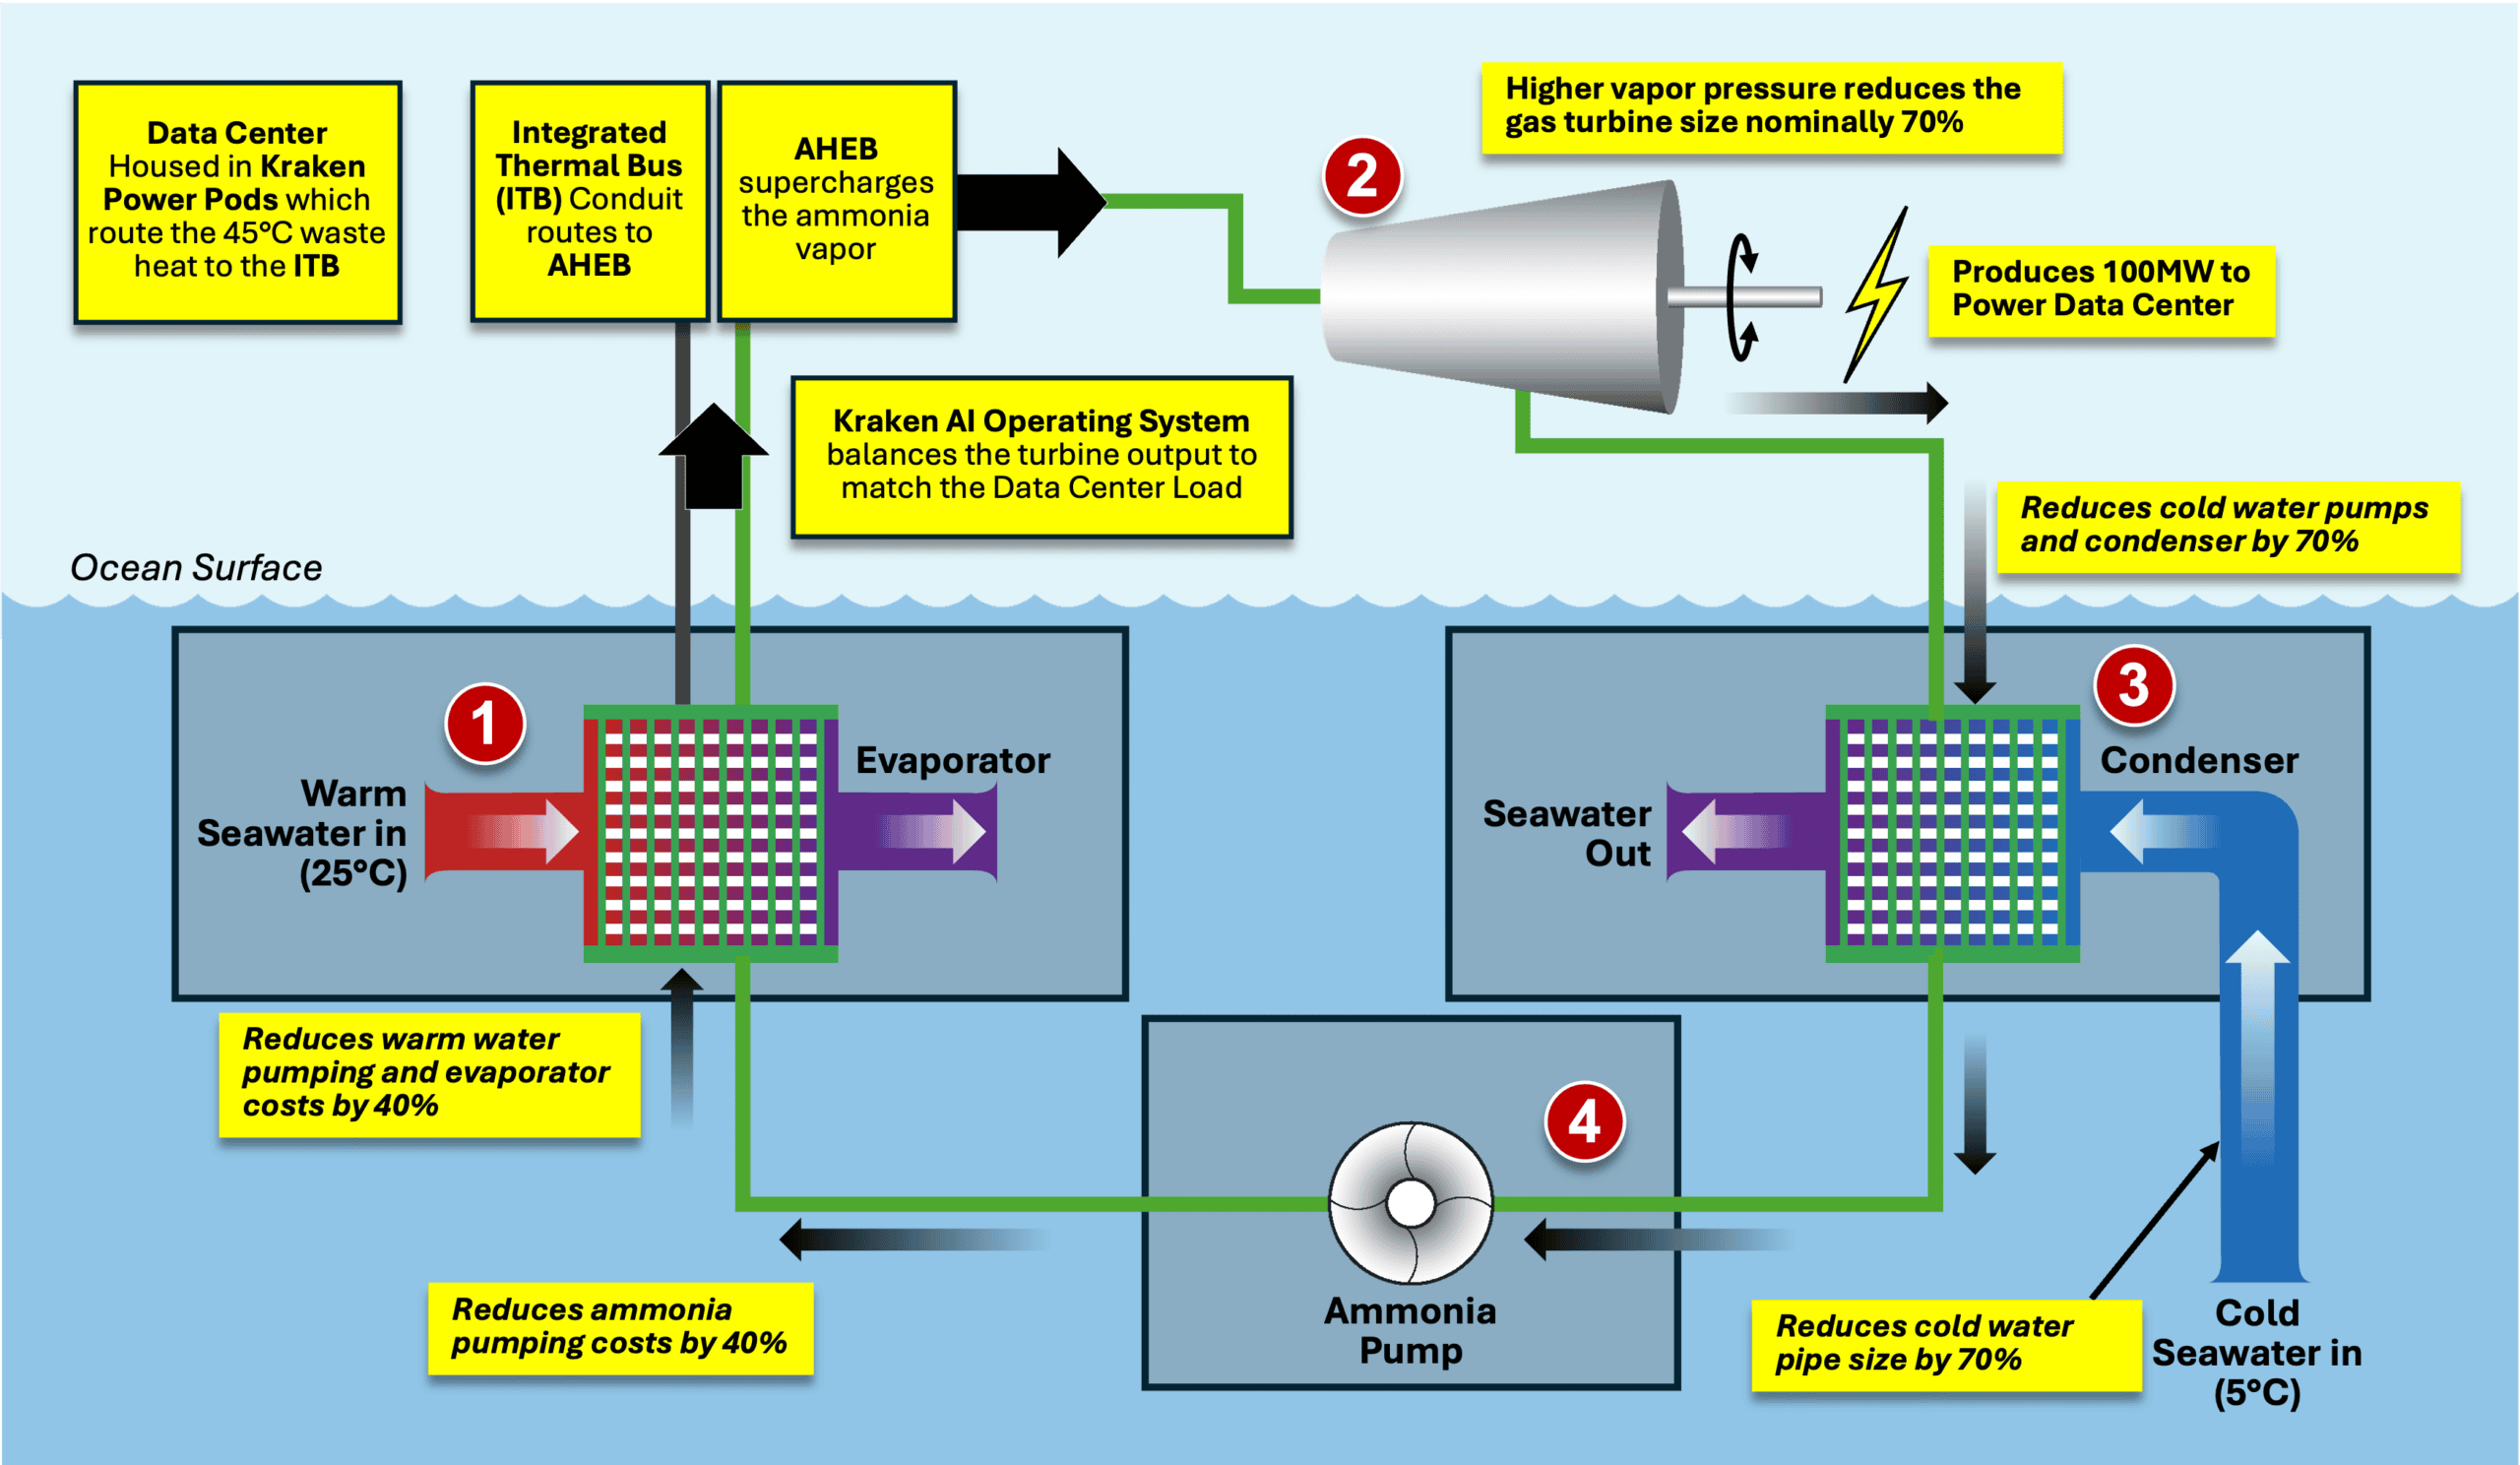
Optimal Transit’s Patented Digital Ocean Thermal (DOT) Engine Technology Uses COTS Components to Generate 100MW of Continuous 365-day/24-hour Electricity
“Our innovation is not dependent on new scientific breakthroughs – it’s built on integrating commercially proven technologies into a standardised platform.”
Optimal Transit estimates that the infrastructure cost of a standardised 100 MW Kraaken platform, excluding computing hardware, is less than US$500 million, with projected annual operating expenses of US$10 million to US$20 million.
The product family is designed around standardised modular platforms optimised for different computing missions.
The 10/20 MW Kraaken is a 76.2-metre, 10,160-ton vessel configured for edge computing, cloud applications and regional AI processing.
The flagship 50/100 MW Kraaken is a 91.4-metre, 50,802-ton vessel optimised for hyperscale AI training and large language model applications.
Over the next nine months, proceeds from the company’s ongoing Series A financing are expected to fund the completion of American Bureau of Shipping (ABS)-ready engineering drawings for the 20 MW and 100 MW platforms, together with digital twin validation of the DOT engine.
Subject to the completion of a planned Series B financing in 2027, the company intends to establish standardised production capable of delivering up to 20 Kraaken 100 MW platforms annually through shipyards worldwide, with each platform representing approximately US$400 million in infrastructure value.
Sunday, July 12, 2026
Beneath the seas: the adventure of marine cartography

The Brest harbor and its surroundings in 1820, with numerous measurements taken one by one to determine the depth at each point. | SHOM
From Ouest France by Angellina Thieblemont
“Some Maps Remain ‘Classified’”:
The History of Nautical Charts Told at the Brest Naval Museum
The exhibition at the Brest Naval Museum, “Beneath the Seas: The Adventure of Marine Cartography,” opens on June 26.
The exhibition at the Brest Naval Museum, “Beneath the Seas: The Adventure of Marine Cartography,” opens on June 26.
It traces the evolution of this practice over the past 500 years, as well as its military, archaeological, and economic uses—aspects largely unknown to the general public.
Stories of shipwrecks lost in Brest Harbor (Finistère), British blockades of the port, and maps classified as “defense secrets”…
Stories of shipwrecks lost in Brest Harbor (Finistère), British blockades of the port, and maps classified as “defense secrets”…
All these stories have one thing in common: they chronicle the development of underwater cartography in the new major exhibition at the Brest Naval Museum (Finistère), which opens on June 26, 2026.
Brest, home to the world’s oldest underwater mapping service
To mark the 400th anniversary of the French Navy, an exhibition on “The Call of the Deep” is being held in Paris, Toulon, Port-Louis, Rochefort, and Brest.
To mark the 400th anniversary of the French Navy, an exhibition on “The Call of the Deep” is being held in Paris, Toulon, Port-Louis, Rochefort, and Brest.
Each location of the National Maritime Museum explores a different aspect of this exploration of the ocean depths.
In Brest, the focus is on the history of marine cartography, from the 16th century to the present day.
It is no coincidence that this theme was assigned to the “City of the Ponant”: since 1971, Brest’s Bergot district has been home to the Navy’s Hydrographic and Oceanographic Service (SHOM).
Founded in 1720, it is the oldest marine mapping service in the world.

A rare document depicting the Crozon Peninsula, Pointe Saint-Mathieu, and the Brest harbor, known as “Baye de Breft.” | NATIONAL MARITIME MUSEUM
In two rooms, shielded from the heat wave by the fort’s thick walls, the exhibition explains why and how nautical charts have been made since the 16th century. Among the hundred or so works on display are period maps featuring drawings of the monsters believed to lurk beneath the sea’s surface, as well as parchments, paintings, models, and a full-scale replica of a chart room complete with period tools…
Visitors also learn about the story of Charles-François Beautemps-Beaupré, the father of modern hydrography. In the 19th century, this pioneer set out to survey the coast of Brest. It was one of the first seabeds in the world to be mapped. On one of his maps, thousands of numbers are scattered across a drawing of the harbor. They give a sense of the titanic undertaking: for each point, a rope with a lead weight was lowered from their small boat and used as a sounding line.
Visitors also learn about the story of Charles-François Beautemps-Beaupré, the father of modern hydrography. In the 19th century, this pioneer set out to survey the coast of Brest. It was one of the first seabeds in the world to be mapped. On one of his maps, thousands of numbers are scattered across a drawing of the harbor. They give a sense of the titanic undertaking: for each point, a rope with a lead weight was lowered from their small boat and used as a sounding line.

A map of the Mediterranean and the eastern Atlantic, 1537. This map was painted on parchment by Vesconte de Maggiolo (1457–1530). | NATIONAL MARITIME MUSEUM
Deliberately Falsifying Maps
The exhibition features several thematic sections, highlighting the many fields in which hydrography is useful, particularly in archaeology and the installation of internet cables.
The exhibition features several thematic sections, highlighting the many fields in which hydrography is useful, particularly in archaeology and the installation of internet cables.
Brest. Me, the mayor...
But since the 16th century, this science has been most widely used in the field of defense: mapping sandbars to avoid running aground during battles, creating false maps that omit hazards to trap opponents…
Such was the case with the Rocher de la Rose, an obstacle that loomed at the entrance to the Penfeld channel until the 19th century and was blown up by divers.
It was deliberately omitted from maps in order to cause enemy ships to run aground.
Visitors can also view one of the maps of the Normandy beaches that was used to prepare for the 1944 D-Day landings.

The 1842 painting *Combat du Grand Port* depicts a battle in which a British ship is defeated and runs aground on sandbars, while the French ships—which benefit from highly accurate nautical charts—escape unscathed. | NATIONAL MARITIME MUSEUM/A. FUX
Only 26% of the ocean floor will be mapped by 2026
Today, some maps are classified as defense secrets because of their quality and accuracy.
Today, some maps are classified as defense secrets because of their quality and accuracy.
“Accuracy is a weapon,” explains Jean-Yves Besselièvre, director of the National Maritime Museum. Since the 16th century, only 26% of the planet’s ocean floor has been mapped.
“We’ve mapped the surface of the moon better than we’ve mapped the ocean depths,” says Jean-Yves Besselièvre.
Titled “Beneath the Seas: The Adventure of Underwater Cartography,” the exhibition runs through March 2027.
Titled “Beneath the Seas: The Adventure of Underwater Cartography,” the exhibition runs through March 2027.
A family guidebook has been created for children.
It allows them to explore the exhibition in a fun way by inviting them to conduct a mini-investigation.
Subscribe to:
Posts (Atom)