This aerial photograph shows fast-moving meltwater rivers flowing across
the Greenland Ice Sheet, a region that, combined with Antarctic
meltwater and thermal expansion, accounts for two-thirds of observed
global mean sea level rise.
Credits: NASA
From NASA by Ian J. O'Neill / Jane J.Lee
Scientists have gained new insights into the processes that have driven ocean level variations for over a century, helping us prepare for the rising seas of the future.
To make better predictions about the future impacts of sea level rise, new techniques are being developed to fill gaps in the historic record of sea level measurements.
We know the factors that play a role in sea level rise: Melting glaciers and ice sheets add water to the seas, and warmer temperatures cause water to expand.
Other factors are known to slow the rise, such as dams impounding water on the land, stymying its flow into the sea.
When each factor is added together, this estimate should match the sea level that scientists observe.
Until now, however, the sea level "budget" has fallen short of the observed sea level rise, leading scientists to question why the budget wouldn't balance.
A new study published on Aug.19 seeks to balance this budget.
By gaining new insights to historic measurements, scientists can better forecast how each of these factors will affect sea level rise and how this rise will impact us in the future.
For example, in its recent
flooding report, the National Oceanic and Atmospheric Administration (NOAA) noted a rapid increase in sea level rise-related flooding events along U.S. coasts over the last 20 years, and they are expected to grow in extent, frequency, and depth as sea levels continue to rise.
Factors Driving Our Rising Seas
On reexamining each of the known contributors to sea level rise from 1900 to 2018, the research, led by NASA's Jet Propulsion Laboratory in Southern California, uses improved estimates and applies satellite data to better understand historic measurements.
This infographic shows the rise in sea levels since 1900.
Pre-1940, glaciers and Greenland meltwater dominated the rise; dam projects slowed the rise in the 1970s.
Now, ice sheet and glacier melt, plus thermal expansion, dominate the rise.
Tide-gauge data shown in blue and satellite data in orange.
Credits: NASA/JPL-Caltech
The researchers found that estimates of global sea level variations based on tide-gauge observations had slightly overestimated global sea levels before the 1970s.
(Located at coastal stations scattered around the globe, tide gauges are used to measure sea level height.) They also found that mountain glacier meltwater was adding more water to the oceans than previously realized but that the relative contribution of glaciers to sea level rise is slowly decreasing.
And they discovered that glacier and Greenland ice sheet mass loss explain the increased rate of sea level rise before 1940.
In addition, the new study found that during the 1970s, when dam construction was at its peak, sea level rise slowed to a crawl.
Dams create reservoirs that can impound freshwater that would normally flow straight into the sea.
"That was one of the biggest surprises for me," said lead researcher Thomas Frederikse, a postdoctoral fellow at JPL, referring to the peak in global dam projects at that time.
"We impounded so much freshwater, humanity nearly brought sea level rise to a halt."
Since the 1990s, however, Greenland and Antarctic ice sheet mass loss and thermal expansion have accelerated sea level rise, while freshwater impoundment has decreased.
As our climate continues to warm, the majority of this thermal energy is absorbed by the oceans, causing the volume of the water to expand.
In fact, ice sheet melt and thermal expansion now account for about two-thirds of observed global mean sea level rise.
Mountain glacier meltwater currently contributes another 20%, while declining freshwater water storage on land adds the remaining 10%.
All told, sea levels have risen on average 1.6 millimeters (0.063 inches) per year between 1900 and 2018.
In fact, sea levels are rising at a faster rate than at any time in the 20th century.
But previous estimates of the mass of melting ice and thermal expansion of the ocean fell short of explaining this rate, particularly before the era of precise satellite observations of the world's oceans, creating a deficit in the historic sea level budget.
Ice shelves in Antarctica, such as the Getz Ice
Shelf seen here, are sensitive to warming ocean temperatures.
Ocean and
atmospheric conditions are some of the drivers of ice sheet loss that
scientists considered in a new study estimating additional global sea
level rise by 2100.
Credits: Jeremy Harbeck/NASA
Finding a Balance
In simple terms, the sea level budget should balance if the known factors are accurately estimated and added together.
It's a bit like balancing the transactions in your bank account: Added together, all the transactions in your statement should match the total.
If they don't, you may have overlooked a transaction or two.
The same logic can be applied to the sea level budget: When each factor that affects sea level is added together, this estimate should match the sea level that scientists observe.
Until now, however, the sea level budget has fallen short of the observed sea level rise.
"That was a problem," said Frederikse.
"How could we trust projections of future sea level change without fully understanding what factors are driving the changes that we have seen in the past?"
Frederikse led an international team of scientists to develop a state-of-the-art framework that pulls together the advances in each area of study – from sea level models to satellite observations – to improve our understanding of the factors affecting sea level rise for the past 120 years.
The latest satellite observations came from the pair of NASA – German Aerospace Center (DLR) Gravity Recovery and Climate Experiment (
GRACE) satellites that operated from 2002-2017, and their successor pair, the NASA – German Research Centre for Geosciences (GFZ)
GRACE Follow-On (launched in 2018).
Additional data from the series of TOPEX/Jason satellites – a joint effort of NASA and the French space agency Centre National d'Etudes Spatiales – that have operated continuously since 1992 were included in the analysis to enhance tide-gauge data.
"Tide-gauge data was the primary way to measure sea level before 1992, but sea level change isn't uniform around the globe, so there were uncertainties in the historic estimates," said Sönke Dangendorf, an assistant professor of oceanography at Old Dominion University in Norfolk, Virginia, and a coauthor of the study.
"Also, measuring each of the factors that contribute to global mean sea levels was very difficult, so it was hard to gain an accurate picture."
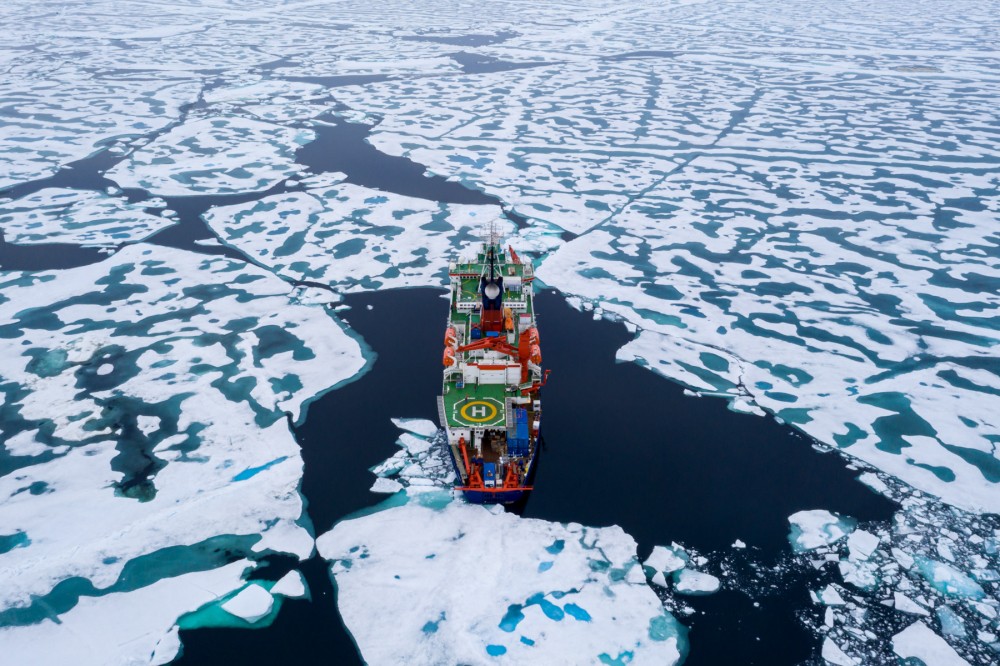
The sea ice is surprisingly weak, has lots of melt ponds, and the
expedition ship Polarstern was able to easily break through.
Photo:
Steffen Graupnerice / MOSAiC
But over the past two decades, scientists have been "flooded" with satellite data, added Dangendorf, which has helped them precisely track the physical processes that affect sea levels.
For example, GRACE and GRACE-FO measurements have accurately tracked global water mass changes, melting glaciers, ice sheets, and how much water is stored on land.
Other satellite observations have tracked how regional ocean salinity changes and thermal expansion affect some parts of the world more than others.
Up-and-down movements of Earth's crust influence the regional and global levels of the oceans as well, so these aspects were included in the team's analysis.
"With the GRACE and GRACE-FO data we can effectively back-extrapolate the relationship between these observations and how much sea level rises at a particular place," said Felix Landerer, project scientist at JPL for GRACE-FO and a coauthor of the study.
"All observations together give us a pretty accurate idea of what contributed to sea level change since 1900, and by how much."
The study, titled "The Causes of Sea Level Rise Since 1900," was published Aug. 19 in Nature.
In addition to scientists from JPL and Old Dominion University, the project involved researchers from Caltech, Université Catholique de Louvain in Belgium, University of Siegen in Germany, the National Oceanography Centre in the United Kingdom, Courant Institute in New York, Chinese Academy of Sciences, and Academia Sinica in Taiwan.
JPL managed the GRACE mission and manages the GRACE-FO mission for NASA's Earth Science Division of the Science Mission Directorate at NASA Headquarters in Washington.
Based on Pasadena, California, Caltech manages JPL for NASA.
Links :
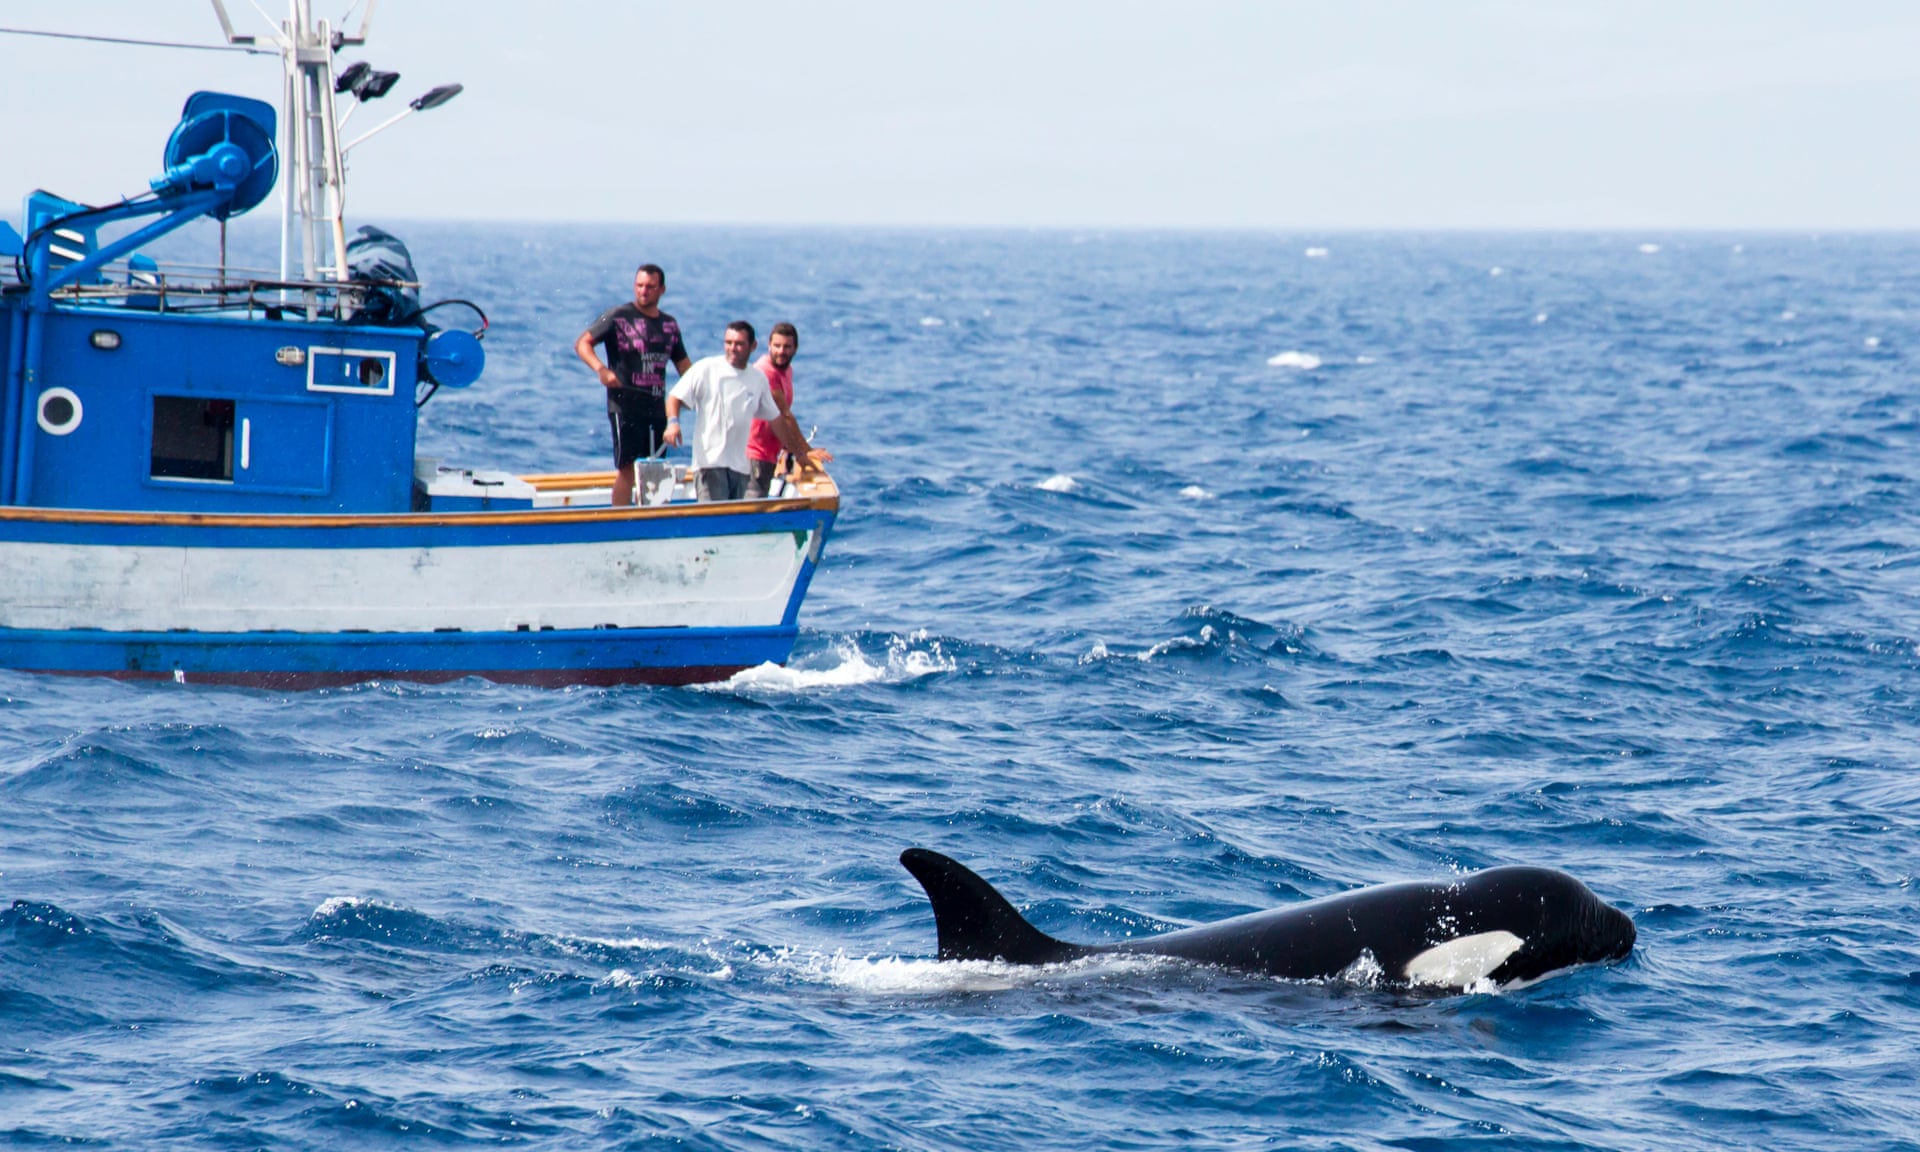
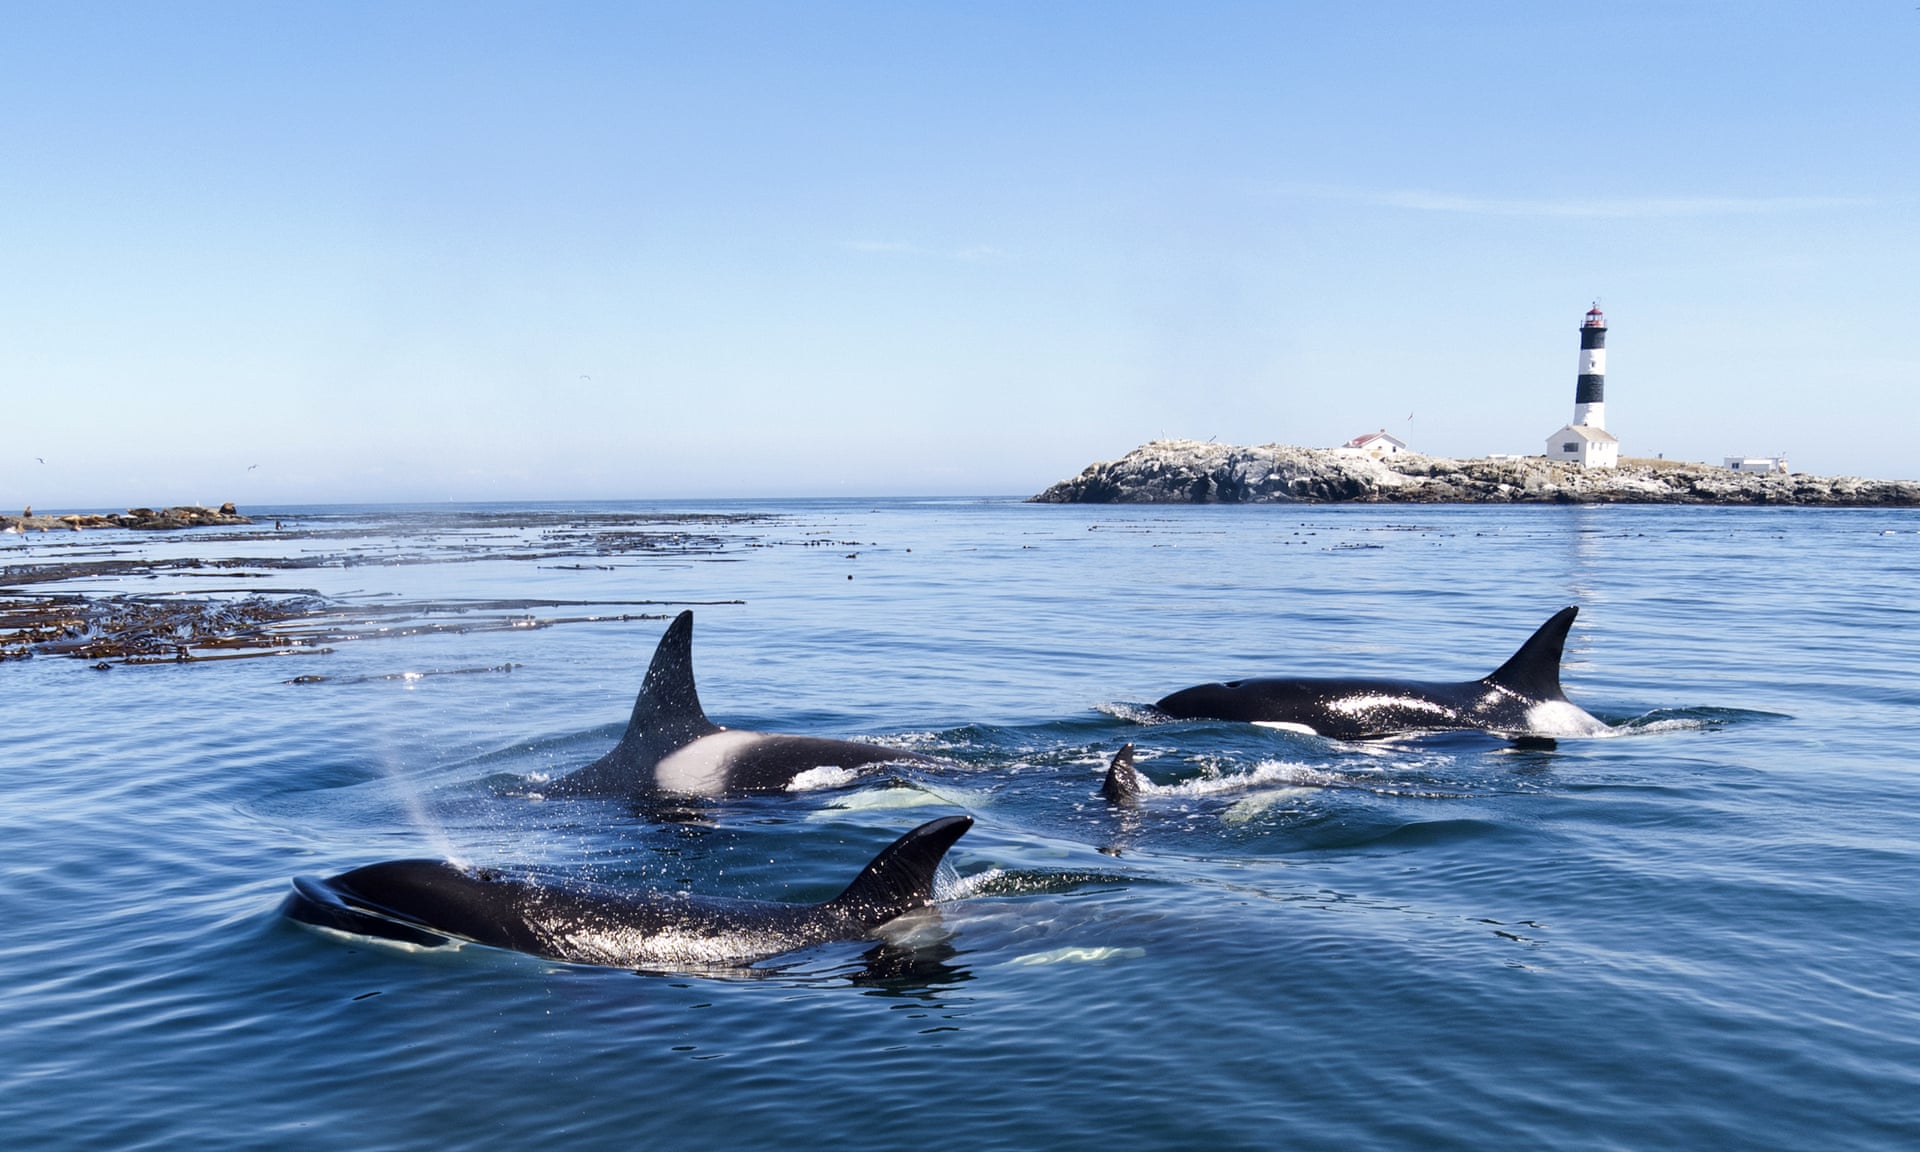
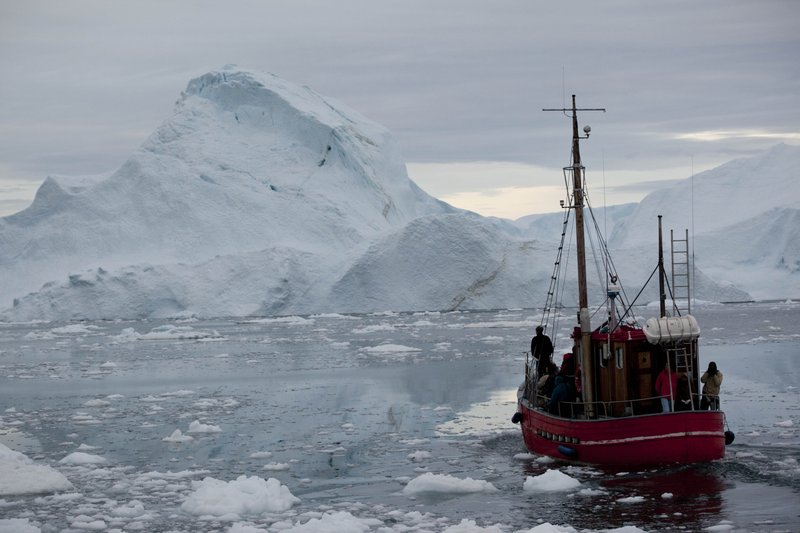
 Whales / Shrimps / Tonerre / Oil tanker / Sperm whale / Offshore platform / Trawl / Dolphins/ Iceberg