
Undersea mountains near
the Hawaiian Islands, from the Marine Geoscience Data System. Images of
the mountains and nearby seafloor are derived from sonar readings taken
along the paths sailed by research ships.
Read more at: http://phys.org/news/2016-01-floor-ocean-focus.html#jCp
Read more at: http://phys.org/news/2016-01-floor-ocean-focus.html#jCp
Undersea mountains near the Hawaiian Islands, from the Marine Geoscience Data System.
Images of the mountains and nearby seafloor are derived from sonar readings taken along the paths sailed by research ships.
From Phys by David Funkhouser (Columbia Univ)
The bottom of the ocean just keeps getting better.
Or at least more interesting to look at.
In an ongoing project, mappers at Lamont-Doherty Earth Observatory have been gathering data from hundreds of research cruises and turning it all into accessible maps of the ocean floor with resolutions down to 25 meters.

You can see some of the results here, at a mapping site that allows scientists—and you—to zero in on a particular location, zoom in and download topographical maps of the ocean floor.
The Lamont data has also contributed to the latest version of Google ocean map, which now offers its own more closely resolved view of the ocean floor globally.
(You can take a quick tour of the updated Google map here.)
"I love looking at everything," said Vicki Ferrini, a scientist at Lamont who oversees the team that synthesizes the data and creates the maps. Ferrini may have absorbed more data about the ocean floor than anyone; a self-professed map and data geek, she says she has her own map of the oceans in her head.
"I really like these sinuous channels in the deep sea, they're very cool to me. … There [are] clearly concentrated areas of energy that are able to scour these river-like features through the seafloor. And the [mid-ocean] ridges are all pretty cool."

A map showing the tracks of research vessels where more detailed imagery of the seafloor is available.
The new data from
Lamont covers about 8 percent of the ocean floor, a fraction of the
oceans, but a sizable piece overall of the earth's surface. The data
mostly comes as a byproduct of scientific expeditions that send research
vessels criss-crossing the seas, explained Suzanne Carbotte, a
professor of marine geology and geophysics at Lamont. The cruises may
not be focused on ocean topography at all; but as the ships sail, they
keep their measuring instruments humming and collect sonar data.
The sonar sends a pulse of sound down through the water column, and uses the speed of the sound's return to calculate depth. Data from U.S. expeditions is archived by the National Oceanic and Atmospheric Administration. Lamont processes that data, gathers more from scientists around the world, and turns it into maps.
The Google ocean map, covering the entire ocean floor, relies mostly on data collected by satellite that is curated by the Scripps Institution of Oceanography, in partnership with NOAA, the U.S. Navy and the National Geospatial Intelligence Agency, with contributions from the Japan Agency for Marine-Earth Science and Technology and Australia Geosciences-AGSO. It also incorporates the more precise data from Lamont. (A video produced by Scripps at this site offers an interesting global tour of mid-ocean ridges.)
Read more at: http://phys.org/news/2016-01-floor-ocean-focus.html#jCp
The new data from Lamont covers about 8 percent of the ocean floor, a fraction of the oceans, but a sizable piece overall of the earth's surface.The sonar sends a pulse of sound down through the water column, and uses the speed of the sound's return to calculate depth. Data from U.S. expeditions is archived by the National Oceanic and Atmospheric Administration. Lamont processes that data, gathers more from scientists around the world, and turns it into maps.
The Google ocean map, covering the entire ocean floor, relies mostly on data collected by satellite that is curated by the Scripps Institution of Oceanography, in partnership with NOAA, the U.S. Navy and the National Geospatial Intelligence Agency, with contributions from the Japan Agency for Marine-Earth Science and Technology and Australia Geosciences-AGSO. It also incorporates the more precise data from Lamont. (A video produced by Scripps at this site offers an interesting global tour of mid-ocean ridges.)
Read more at: http://phys.org/news/2016-01-floor-ocean-focus.html#jCp
The data mostly comes as a byproduct of scientific expeditions that send research vessels criss-crossing the seas, explained Suzanne Carbotte, a professor of marine geology and geophysics at Lamont.
The cruises may not be focused on ocean topography at all; but as the ships sail, they keep their measuring instruments humming and collect sonar data.
The sonar sends a pulse of sound down through the water column, and uses the speed of the sound's return to calculate depth.
Data from U.S. expeditions is archived by the National Oceanic and Atmospheric Administration. Lamont processes that data, gathers more from scientists around the world, and turns it into maps.
Welcome to a Deep Sea Vents Tour in Google Earth, where you can watch
the deepest volcanic eruption ever captured on video at the West Mata
volcano, near Fiji and learn about the exciting discovery of
hydrothermal vents.
Columbia University's Lamont-Doherty Earth
Observatory highlights Ridge 2000 discoveries in this tour now visible
with the new underwater terrain data published in Google Earth from
Columbia's Global Multi-Resolution Topography Synthesis covering half of
the ocean that has ever been mapped in detail.
The Google ocean map, covering the entire ocean floor, relies mostly on data collected by satellite that is curated by the Scripps Institution of Oceanography, in partnership with NOAA, the U.S. Navy and the National Geospatial Intelligence Agency, with contributions from the Japan Agency for Marine-Earth Science and Technology and Australia Geosciences-AGSO.
It also incorporates the more precise data from Lamont.

The seafloor off the northwest coast of the United States and southwest Canada.
From the Marine Geoscience Data System.
The satellite data details small changes in sea surface height which, through gravity, reflect the underlying topography of the sea floor.
The latest version of the Scripps-NOAA ocean map offers a resolution of roughly 500 meters—an improvement over the earlier, 1 kilometer resolution.That means one data point for every 500-meter-square grid of the seafloor.
Even that rough picture is valuable, Carbotte said.
"The coarse data does a beautiful job revealing the detailed boundaries of earth's tectonic plates and other large-scale seafloor structures, and the map covers the entire ocean," she said.
Those measurements allowed researchers to discover a new "microplate" in the Indian Ocean—a remnant from the crustal shifts that sent the Indian subcontinent crashing into Eurasia, creating (and still forming) the Himalaya mountains.
Those measurements allowed researchers to discover a new "microplate" in the Indian Ocean—a remnant from the crustal shifts that sent the Indian subcontinent crashing into Eurasia, creating (and still forming) the Himalaya mountains.
Researchers studying that plate have come up with a more precise date for when that collision began, 47.3 million years ago.
But the finer resolution mapping processed by Lamont opens up other avenues for scientists.
But the finer resolution mapping processed by Lamont opens up other avenues for scientists.
"It allows you to study the active modern processes that shape the seafloor," Carbotte said, like earthquakes and undersea landslides that can flush sediments across long distances.

A section from the Marine Geoscience Data System map shows details along the mid-Atlantic ridge.
Scientists can dive into the maps and data and use various tools at the Marine Geoscience Data System site, created to provide free public access to marine geoscience data.
Lamont-Doherty serves as the host laboratory; funding comes from the National Science Foundation, and from Google.
The mapping page, here, has a "masking" tool (at the upper right) that allows the viewer to see the tracks of research vessels and contrast the sonar data results with the broader ocean map.
Some of the more interesting features include the deep ocean trenches, the zigs and zags of fault lines where earth's crust is forming and deforming, and massive oceanic plateaus and undersea volcanoes that reflect volcanic outpourings away from the mid-ocean ridges.
There are "fabulous canyons that carve the continental margins and channels that extend out into the deeper oceans," Carbotte said.
Scientists expect to see plenty of activity along the edges of tectonic plates including at the mid-oceanic ridges, where new crust is formed from upwelling and melting of the mantle below, and at subduction zones, where enormous slabs of earth's crust collide and one plate sinks beneath another.
2015 Ocean in Google Earth Global Map Update- After.
“We're updating the entire Google ocean at once- the Scripps, NOAA, US Navy, NGA, GEBCO SRTM15plus global ocean map and the Columbia Lamont high resolution ocean map synthesis together at the same time- something that we've never done before."
Six years ago, we launched an explorable ocean seafloor in Google Earth and Maps.
Since then, Google Earth has been downloaded over 2 billion times, and Google Maps has over 100 million users a month, enabling a new generation of virtual ocean explorers.
Three years ago, we released the 2nd major global update in partnership with the Scripps Institution of Oceanography, NOAA, the US Navy, NGA, and GEBCO with major contributions from IFREMER and the IBCAO arctic synthesis), resulting in a 1 km resolution global map.
Today, we announce our 3rd and biggest update to our global ocean map with the first ever SRTM15 global grid curated by Scripps Institution of Oceanography, in partnership with NOAA, the US Navy, NGA, and with major contributions from JAMSTEC (2.2% of the seafloor), Australia Geosciences- AGSO (0.5% of the seafloor) and Lamont-Doherty Earth Observatory at Columbia University with their latest high resolution synthesis.
There’s a brand new major discovery- the first microplate discovered in the Indian Ocean over an area larger than the state of West Virginia, named the “Mammerickx Microplate” after Jacqueline Mammericks, who is the author of all the original GEBCO maps in the Pacific Ocean.
The full data reference list is here.
New areas to explore include the Philippine Sea, Ryukyu Trench, the Seafloor fabric east of Hawaii, the continental margins around Australia, and the Reykjanes Ridge.
Incorporating data from 3 satellite altimeters significantly improves the spatial resolution of areas having no ship coverage.
The SRTM15 grid is in the public domain and available online here.
Our partners at the Lamont-Doherty Earth Observatory at Columbia University have curated more than 33 years of ship-based data from nearly 900 global research cruises conducted aboard more than 20 ships.
This latest update representing 3 years of work adds nearly 1.6 million ship-track km of coverage from 400 additional cruises conducted by 18 different institutions including the Schmidt Ocean Institute.
This release brings the total ship-track coverage to 28 million square km of the ocean at 100m resolution.
This is a 3% increase from the 2011 publication, bringing the total area in the Columbia compilation to ~8% of the ocean in high resolution.
High-res underwater mapping is vital to understanding important earth processes such as how tsunamis spread around the globe.
This is the best multi-resolution map of the ocean that’s been created in history.
Explore the ocean seafloor with Columbia University's Lamont-Doherty
Earth Observatory Global Multi-Resolution Topography (GMRT) Synthesis
covering half of all of the ocean that has ever been mapped in detail,
an area larger than North America.
You can also view new data of Cordell
Bank and the Gulf of the Farallones off of the California coast from
California State University Monterey Bay (CSUMB) along with a beautiful
50 meter synthesis of the Hawaiian Islands from the University of
Hawai'i at Manoa's School of Ocean and Earth Science and Technology
(UHM-SOEST).
But the new mapping has helped scientists see that there's also geologic activity in the broad interior spaces of the oceanic plates, Carbotte says, such as fields of volcanic seamounts of many sizes, and far-reaching channels of sediments transported into the deep ocean.
The finer resolution helps scientists study how the crust forms at mid-ocean ridges and then deforms before descending into earth's mantle, bending and faulting along subduction zones.
The finer resolution helps scientists study how the crust forms at mid-ocean ridges and then deforms before descending into earth's mantle, bending and faulting along subduction zones.
"With the new detailed data from many subduction zones, we can conduct comparative studies of this bend faulting and relationships to the rate of subduction, the age of the plate and sediment cover, and [that] helps us in … understanding the subduction process," Carbotte says.

Multibeam sonar
readings from the R/V Falkor opened up the details of Scott Reef, off
the west coast of Australia, to view at about a 10 m resolution, shown
here from the GeoMapApp.
Read more at: http://phys.org/news/2016-01-floor-ocean-focus.html#jCp
Read more at: http://phys.org/news/2016-01-floor-ocean-focus.html#jCp
Multibeam sonar readings from the R/V Falkor opened up the details of Scott Reef, off the west coast of Australia, to view at about a 10 m resolution, shown here from the GeoMapApp.
The process of
mapping the ocean floor in detail continues; there's enough data already
available to keep Carbotte, Ferrini and the staff busy for a long time.
Covering just 8 percent of the oceans has involved hundreds of cruises
over millions of miles. The oceans are so large that a thorough mapping
would involve an estimated 125 to 200 ship-years of cruises (mapping on
land, even on distant planets, can happen far more quickly using
satellites). The Lamont crew updates their maps every six months.
Lamont has been collecting measurements and other data about the oceans for more than half a century. The first comprehensive map of the global ocean floor was created by Lamont oceanographers Marie Tharp and Bruce Heezen and published in 1977. In the 1980s, another Lamont scientist, William Haxby, used satellite measurements to compose the first "gravity field" map of the oceans. Now, the same database contributing to Google Earth feeds Lamont's EarthObserver, a global scientific mapping application for iPads and other mobile devices.
When we step onto an airliner, "We have map displays at our seats that show the flight paths, and it used to be the ocean was just a single flat, featureless blue," Carbotte said. "Now they make use of these new ocean floor maps, so when you're flying across the middle of the Atlantic, you can see the mid-ocean ridge right from your airplane seat."
Read more at: http://phys.org/news/2016-01-floor-ocean-focus.html#jCp
The process of mapping the ocean floor in detail continues; there's enough data already available to keep Carbotte, Ferrini and the staff busy for a long time.
Covering just 8 percent of the oceans has involved hundreds of cruises over millions of miles.
The oceans are so large that a thorough mapping would involve an estimated 125 to 200 ship-years of cruises (mapping on land, even on distant planets, can happen far more quickly using satellites).
The Lamont crew updates their maps every six months.
Lamont has been collecting measurements and other data about the oceans for more than half a century.
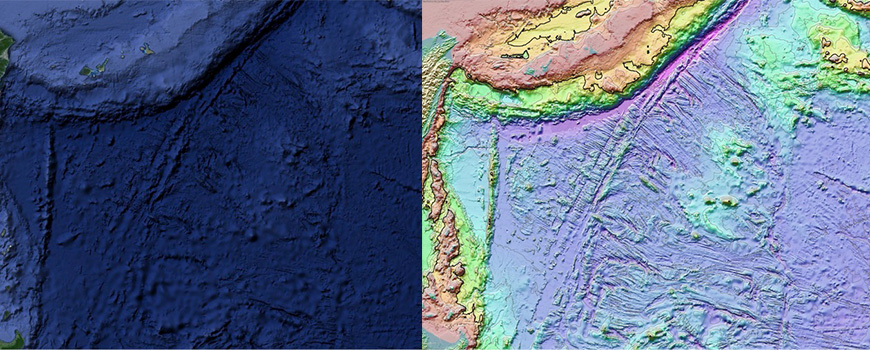
New Global Seafloor Map Incorporated into Google Ocean
Updated Google Earth image at right shows new seafloor features in the western Philippine Sea compared to earlier version
see : Scripps
Lamont has been collecting measurements and other data about the oceans for more than half a century.
The first comprehensive map of the global ocean floor was created by Lamont oceanographers Marie Tharp and Bruce Heezen and published in 1977.
In the 1980s, another Lamont scientist, William Haxby, used satellite measurements to compose the first "gravity field" map of the oceans.
Now, the same database contributing to Google Earth feeds Lamont's EarthObserver, a global scientific mapping application for iPads and other mobile devices.

When we step onto an airliner, "We have map displays at our seats that show the flight paths, and it used to be the ocean was just a single flat, featureless blue," Carbotte said.

Global map of ocean depths and land elevations,
with data mapped to colour (cyan to dark grey) by quantile.
courtesy of geotheory.co.uk
"Now they make use of these new ocean floor maps, so when you're flying across the middle of the Atlantic, you can see the mid-ocean ridge right from your airplane seat."
Links :
Links :
- GeoGarage blog : Seafloor features are revealed by the gravity field / New maps reveal California's sensational seafloor geography / Monterey Canyon: Stunning deep-sea topography revealed / New map exposes previously unseen details of seafloor / USGS maps California seafloor in unprecedented detail /'Un-mappable' Great Barrier Reef finally mapped in 3D / Bing Maps now shows ocean floor topography / Marie Tharp: the woman who mapped the ocean floor / Secretly mapping the sea floor / New bathymetry in Google Earth / New map reveals New Zealand's seafloor in stunning detail / NIWA survey reveals deep water canyons off Otago coast (NZ) /A virtual first look at unexplored seafloor : Farallon islands / 3-D maps reveal depths of sea floor
Google Earth blog : New Sea Floor Map for Google Earth
ReplyDeleteNASA :New Seafloor Map Helps Scientists Find New Features
ReplyDeleteMaritime Executive : New Gravity-Field Map Made for Ocean Floor
ReplyDeleteGoogle Earth Bblog : Another look a the new Google Earth Ocean data
ReplyDelete