
This little dataviz shows the daily hourly totals per grid for 2020 - the frames towards the end show the cumulative yearly totals.
Also showing the link between bathymetry and fishing activity more clearly - i.e. concentrated activity around the Whittard Canyon.
with data from GlobalFishingWatch
source @CraigTaylorViz
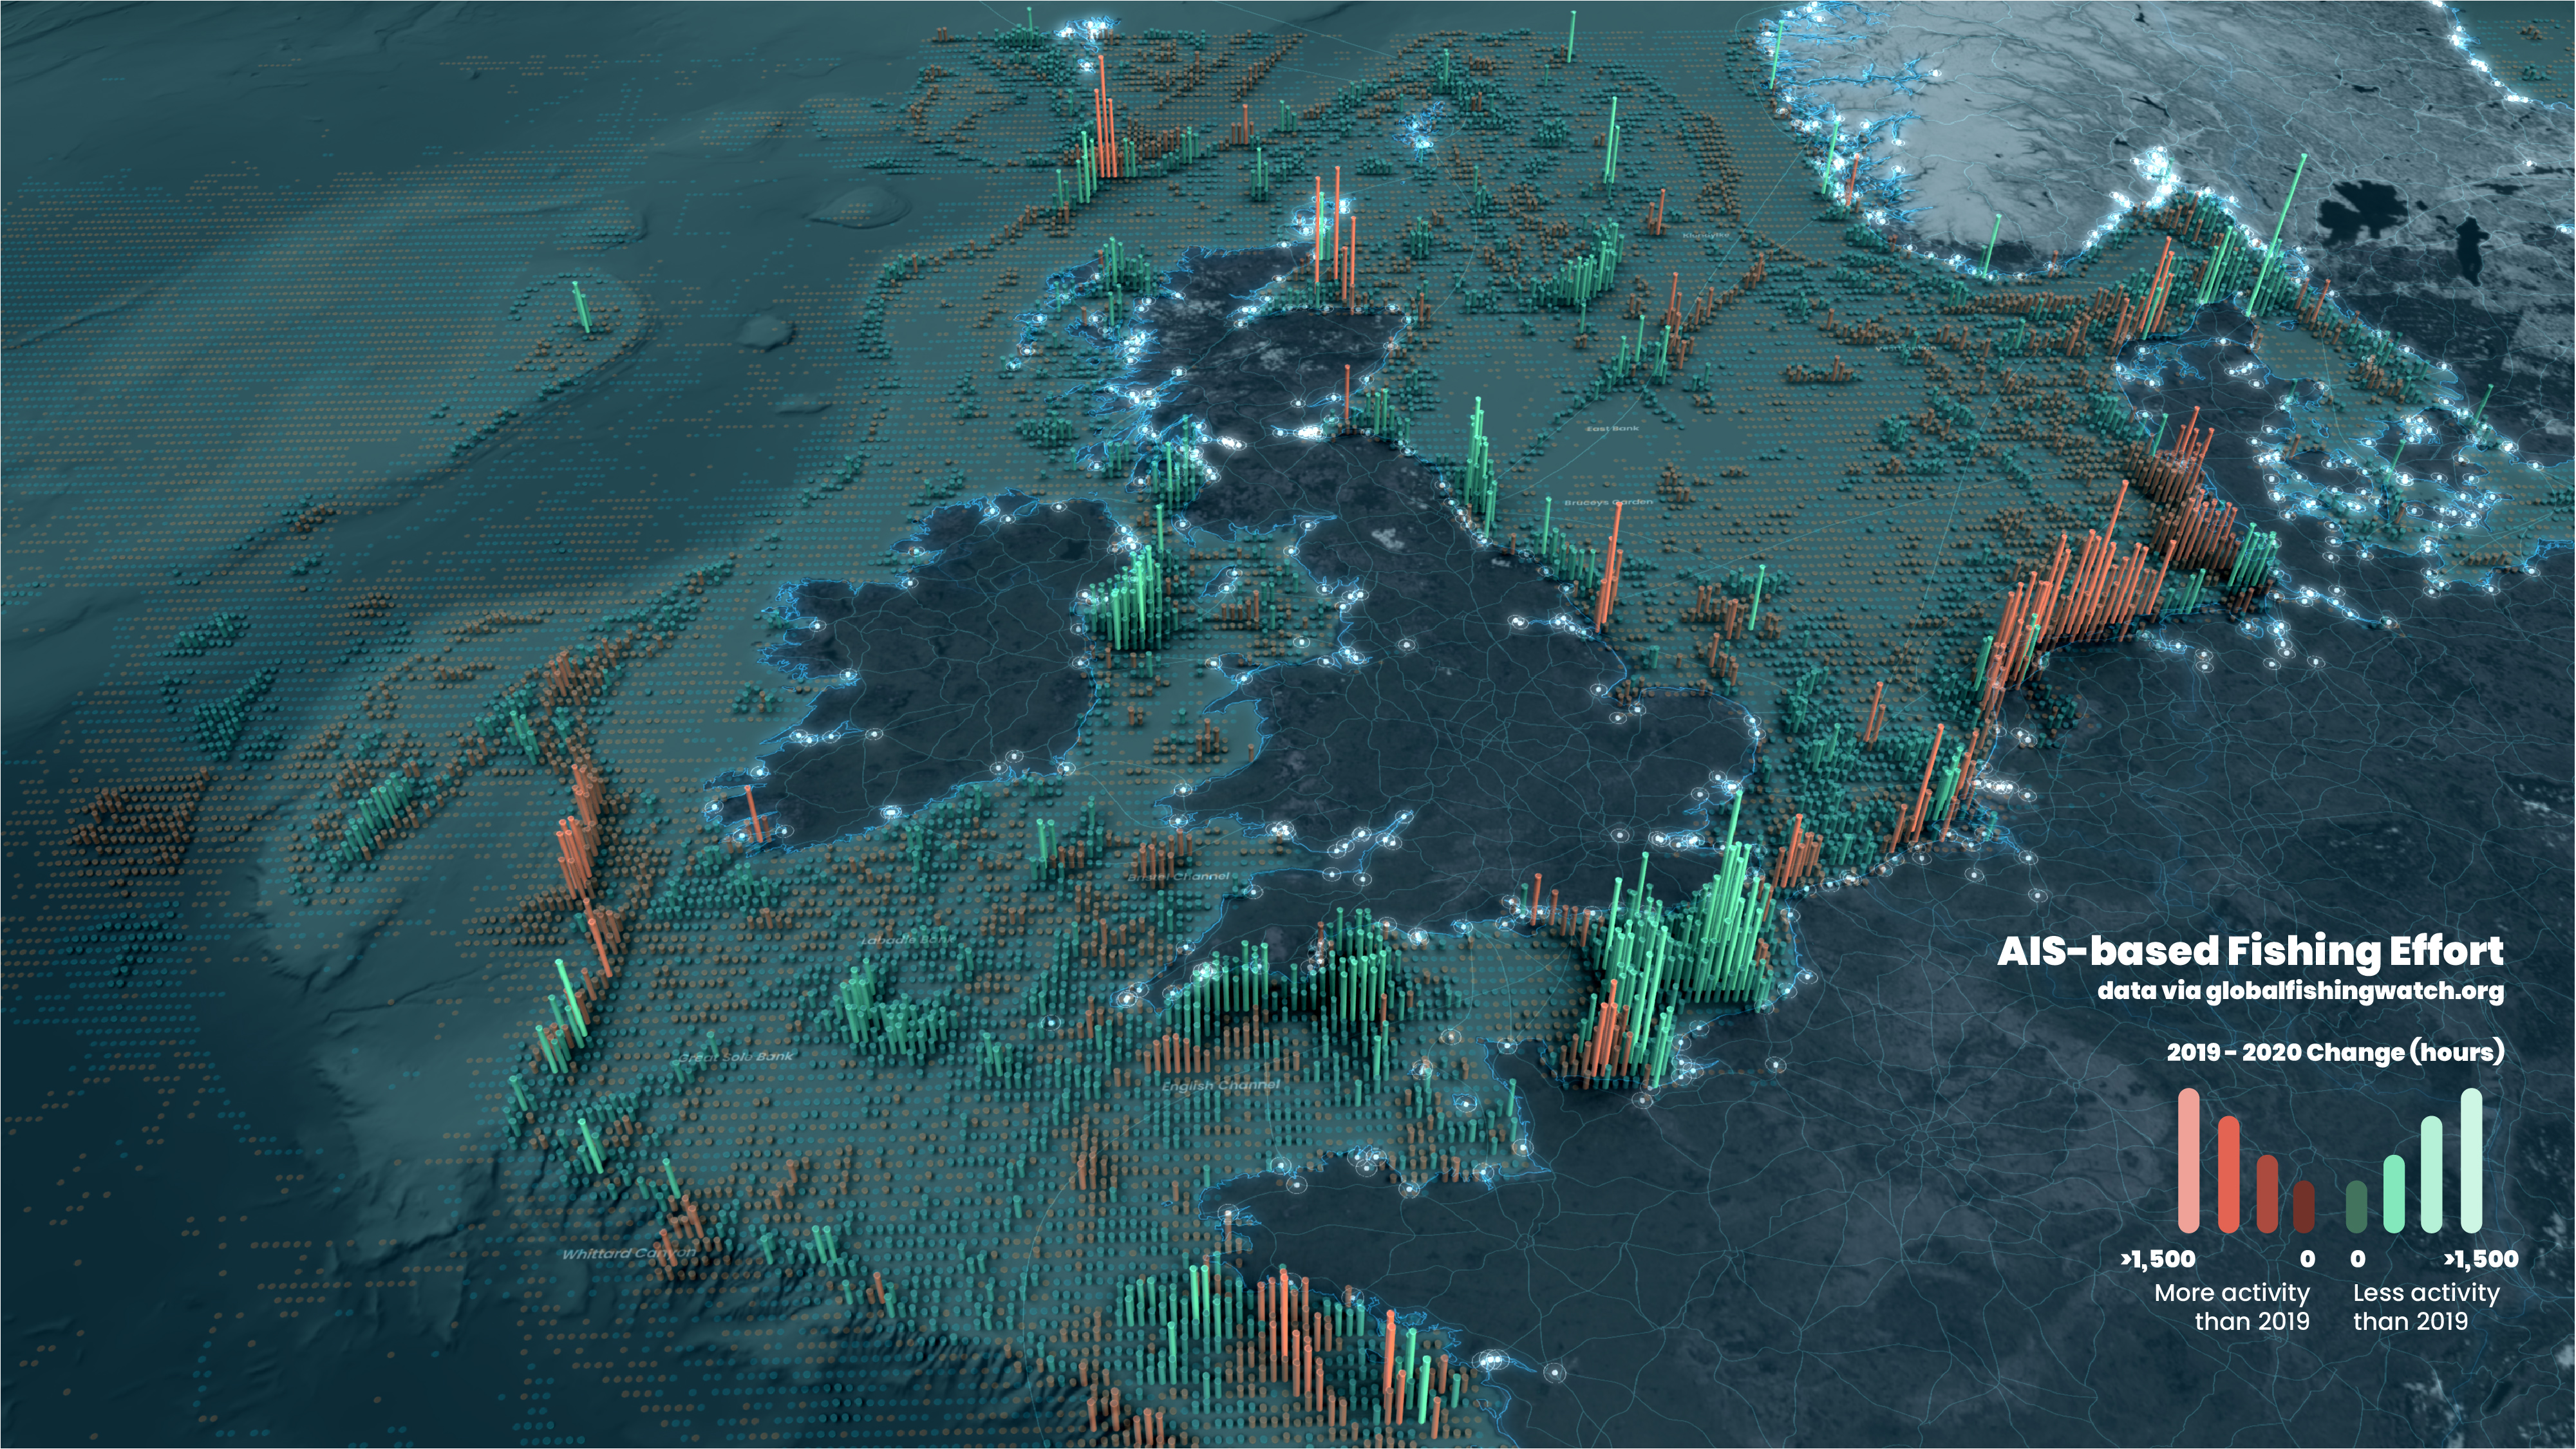
Here green pillars show areas where there was less fishing activity in 2020 than 2019, whilst orange shows areas where there was more activity. Taller the pillar - greater the delta.
No comments:
Post a Comment